
International Research Journal of Engineering and Technology (IRJET) e-ISSN: 2395-0056
Volume: 11 Issue: 06 | Jun 2024 www.irjet.net p-ISSN: 2395-0072
International Research Journal of Engineering and Technology (IRJET) e-ISSN: 2395-0056
Volume: 11 Issue: 06 | Jun 2024 www.irjet.net p-ISSN: 2395-0072
Debopriya Manna1 , Rohan Mondal1 , Arpan Sanyal1 , Ahana Biswas1 , Hritam Roy1 and Subhajyoti Barman2
1B. Tech, Dept. of Computer Science and Engineering, Techno India University, Kolkata, West Bengal, India. 2 Assistant Professor, Dept. of Computer Science and Business Systems, Techno India University, Kolkata, West Bengal, India.
Abstract - In every nation, Air Pollution has grown to be a serious problem. Among mankind's most serious issues, pollution in the air is one of the major contributors to health and climate change. Fears over rising air pollution, that could harm human health, the health of every living creature, and the advancement of the world economic growth,aresharedby both the government and the general population. For this reason, air pollution forecasting has become crucial. To address this issue, several deep learning models were applied. AQI was calculated to conduct this study. Various pollutioncausing gases like nitrogen dioxide, sulphur dioxide, carbon monoxide and ozone and particulate matter like PM10 and PM2.5 were studied. The vast quantity and diversity of data collected by air pollution monitoring stations across different cities have made air pollution forecasting an important topic. This research incorporates an LSTM (Long-Short Term Memory), ARIMA, Prophet Linear Regression, and Polynomial Regression. The dataset is primarily comprised of different pollution-causing components data collectedfromtheCentral Pollution and Control Board (CPCB). Our project aims to investigate the weather in several Indian cities and record their AQI level. Using additional variables, we attempt to determine the extent of air pollution. Eventually, we base our findings on the historical pattern of the graph. Based on the previous year’s pollution data, we attempt to forecast how the weather willevolveoverthefollowingseveral years. Different time series models were studied and the bestsuited model was decided based on different parameters. This paper utilises ARIMA, SARIMA, Prophet, Long short-term memory (LSTM), Linear Regression and Polynomial Regression. These models aim to find the future trend for the upcoming months. Root Mean Square Error (RMSE) was used as performance metrics to evaluate the models, along with it Mean Absolute Percentage Error (MAPE) was also utilised to assess the models.
Key Words: LSTM, ARIMA, RMSE, MAPE, AQI.
Inthelastfewyears,therehavebeenconstantchangesinthe environmentwhichledtodegradingairqualityduetothe presenceofvariousharmfulairpollutants.Airpollutionis the presence of harmful pollutants in the air that are
contaminating the indoor and outdoor air. Health and climate are being compromised due to air pollution. It is becoming a major threat to the environment. The major contributortoairpollutionisfineparticulatematterwhichis leading to lung cancer, acute and chronic respiratory disorders,heartattacks,andstrokes.
Vehicles,domesticenergyuseforheatingandcooking,and other sources are the main contributors to outdoor pollution,powergeneration,agriculture/wasteincineration, andindustry.TheprimaryairpollutantsarePM10witha diameter of less than 10 microns and PM 2.5 is more hazardous as it has a diameter of less than 2.5 microns. Sulphur Dioxide (SO2) and PM 2.5 are caused due to unburnedfuelandalsobyprocessedbyproducts.Duetofuel combustionNitrogenDioxide(NO2),Ozone(O3)andCarbon Monoxide(CO)areproduced.
COisthemostdangerousoneanditisalsoknownasasilent killer. It deprives the brain and heart of oxygen that is requiredbythebodytofunction,byenteringourbloodcells directlyandreplacingtheoxygeninourbody.Whenthereis anincreaseinthepollutantlevelsitleadstohumanslosing consciousness and vomiting. When the exposure to these harmfulpollutantsistoolong,itcaneventuallydamagethe braincellsinthebodyorcancausedeath.Thegovernment ofIndiausesPM10andPM2.5asthemajorcriteriaforAir QualityIndex(AQI)calculation.
The calculation of AQI comprises a minimum of three parametersoutofwhichonemustbeeitherPM2.5orPM 10.Thecalculationofsub-indicesrequires16hoursofdata. For the Calculation of AQI, the Sub-indices for individual pollutantsatamonitoringlocationarecalculatedusingtheir 24-houraverageconcentrationvalue(8hoursinthecaseof COandO3)andhealthbreakpointconcentrationrange.The sub-indexthatwillbeworst,istheAQIforthatlocation.
Equation:
Isi =[((Cobs –Cmin)(Imax –Imin))/Cmax –Cmin]+Imin
Where,
Isi =Sub-indexvalueofobservedpollutant
International Research Journal of Engineering and Technology (IRJET) e-ISSN: 2395-0056
Volume: 11 Issue: 06 | Jun 2024 www.irjet.net p-ISSN: 2395-0072
Cobs =Observedpollutantconcentration
Cmax = Maximum concentration of AQI breakpoint that contains Cobs
Cmin = Minimum concentration of AQI breakpoint that containsCobs
Imax =MaximumAQIvaluecorrespondingto Cobs
ILo=MinimumAQIvaluecorrespondingtoCmin
Asilentkilleristakingawaythelivesofmillions,yetmost people remain unaware of its danger. World Health Organisation (WHO) has been warning us regarding this threatbutitusuallyremainsunnoticedamongthemasses. Approximately 7 million premature deaths are caused becauseofthisissue.Amongthesedeaths,55%arecausedby heartfailure,21%byrespiratoryinfectionandtheother24% by other lung diseases. In addition to these certain psychologicaldisorderssuchasAlzheimer'sarealsoaffecting some groups of people. Poor air quality significantly increases mental health risks like depression by 50%, personalitydisordersby162%,andschizophreniaby148%. According to the IQAir website among the top 50 polluted citiesglobally,42ofthemareinIndia.Researchfromvarious cancerinstitutesshowsthatwhilemostlungcancerpatients adecadeagoweresmokers,now50%ofdiagnosedpatients haveneversmoked.
TheWHOstudiedtheindoorairqualityofseveralseverely pollutedareasanddiscoveredsomethingincommonwhich wastheuseofMudandKerosenestoves.Theuseofthese stoves significantly increases the emission of CO2, CO, Sulphur Oxides and Nitrogen Oxides, leading to higher pollutionlevelsindoors.Thishasbecomeasignificantissue atthesmall-scalelevelitself.Attentionmustbegiventothese small-scalesourcesbecauseaddressingthemiscrucial,thus solutionsmuststartathome,bytacklingindoorairpollution first and further can create a ripple effect that raises awarenessanddriveslargerpublicinitiatives.Onlythenwe canbuildacomprehensiveapproachtoimproveairquality andsafeguardpublichealth.
1.2
This thesis will be concerned with the following research questions:
RQ1. “HowcanDataMiningTechniquesdevelopair pollutionpredictionsystemsinsmartcities?”
RQ2. “How can it be beneficial in providing better healthtohumansbyforecastingAQI?”
RQ3. “HowcananIOT-baseddevicewhichisfitted withsuitablesensorshelpinbringingdownair pollutiononasmall-scalelevel?”
RQ4. “How will the entire model help the general publicinthefuture?”
Objectivesforthisstudyareasfollows
• ToanalysestudiesrelatedtoAQI.
• To decide the most suitable time series algorithm usedtopredicttheAQI.
• To evaluate the performance and accuracy of differentmodelsanddiscoverthemostsuitable timeseriesalgorithmforpredictingAQI.
• Tobuildamodelforasmall-scaleradiustocombat indoor air pollution, detect AQI and provide preventivemeasures.
2. Literature Review
Thissectioncomprisesinformationaboutresearchpapers relatedtotheAirPollutionPredictionSystem.
Thispapercomprisesairqualitypredictionwhichuses deeplearning.ItemphasizestheLongShort-TermMemory (LSTM)model.Ithadagoaltoanalysetheweatherconditions in various cities across India and to correlate them with observedAQIvalues.Ithelpstounderstandtheextentofair pollution in different regions by searching various factors thatcontributetoit.Ituseshistoricalweatherdata,whichis further attempted to predict future weather patterns and possible effects on the quality of air. In the beginning, statisticalmodelssuchasVARMAwereusedtoanalysethe trends, but after encountering limitations, the project was further switched to the LSTM model to achieve better performance. Once the improvements were seen in the predictive capabilities when machine learning algorithms were used in place of previous approaches. Applying the methods, helped to provide insights into the AQI levels of various cities across India. Depending on the error values obtained from their predictive models for the cities of Kolkata, Bangalore, and Hyderabad it was found that the LSTMmodeloutperformstheothermethodswhenitcomes toMeanSquaredError(MSE)forpredictingAQIvalues.
InthecaseofKolkata,theMSEfortheVARmodelis 81.52,forVARMAitis76.911,andforLSTMitis22.94.
ForBangalore,theMSEforVARis82.03,forVARMA is73.23,andforLSTMitis14.94.
International Research Journal of Engineering and Technology (IRJET) e-ISSN: 2395-0056
Volume: 11 Issue: 06 | Jun 2024 www.irjet.net p-ISSN: 2395-0072
InHyderabad,theMSEforVARis85.63,forVARMA itis51.61,andforLSTMitis13.12.
The decreased MSE values indicate better predictive performance, and for the above case, LSTM consistently demonstratedthelowestMSEacrossallthreecities.Thus,it suggeststhattheLSTMmodelismoreeffectiveinpredicting AQI values accurately and also captures the correlations withinthedata.[1]
ThefollowingstudyconsistsofRecurrentNeuralNetwork (RNNs)andLongShort-TermMemory(LSTM)units.Itwas usedtodrawinsightsfromthetimeseriesdataonairquality andalsometeorologicalconditions.Thispaperalsoaimsto understandtheadvancedresearchonurbanairqualityand thushelpsgovernmentsinformulatingbeneficialpoliciesby providing valuable information. Further, the forecast of PM2.5 and AQI values presents several challenges as the influenceofvarious factorsonairpollutionthusmakingit difficulttodiscernpastrepetitivepatterns.Atfirst,themodel wastrainedonlyonthefirstpartofthedatasetcomprisedof valuesfromJanuary2015toJune2017andthenthelearned weightsweretransferredtothesecondpartwhichcomprised data from June 2017 to March 2018. The testing part was conducted on the data collected from February 2018 to March10th,2018.InthecaseoftheSeouldataset,itcontained completeinformationfromJanuary2008toApril2018andit consistedofover2millionhourlyrecordsacross25districts. Thismodelwastrainedondatafrom2008to2016,andthe testing part was performed on data from January 2017 to April2018.Twentypercentofthetrainingsetwasrandomly set aside as the validation set. The joint of multiple RNN layers,MeanAbsoluteError(MAE)lossfunction,andtransfer method yield outstanding prediction results, with MAE provingmoreeffectivethanMeanSquaredError(MSE).The depictedmodeldemonstratessignificantresultsthatpredict PM2.5andAQIbasedonhistoricalmeteorologicaldatathus contributingtopolicy-makingandresourceallocationefforts., Mean Absolute Error (MAE) loss function and transfer methodyieldoutstandingpredictionresults.Thus,proving that MAE yields more effective results than MSE. The Test Root Mean Squared Error (RMSE) for 2017-2018 with differentsettingsshowstheperformancescoresfordifferent modelsettingsovertimeintervalsrangingfrom8hoursto24 hours. Two datasets are utilized: Joint Dataset and Seoul Dataset,alongsidevariationsinmodelarchitectures:RNNs and RNN. In the case of the Combined Dataset, models incorporatingRNNsshowanincreaseinscoresfrom26.27at 8 hours to 31.29at 24 hours. In contrast, the RNN variant startsslightlylowerat25.93andfollowsasimilarupward trend,reaching31.52after24hours.Incontrast,usingthe SeoulDatasetwithRNNsproduceshigherinitialscoresthan theJointDataset,startingat27.51andincreasingto31.8at 24 hours, indicating a consistent improvement over time. Overall,thepresentedmodelprovidespromisingresultsfor predicting PM2.5 and AQI using historical meteorological data, with potential applications in policymaking and
resource allocation. In the future, more evaluation and refinementofthemodelarerequiredtopredicttheaccuracy forfutureapplications.[2]
ThispaperfocusesonusingTimeSeriesAnalysisofair quality indicators which is used to forecast air pollutant concentrations. This casespecificallyfocusesonSO2, NO2, andPM10andfocusesonthecitiesofMargaoandSanguem locatedinGoa,India.Theresearchwasconductedusingtime series forecasting which used Auto-Regressive Integrated Moving Average (ARIMA) and Long Short-Term Memory (LSTM) models. The performance of these models was measured.ThispaperusedMeanAbsolutePercentageError (MAPE) and Root Mean Square Error (RMSE). When the comparison between both ARIMA and LSTM were done results were found that prediction using the LSTM model givestheairpollutionconcentrationmoreaccurately.Itwas alsofoundthattheMAPEandRMSEperformancemeasures showthattheLSTMmethodoutperformstheARIMAmodel. By taking an example from the above paper it is found in Margao, that the ARIMAmodel yieldsthehighestMAPEof 15% for PM10 air pollutants. In contrast, for NO2 air pollutants in Sanguem, both ARIMA and LSTM models produceaMAPEof3.3%.ThefollowingaretheMAPEand RMSE values for each algorithm across various cities and pollutants:
Margao(SO2):UsingARIMAMAPE=5.7304andRMSE= 0.6444;UsingLSTMMAPE=3.6485andRMSE=0.3697.
Margao(NO2):UsingARIMAMAPE=7.3615andRMSE= 0.9967;UsingLSTMMAPE=6.1957andRMSE=0.8001
Margao(PM10):UsingARIMAMAPE=15.6621andRMSE =6.577;UsingLSTMMAPE=9.3682andRMSE=4.5959
Sanguem(SO2):UsingLSTMMAPE=9.6743andRMSE= 0.9534;UsingLSTMMAPE=6.5892andRMSE=0.6964
Sanguem(NO2):UsingLSTMMAPE=3.3521andRMSE= 0.5688;UsingLSTMMAPE=3.3661andRMSE=0.5784
Sanguem(PM10):UsingLSTMMAPE=5.7695andRMSE =3.3945;UsingLSTMMAPE=3.9679andRMSE=3.1323
Overall, the above values depict the accuracy of each algorithm in predicting the pollutant concentrations, with lower MAPE and RMSE values which suggest better performance.Inmostcases,theLSTMmodeloutperformsthe ARIMA model which demonstrates its effectiveness in forecastingairpollutantconcentrations. [3]
The following research comprises of Long Short-Term MemorymodelwhichisapowerfultypeofRecurrentNeural Network (RNN). It is used to predict sequential data in severalfieldslikestock,markettrends,etc.Aboutairquality prediction, LSTM models can forecast AQI levels using historical data from weather station sensors. The LSTM's
International Research Journal of Engineering and Technology (IRJET) e-ISSN: 2395-0056
Volume: 11 Issue: 06 | Jun 2024 www.irjet.net p-ISSN: 2395-0072
operationalmechanismconsistsofthreekeygates.Theyare the input gate, the forget gate, and the output gate. These gateshelptocontroltheflowofinformationwithintheLSTM unit.Itfurtherdecideswhichdatatokeep,discard,orsendto otherunitsinthenetwork.Theproposedsystemtrainsthe LSTMmodelwiththeuseofhistoricalairqualitydatafroma weatherstationinBeijing,China.Thedatasetinthisprojectis divided into training and testing sets. After the division preprocessingtechniquesareusedbeforethedataisfedinto theabove-mentionedmodel.TheNetworkparametersareset that include the optimizer, which is critical for improving neural network performance. The Adam optimizer which helpsinadaptabilityandefficiencyindetermininglearning rates,isusedinthisstudy.Multiplepollutantscontributeto air pollution and influence PM 2.5 concentration. The optimizerwassettoprovidedifferentlearningratesforeach pollutantfeature,therebyimprovingthemodel'spredictive accuracy.TheMeanSquareError(RMSE)metricisusedto calculate errors, and the proposed model had an error of around 0.1. The paper introduces a robust approach for estimating pollutant concentration levels quickly and accurately. It ensures a wide range of applications, which includes weather stations and user-centric platforms. Notably,theprojectedPM10concentrationforthenexthour is 27.149012, with a mean square error of 0.0009564670581444191. The model showed impressive performancemetrics,withatrainingscoreof0.00004anda testingscoreof0.00017.[4]
Airpollutionisoneofthemostimportantenvironmental issues regarding the health of public and the nature worldwide. It results from various reasons like industrial activities,vehicleemissionsandsmokereleasedbyfossilfuel burning. Air pollution results in climate change and respiratory health problems, cardiovascular diseases and evencanleadtocancer.TheIOTmodelproposedhereuses Raspberry Pi which relates to the Arduino Uno microcontroller.SinceRaspberryPi2modelBdoesnothave inbuiltWIFI,soWIFIadapterisused.DSM501Aisusedasa Particulatemattersensor.DHT22andBMP180temperature, pressureand humiditysensors areused.MQ9andMQ135 sensorsareusedforgasconcentrationdetection.Thedatais sentovertheMQTTserverandaccessedbytheclient.The systemexhibitsmediumtolowcost,lowpower,compactand highaccuracy.[5]
Asproposedhere,SmartAiristocollectaccurateindoor air quality data. STM 32 F407IG is used here as the microcontroller. Laser Dust sensor PM2007 is used. This sensor can detect specifically PM 2.5 and PM 10. GSBT11P110 volatile organic compound sensor is used to detect hydrocarbon-basedpetroleumproductsintheair.RCU890L LTEactsasthenetworkingmodule.Herethedataisstored usingMySQLdatabase.Basedontheresultsairqualitywas accessedandpeoplearoundwerenotifiedtoimprovetheair quality. The proposed system achieved many merits like, accurate monitoring and alert system. It enhanced the
securityofdataandplatformsusingAmazonwebservices.It alsoshowsanexpandableinterface,whereinstallationand additionofnewsensorsiseasy.[6]
TheproposedmodelhasMQ2,MQ4andMQ135sensors oftheMQseriesgassensorswhereTin-Oxide(SnO2)isused asasensingelement.GP2Y1010AU0Fanopticaldustsensor wasused.Ithasasensitivityofupto0.5mg/m3.Thesoftware setupcomprisesthreeparts.Firstly,aCprogramisuploaded to the memory of the Arduino controller for the collection and transmission of data. Then an Android application receivesthedataandstoresitinaCSVfileandacloudservice receivesit.Inthisstudy,thehourlydatahasbeencollectedat two different stations intheDelhi-NCR regionupon which timeseriesmachinelearningmodelsareusedtopredictand forecastthefutureAQI.[7]
In this model, the esp8266 module is used as the IOT gateway. The System proposes to measure indoor temperature, pressure, and air quality and make the user awareofanyundesirablechangeintheenvironmentleading toproblemsintheirlives.Thecollecteddatawillbeanalysed anddatapatternscanbeextracted.Here,DHT11andK-30 infraredCO2sensorsareused.Theesp8266moduleislowin cost,reliable,useslesspowerandcansenddataoverTCP/IP network.Themodelcansendmessagesandalertpeopletoo. [8]
Thesurveydealswiththecapacitytoanalyseandmake choicesbasedonthecurrentactivitycircumstanceinthecity given by the progressing checking of contaminants. Past enquiry has utilized a few AI gadgets to foresee contamination;inanycase,comparativeexaminationofthese procedures is regularly fundamental to get a way better understandingoftheirpreparingtimesfordifferentdatasets. Pre-processing the time arrangement is a portion of this method.TheyhaveexploredtheutilizationofEnergeticTime Distorting,LSTM,andARIMAfortimeseriesforecast;inany case, pre-processing involves a similitude degree. Kmeans and Back Vector Relapse are at that point utilized to categorizethespatio-temporalcontaminationinformationof different places over ten years. The results illustrated that KmeansclusteringtakenafterbyARIMAcanbeutilizedfor timearrangementdesires.EnergeticTimeDistortingisaway better measure tocalculatethe arrangement between two timeseries.Inthelongfinal,ARIMAcanbeutilizedtomake time-seriesrelapseoverbunchesforafigure.Theseoutfits withone-timearrangementrelapselineforeachgathering.It can,inthefuture,beamplifiedtocoverthetimearrangement information,withmorecomputationcontrol;itcanbecarried out at an hourly premise. This gives a more drilled/scrutinizedinvestigationofthetime-seriesdata.[9]
This investigation survey gives a comparative time arrangement examination of the ground level and the remotelydetectedmethodofdiscussingqualityestimation, appearingtheoutcomesinthebestaccessibledetermination to date and the day-by-day variety of the poisons and
International Research Journal of Engineering and Technology (IRJET) e-ISSN: 2395-0056
Volume: 11 Issue: 06 | Jun 2024 www.irjet.net p-ISSN: 2395-0072
discussingqualityfileindifferentplots.Thisarrangementof theconsideratetooincludedthedeterminationofmolecule matter2.5.Concurringwiththethink,thediscussedquality madestridesbyandlargeamidthelockdownperiods,but whenthelimitswerereleased,thesumofpoisonsexpanded oncemore.Itrecommendswaybetterqualityofdiscussionin theyear2020ascomparedto2019and2021.2.64%forthe year2020and5.27%fortheyear2021,andanexpanding rateof3%wasseenafterthelockdownperiod.Fortheyears 2020and2021,thelevelsofallthecriteriatoxinswereless ascomparedtotheyear2019andtoohadadiminishingslant for the lockdown stages but for Ozone, which has an expandedconcentrationinthelockdownperiod.O3appeared anexpandingdriftfortheyear2020,thereasonowingtothe barometricalchemistrybetweenNO2andO3.R2valuesof theGWRdemonstratefortheprogressive,alongtimeare0. [10]
Theinvestigationthinksaboutsurveyingtheexecutionof thethreebestinformationminingmodelsforforeseeingthe preciseAQIinformationinafewofIndia'smostcrowdedand contaminated cities. The manufactured minority oversampling method was utilized to equalize the course informationtogetsuperiorandsteadyresults.Itwasfruitful toaccomplishhigherexactnessbyutilizingthisnovelstrategy of adjusting the datasets, utilizing them, and at that point closely comparing the outcomes of both imbalanced and adjusted ones to guarantee that the adjusted ones were profoundlyexact.MeasurablemethodslikeRMSE,MAE,MSE, and R-SQUARE were at that point utilized to affirm the superioroutcomes.Thecalculationswererunutilizingboth datasets(withandwithouttheDestroyedcalculation),andan incrementof6to24%wasfound-6%inthesamecityand calculation. In the proposed work, irregular timberland relapseandCatBoostrelapsereliablydeliveredempowering outcomes after exhaustive testing of all three calculations was conducted in Modern Delhi, Bangalore, Kolkata, and Hyderabad. It shows that the CatBoost and irregular timberland calculations, when combined with destroyed utilizeddatasets,canabdicateamazingresultsforAQIutilize casesinIndia.This,inturn,mayempowerneighbourhoods, states,andgovernments,alongwithothercivicspecialists,to takeactivityanddirectthequalityofthediscussion.Asitis clear from the measurements over, utilizing these relapse modelsontheAQIinformationfrom2015to2020hasbeen effectiveindemonstratingthatourinventiveutilisationofthe destroyedcalculationhaspaidoffandexpandedtheprecision valuesoftheserelapsemodels.Theobjectiveistodistinguish patterns and offer recommendations for raising a city's discussqualityscore.Itisbeneficialtoexaminetheprimary contributingcausesandviableapproachestodecreasethem. [11]
The survey deals with dissecting and anticipating discussionqualityutilizinginformationfromtwoparticular zones in Kolkata- Victoria and Rabindra. With its accentuationonhyper-parametertuningtoachievethebest
exactness,thisisabnormalinthatitgivessmartdataaround theadequacyofmachinelearningcalculationsfordiscussing qualityexpectations.Becauseoftheenergeticenvironment, erraticnature,andanassortmentoftoxinsinputandtime, anticipating discussion quality can be troublesome. The negativeresultsofdiscussingcontaminationonindividuals, creatures, plants, chronicled places, the climate, and the biological system make reliable discussion quality fundamental. There has been a careful examination of the discussed contamination at two areas in Kolkata, to be specific Victoria and Rabindra, which contain six major discussed toxins, counting PM10, and PM2.5. The examination and examination of the information included information normalization, clear esteem filling, copy expulsion,andexceptionend.Thebestexactnessof97.98% wasfoundontheRabindradataset utilisingtheSVCshow, whereasthemostelevatedexactnessof93.29%wasfound from the Victoria dataset utilising the arbitrary woodland show after performing 5 fundamental classification calculations with suitable hyperparameter tuning. In the future,adatasetwithalongertimeperiodcanbeutilizedto test an outfit machine learning classification calculation, which will empower the consolidation of meteorological components like wind speed and temperature in the AQI courseexpectation.[12]
Theresearchthesisexaminestheefficacyofairpollution onpublichealth,particularlytheeffectsperiodofthepreand postcovid-19eruptionanditalsoshowstheneedfulnessthe regulatethequalityofair,especiallyindevelopingnations andassociatedwithcontagiousdiseasesi.e.includingLungs Cancer, Autism, Asthma, and Low Birth Weight. In this review, the uses of a machine-learning algorithm are to analysetheconcentrationofnotableairpollutantslikeSO2, NO2, PM2.5, O3,and PM10.This research identified major reductionsinpollutantssuchasPM2.5,PM10andNO2.Inthe timeofsocialdistancingandcomparingtheAQIdataofpre and post covid-19 pandemic, which shows that human activities are a major control for the quality of air which implieswhichenvironmentalmeasurestobetakensuchas reducing industrial emissions and other factors like to decrease in traffic congestion, which can improve the air quality, this paper presents the machine learning model LinearregressionandpopularTimeSeriesalgorithmssuchas LSTM,ARIIMA,andProphetandtheexperimentresultshows us the efficiency of the model in detecting the air quality indexandfuturepredictionofpollutantlevel.Generally,this survey elaborates on the condition of human activity, pollution of air,and publichealth. In thiscontext different techniques of machine learning provide the practical approachtowardthepredictionoffuturepollutionlevelsand analysisoftheairqualityindex,andaccordingly,important measures to be taken to reduce public health and the environmentlargely.[13]
Globallyairpollutionhasalwaysbeenalargeconcernto all and due to its worst effects. Accurate prediction in
International Research Journal of Engineering and Technology (IRJET) e-ISSN: 2395-0056
Volume: 11 Issue: 06 | Jun 2024 www.irjet.net p-ISSN: 2395-0072
forecasting the air quality and level of concentration of various ambient air pollutants are the most vital for efficaciouscontrolofpollution.Thissurveysearchesvarious techniques whichare veryuseful forthe prediction ofAQI and forecasting future pollutant concentrations, understandingAQIisverycrucialeversinceitservesasan indicator of the level of air pollution and thus induces the awareness of people towards their fatal effects and also attemptingtodecreaseitaccordingly.Thisresearchreviews themethodologiesandfollowsbyemphasizingtheArtificial NeuralNetwork(ANN)andlogisticRegressionforpredicting the AQI and hence pollutant level prediction. This review concludes that the study in future on this scope includes other parameters like meteorological data with other pollutantconcentrationsfortheAQI(AirQualityIndex)and toforecastmoreprecisely.[14]
The increasing severity of air pollution in the world, includingIndia,isofconcernduetoitsnegativeimpactson humanhealth.Predictionandforecastingofthelevelsofair quality and various ambient air pollutants are crucial in taking effective pollution control measures. Therefore, the literature review tries to find the techniques used for forecastingAQIandthelevelsofpollutantconcentrationsin thefuture.UnderstandingAQIisessentialbecauseitactsas an index of the status of air pollution, creating awareness among the public of its negative impacts and the need to reduceit.Thereviewgoesthroughthemethodologieswhich the researchers used to elaborate on techniques such as Artificial Neural Network, Linear Regression, and Logistic RegressionforpredictionofAQIandpollutantconcentration forecasting.Thereviewoftheliteratureshowsthatmostof theresearchershavefocusedtheirworkonAQIandpollutant concentrationforecasting,usingadifferentkindofmodelling approach.ANN,LinearRegression,andLogisticRegression are also other techniques common in forecasting AQI and pollutantlevels.Thereviewsuggeststhatfuturestudiescould widen their scope by incorporating additional parameters such as meteorological data along with pollutant concentrationsforthepredictionandforecastingofAQI.In essence,ourliteraturereviewaimstoprovideadeepinsight intoAQIpredictionandpollutantforecastingtechniquesand emphasizestheimportanceofsuchanattempttoaddressthis ongoingcrisis.[15]
Theconcernofairpollutionisescalatingandthereisa demandingneedforeffectivemonitoringsystemstoprotect humanhealthandecologicalbalance.Itexplainstheeffectof poisonous emissions from industries and vehicles on the quality of air, which further presents health hazards. The paper suggests the integration of ML technology into air pollutionmonitoringsystemstopredictthelevelofpollution in the future based on historical data. It specifies how a device can be implemented, collecting real-time pollution data,processingthatdatausingMLalgorithms,andstoring the results for further analysis. The study comes with forecasting various pollutants such as CO, SO2, O3, NO2,
PM2.5, and PM10, using the data on meteorological parameterstoimproveaccuracyinairqualityforecastingand Introduction to Air Pollution Monitoring: This paper gives importancetocontinuousmonitoringofairpollutiondueto its harmful effects on human health and the environment. This paper gives importance to determining the sources, intensity, and origins of pollution to take effective control measures. Utilization of Machine Learning: This paper suggestsusingMLalgorithmsfortheestimationofthefuture level of pollution. Several ML techniques, including Linear Regression, Decision Tree, Random Forest, and Artificial NeuralNetworks,areusedtopredictairpollution.
PredictionAccuracy:Thepaperpublishestheresultsof the prediction accuracy for different ML algorithms for variouspollutants.ResultsindicatethattheRandomForest algorithmyieldsbetterpredictionaccuracyfortheAirQuality Index(AQI)comparedtoothermethods.ExperimentalSetup: Thestudyoutlinesanexperimentalsetupofdatacollection from pollution monitoring stations, its software implementation through Anaconda Python, and the methodology of how machine learning modelling will be used.ThepaperconcludesthatML-basedpredictionmodels forairqualitygivepromisingresults.Suggestionsaremade for further research for the improvement of prediction accuracy and to increase the scope to include additional pollutantsandmetrologicalparameters.Overall,thepaper provides insight into leveraging ML techniques for air pollution prediction and points out the importance of continuousmonitoringformitigatingthedevastatingeffects ofairpollutiononhumanhealthandtheenvironment.[16]
Thestudyaimedtopredictairpollutionlevels(PM2.5,O3, NO2) and aerosol optical depth (AOD) at an urban traffic locationinNewDelhiusingamodellingapproachtimeseries simulation.Methodologically,satelliteaerosoldata(AOD550) fromTerraMODIS(Collection6)wereanalysed,aswellas average monthly concentrations ofair pollutantsand AOD from five 2012 to 2017. Simulations were performed with PM2.5, O3, NO2, and AOD over the same period, with forecastsextendingto2020-2023.Validationwasperformed on24monthsofinsituandsatellitedatafrom2018to2019. Resultsshowdiscrepanciesin2020duetopandemic-related shutdowns, consensus between modelled/forecasted data and observed data, and the effectiveness of the autoregressiveintegratedmovingaverageoverseriestime likeARIMAtosimulateandpredictairpollution.Datataken from CSIR-Central Road Research Institute (CRRI) and CentralPollutionControlBoard(CPCB)Indiaforairpollutant concentration (2012-2020) and MODIS AOD data for CSIR station -CRRI (2012-2020). The analysis shows an asymmetricandleptokurticdistributionofpollutantsfrom 2012 to 2017, a significant decrease in pollutant concentrationsin2020duetothelockdown,andthefitof ARIMAtotheMODISAODforecast,PM2.5andNO2inNew Delhi city. The study shows that ARIMA, combined with satellitedata,canbeausefultoolforpredictingaerosolsin
International Research Journal of Engineering and Technology (IRJET) e-ISSN: 2395-0056
Volume: 11 Issue: 06 | Jun 2024 www.irjet.net p-ISSN: 2395-0072
areaswithlimitedground-baseddata.Thestudyendedwith thefollowingmodelaccuracyvalues:
In the case of PM2.5 it is a good fit (Stationary Rsquared: 0.752, R-squared: 0.648), with moderate errors(RMSE:32.084,MAPE:26.522%),butpredictors arenotstatisticallysignificant(p-value:0.1025).
For NO2 it is a Moderate fit (Stationary R-squared: 0.585; R-squared: 0.383), moderate errors (RMSE: 17.672, MAPE: 41.479%), and statistically significant predictors(p-value:0.0000).
ForO3itisagoodfit(stationaryR-squared:0.700,Rsquared:0.537),withmoderateerrors(RMSE:16.246, MAPE:23.850%),andstatisticallysignificantpredictors (p-value:0.0001).
In the case of AOD550: Excellent fit (Stationary Rsquared: 0.744, R-squared: 0.824), with low errors (RMSE:0.105,MAPE:9.236%),butpredictorsarenot statisticallysignificant(p-value:0.1076). [17]
Afterstudyingthepaper,wegottoknowthatthispaperis aimedtopredictairpollutantconcentrationinmajorcitiesof IndialikeDelhiandAgra.Theneedforthispaperarosedueto the rising level of various air pollutants which in turn is causing various diseases. The authors collected a comprehensivedatasetofvariousairpollutants,weatherand trafficdata fromsourceslike the Central PollutionControl BoardofIndiaoveraspecificperiodoftime.Thedatasetis fittedtoanLSTMmodelwithinputofweatherdata,traffic conditions, festivals and holidays to accurately predict air pollutant levels. The model is then tested with some preexisting data. The predictedvalues are compared with the original values to determine the model's effectiveness. To calculate the effectiveness the authors used Root Mean SquaredError(RMSE)values.ThecalculatedRMSEvalues werelessthan15for12-hourforecasts,lessthan8for6-hour forecastsand5for1-hourforecasts.Goingtoconclusionthe paperemphasizestheaccuracyofairpollutionforecasting.It alsorecommendsadditionalresearchtopredictairpollution levelsofothercitiesofIndiawiththehelpofsensors,which inturnmayhelpthelocalgovernmentalbodiestoregulate policiestominimizeairpollution.[18]
After studying the paper on predicting air quality and pollutionlevelsindifferentregionswegettoknowituses statistical methods and machine learning techniques to predict and forecast the same. The paper shows us the approachthatcombinesstatisticaltechniquesliketimeseries analysis and regression with machine learning techniques likeAda-boostingtopredictPM2.5levelsinHyderabad.The authorshavecollecteddatafromKaggle.Thenthedatasetis fitted to model Linear Regression, Ada-Boosting and XGBoosting.ThemodelsarethenusedtopredictPM2.5values basedondifferentatmosphericandsurfaceparameters.The valuesarethencomparedwiththeoriginalvaluestocalculate
effectivenessviaparameterslikeRMSE,MAEandR2_score.In thecaseoflinearRegression,R2_scoreisaround0.5andfor Ada-Boosting, R2_score is around 0.38. In conclusion, air pollutionisasignificantenvironmentalissue,andimproving air quality by forecasting it can have a positive impact on publichealth.Thepaperalsosuggeststhatfutureworkcould be forecasting using deep learning techniques to improve accuracy.[19]
This paper focuses on the importance of raising awarenessaboutairpollutioninurbanareasandpresentsan IoT-based system designed to monitor and forecast air pollutionoverreal-timedata,withaspecialfocusonthecity ofSkopje.Itemphasizesthatasignificantproportionofthe world's population lives in areas where the air quality exceedsWHOguidelines,leadingtomillionsofdeathseach year. The capital of North Macedonia Skopje has a severe problemwithairpollutionduetoexposuretoPM2.5which resultsinearlymortalityandhighsocialcosts.Theexisting Skopjeairqualitymonitoringsystemhasseveraldrawbacks suchaspoorpollutantmeasurementslowspatialresolution andmalfunctioningsensors.ThestudysuggestsanIoT-based systemthatattemptstoincreasethevalueofdatabycreating anappropriatedataprocessingsubsystemtothrowlighton these issues. This subsystem focuses on enhancing the predictionoffuturepollutionlevelsandtheamountoftime requiredtoreachalarmthresholdsbyutilizingcutting-edge machinelearningtechniquesparticularlydeeplearning.The dataprocessingsubsystemincludesseveralkeysteps,suchas outlieranalysis,datasmoothing,handlingmissingrecords, and merging weather and sensor data. Deep learning techniques,suchasprincipalcomponentanalysisanddeep beliefnetworks,areusedtoaugmentdataandimprovethe reliability of predictive models. The pollution forecasting modelfocusesonthepollutantPM10andusesabidirectional short- and long-term memory model (BiLSTM), the performanceofwhichisevaluatedusingthemeansquared errororiginalcylinder(RMSE)onthePM10PollutantTest SetinthecentralcityofSkopje.
MSEvaluesofvariouspollutantssuchasCOare0.21,for NO2is0.06,forO326.13,forPM100.22,forPM2.5itis7.32 andSO2itis0.08.Althoughtheresolutionofthedataislow, theresultsofthepollutionpredictionmodelarepromising, thus demonstrating the potential effectiveness of the proposedsystem.
Inconclusion,thispaperintegratesthismodulewithIoT infrastructure for air pollution detection which will significantlyimproveoverallperformance,furtherallowing formoreinformeddecisionsandimplementationofstepsto proactivelylowerurbanairpollution.[20]
International Research Journal of Engineering and Technology (IRJET) e-ISSN: 2395-0056
Volume: 11 Issue: 06 | Jun 2024 www.irjet.net p-ISSN: 2395-0072
Serial Number Title Observation
1 Time series analysis of the Air Quality Index for several Indian cities[1]
2 A Deep Learning Approach for Forecasting Air Pollution in South Korea Using LSTM [2]
3 Time Series Analysis for Air Quality Forecasting[3]
The research uses VARMA, LSTM and VAR modelstopredictAQI.It uses MSE as a performancemetric.
The research uses the Encoder-Decoder (EnDe) model and LSTM model to predict air pollution. It uses performancemetricslike RMSE,MSEandMAE
TheresearchusesARIMA and LSTM to predict variousairpollutantslike SO2, NO2 and PM10 in two cities Margao and Sanguen. It uses performance metrics RMSEandMAPE.
4 Air Quality Index Prediction using LSTM[4]
5 Air quality monitoringsystem basedonIoTusing RaspberryPi[5]
The research uses VARMA, LSTM and VAR modelstopredictAQI.It uses MSE as a performancemetric.
The research is about how to monitor air pollutants (PM2.5, CO2and CO), temperature, relative humidity and pressure usingRaspberryPi.
6 Developmentofan IoT-based indoor air quality monitoring platform.[6]
7 An IoT-based sensingsystemfor modelling and forecasting urban airquality[7]
The research is about how to monitor Particulate matter (PM2.55 and PM10), hydrocarbon-based petroleumproducts(CO, CO2) in the air and humidity using a microcontroller.
The research is about how to monitor air pollutants (PM2.5, CO2, CH4 and CO), temperature, relative humidityandnoiseusing ArduinoUno.Thenusing the collected data, it
8 Air quality system using IoT for indoor environmental monitoring[8]
predicts AQI using the ARIMA model. It uses performance metrics RMSE, MSE, MPE, MAPE andMAD
The system in the research measures indoor temperature, pressure,andairquality and makes the user awareofanyundesirable change in the environment leading to problemsintheirlives
9 Air pollution predictioninsmart cities by using machine learning techniques[9]
10 Time Series Analysis of Air Quality of an Industrial District of India Using Remote Sensing andGIS:Impactof Covid-19 Lockdown[10]
11 Prediction of air qualityindexusing machine learning techniques: a comparative analysis[11]
The research uses ETD, LSTMandARIMAmodels topredictAQI.
The research is on the study of different air pollutantsandhowtheir concentration reached duringalockdown
12 Air Quality Monitoring Using StatisticalLearning Models for Sustainable Environment[12]
13 ANALYSIS AND PREDICTIONOFAIR QUALITY INDEX IN INDIA DURING PRE AND POST COVID PANDEMIC USING MACHINELEARNING ALGORITHMS[13]
14 Aliteraturereview onpredictionofair
The research uses Support Vector Regression, Random Forest Regression and CatBoost Regression model to predict AQI. It uses MSE, RMSE, MAE and R-Square as performancemetrics.
The research uses ARIMA, LSTM and Prophetmodeltopredict AQI. It uses Precision, Recall, F1-Score and Support as performance metrics.
The research uses ARIMA, LSTM and Prophetmodeltopredict AQI.ItusesR-Squareasa performancemetric
This research reviews the methodologies and
International Research Journal of Engineering and Technology (IRJET) e-ISSN: 2395-0056
Volume: 11 Issue: 06 | Jun 2024 www.irjet.net p-ISSN: 2395-0072
quality index and forecasting ambient air pollutants using machine learning algorithms[14] follows by emphasizing the Artificial Neural Network (ANN) and logistic Regression for predicting the AQI and hence pollutant level prediction
15 Air pollution prediction system for smart city using data mining technique: a survey[15]
16 Air quality prediction by machine learning [16]
This research reviews the methodologies and follows by emphasizing the Artificial Neural Network (ANN), Linear Regression, and Logistic Regressionforpredicting theAQI
TheresearchusesLinear regression,DecisionTree and Random Forest regression models to predict various air pollutants.
Dataminingisveryimportantforuncoveringpatternsin large datasets, often revealing correlations that were previouslyunrecognizedorignored.
In this project several Deep Learning and Machine Learning algorithms were employed like ARIMA, SARIMA, PROPHET, LSTM, Liner Regression and Polynomial Regression, to analyse the best model fit for future forecasting.
Weusedvariousmachinelearningalgorithmstoevaluateour dataset.Themachinelearningmodelsusedarelistedbelow.
17 Time Series Simulation and Forecasting of Air Quality Using Insitu and SatelliteBased ObservationsOver an Urban Region [17]
18 Time series-based LSTM model to predict air pollutant concentration for prominentcitiesin India[18]
19 Prediction of Air Quality and Pollution using StatisticalMethods and Machine Learning Techniques[19]
20 Smart city air pollution monitoring and prediction: A case study of Skopje [20]
The research uses the ARIMA model to predict variousairpollutantslike PM2.5, NO2, O3 and AOD550. It uses RMSE, MAPE and R-Square as performancemetrics.
The research uses the LSTM model to predict AQI. It uses RMSE as a performancemetric.
TheresearchusesLinear Regression,Ada-Boosting and XG-Boosting models to predict PM2.5. It uses RMSE,MAEandR-Square asperformancemetrics.
The research uses the BiLSTMmodeltopredict PM10. It uses MSE as a performancemetric
ARIMAisanautoregressiveintegratedmovingaverage. ARIMAutilizes timeseriesdata toanalyze the datasetand forecastfuturetrends.Theimplicitpremiseofautoregressive modelsisthatthefuturewill belikethepast.Itcomprises autoregression (AR), differencing (I), and moving average (MA)components.TheARcomponentinvolvesregressingthe variable onits past values,with the order(p)determining howmanylaggedvaluesareincluded.Differencing(d)isused to make the series stationary, ensuring consistent mean, variance,andautocorrelationovertime.Themodelinvolves steps such as identification (using ACF and PACF plots to determinepdq)estimation(fittingthemodelandestimating parameters) diagnostic checking (ensuring residuals resemble white noise) and forecasting (predicting future valueswithconfidenceintervals).TheMAcomponentmodels theerrortermasacombinationofpasterrortermswiththe order(q)indicatinghowmanylaggederrorsareused.The model is typically denoted as ARIMA (p d q). ARIMA’s versatility enables it to manage types of time series data making it applicable, in fields such as economics, finance, environmental science, engineering and public health. For instance, in our air quality initiative, we utilize ARIMA to examine information obtained from the CPCB and IoT gadgetstopredictlevelsofpollutantssuch,asPM2.5orPM 10.
SARIMA,short,forSeasonalAuto-RegressiveIntegrated MovingAverageservesasaversionofARIMAbyincluding aspects, alongside non-seasonal elements. This model is tailoredtoaddressrecurringpatternseffectivelyandhelpsin capturingbothprolongeddatarelationshipstoenhanceits capabilities.
Prophet
Prophet,atooldevelopedbyFacebookiscommonlyused for predicting time series data by utilizing a model that
International Research Journal of Engineering and Technology (IRJET) e-ISSN: 2395-0056
Volume: 11 Issue: 06 | Jun 2024 www.irjet.net p-ISSN: 2395-0072
accommodates trends through yearly, weekly and daily seasonalpatterns.Itproveseffectivewhendealingwithdata showing variations and possessing multiple seasons of historical information. The tool demonstrates resilience in handling missing data points and outliers. Moreover, it is structuredtofactor,inholidayimpactsandtransitionpoints enablingittocapturebothshort-termfluctuationsandlongterm tendencies. Its intuitive additive model comprises elements for trend analysis, seasonality assessment and holidayconsiderationsmakingitversatileforapplications. With its adaptability and reliability Prophet serves as a resource for forecasting across sectors such, as business, economicandenvironmentalmonitoringwheredatasetsmay exhibit intricate seasonal patterns and occasional disruptions.
LSTM,knownasLongShort-TermMemorybelongstoa typeofnetwork(RNN)designedspecificallytounderstand andlearnextendedrelationships,insequentialdata.Unlike RNNsLSTMnetworkshaveastructurethatinvolvesmemory cells and gating mechanisms like input, output and forget gates.Thesegatesplayaroleincontrollingtheinformation flowwithinthenetworkenablingittoretaindetailsoverlong periodswhilediscardingirrelevantdata.Thiscapabilityto grasp long-term dependencies makes LSTM particularly effective for predicting time series data in datasets with temporalpatterns.Itfindsapplicationsacrossdomainssuch as Natural Language Processing, Speech recognition and environmentalmonitoringduetoitsproficiencyinhandling sequential data with temporal links and providing precise forecasts,forfutureoccurrences.
LinearRegressionisatechniquethatiscommonlyusedto establishtheconnection,betweenadependentvariableand one or more independent variables by creating a linear equation based on collected data. With X representing the independentvariableY,thedependentvariable��1theslope ofthelineand��0they-interceptsastraightlineisplotted usingtheequation��=��0+��1��.A=B0+C1+D2+C+.+��nXnwhich is expanded and includes variables in Multiple Linear Regression. The primary aim of Linear Regression is to minimize the sum of variances between observed and predicted values. It finds applications in fields such, as finance,engineeringandenvironmentalsciencebyaidingin graspingunderlyingpatternsandmakingforecastsbasedon pastdata.
Polynomialregressionestablishesarelationshipbetween theindependentvariable(X)andthedependentvariable(Y) which is represented as an n-degree polynomial. More complex relationships are captured by the Polynomial regression that fits in a curved line. The polynomial
regression equation used generally is
bnXn.Here,b0,b1,b2,b3...bnare theformula'sspecialnumbers,andntellsyouhowcurvythe line is. This curve line helps us see more complicated connections between X and Y, especially when their relationshipisn'tstraightbutrathercurvesupordown.By making the curve line more curvier (increasing 'n'), it can followtheupsanddownsofthedatamoreclosely.But,ifwe makeittoocurvy,itmightstartfittingtoocloselyandnotbe usefulforunderstandingthebiggerpicture.Inapplications like environmental science, polynomial regression can effectivelymodelphenomenasuchaspollutantconcentration levels,whichmayexhibitnonlineartrendsovertime.
Weusedvariousmachinelearningalgorithmstoevaluateour dataset.Themachinelearningmodelsusedarelistedbelow.
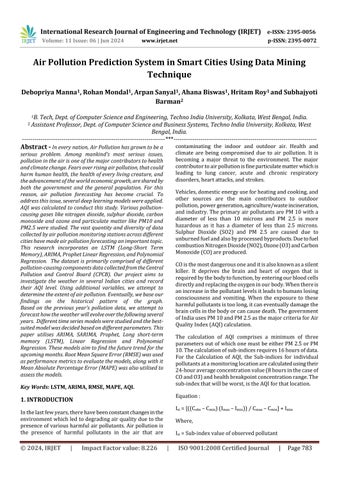
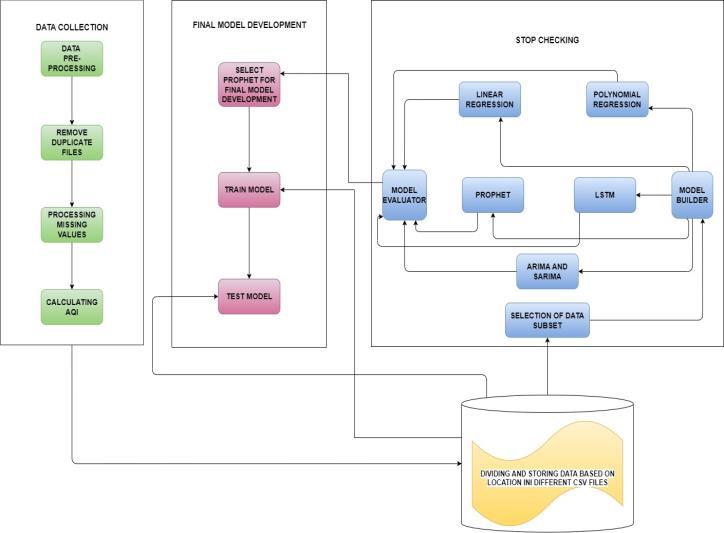
The following diagrams illustrate how our machinelearningmodeloperatesandhowtheIoTdevicecollectsdata andtransmitsittoourdatabaseforfutureuse.
International Research Journal of Engineering and Technology (IRJET) e-ISSN: 2395-0056
Volume: 11 Issue: 06 | Jun 2024 www.irjet.net p-ISSN: 2395-0072
Tocollectdata onvariousairpollutants,wedevelopedan IoTdevice.ThestructureandfunctioningoftheIoTdevice aredepictedbelow.
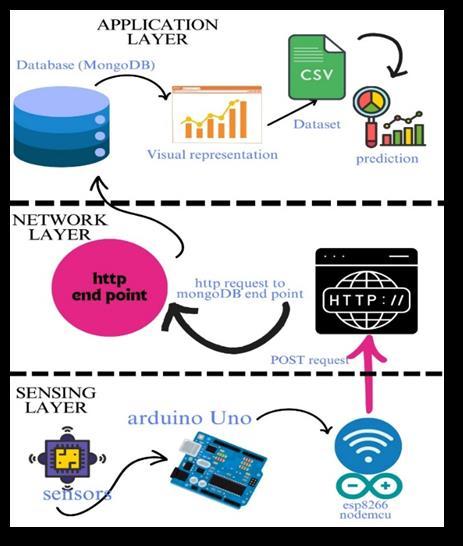
4.1 Components and their Usage in IoT Devices
Inoursetup,wehaveused Arduino Uno asithas6analogue pinstotakeinputfrommorethanonesensor.Italsohas14 digitalpinswhicharefurtherusedasSoftwareSerialfordata transfer.Insensors,weusedMQ-7,MQ-135,andMQ131gas sensors. MQ7 is the carbon monoxide sensor. MQ135 has been used to detect Sulphur dioxide and Nitrogen Dioxide andlastly, MQ131 astheozonegassensor.Allthesensors haveaVCC-GND,AOUTandDOUTdepictiveofthe+5vinput
voltage required, analogue output and digital output respectively. The Tin Oxide (SnO2) is the main sensing element in the above-stated sensors. As per the analogue outputfromthese,theMQUnifiedgassensorspackageinthe Arduinolibraryisusedtocalibratethemanddetectthegases.
PMS5003 digital infrared dust sensor is used to get the correctconcentrationofthesuspendedParticulatematterPM 2.5andPM10intheair.
Esp8266 NodemcuisusedfortheWIFImoduletotransfer data.TheRX/TXpinsofitarealternativelyconnectedwith theArduinoUno.
Neo-6M GPSisusedtogetthelatitudinal andlongitudinal locationofthemeasuringstation.
The IoT model is focused on gathering concentrations of various air pollutants, namely Carbon monoxide, Ozone, Sulphurdioxide,Nitrogendioxide,andparticulatematterPM 2.5 and PM 10 by utilising MQ series sensors and the PMS5003sensorforthispurpose.MQ-131detectsozonegas, andMQ-135detectsSO2andNO2gases.MQ-7detectsCarbon monoxide. PMS5003 shows PM 2.5 and PM 10 concentrationsintheair.DataiscollectedusinganArduino UNOboardwherealltheVccareconnectedto5VandGNDto GND.Analogdatareceivedinthesensorsareconvertedto digital reading using Arduino packages of the MQUnified sensorspackagelibraryandPMS5003Packagelibrary.The NEO-6MGPSisusedtodetectthelatitudeandlongitudeof thecentre.Thedataisthenconvertedintoaconcatenated string and passed to Esp8266 Nodemcu. The Nodemcu connectionsinvolvealternateRxandTxconnectionsfordata transfer. It is connected to a specific WIFI node. The NodemcudataissubsequentlytransferredviaHTTPrequest in the HTTP body to the HTTP End point of the dedicated databasehostedonaMongoDBserver.Thisdatacollectionis specificallytailoredforindoorairqualitymeasurement.This datasetwillserveasafoundationforsubsequenteffortsin predictingindoorairquality.
The data collection was carried out in two parts: one involvingdatafromtheCPCBwebsiteandtheotherfromour IoTdevice.
CPCB Data: We collected the main data from the Central Pollution Control Board (CPCB) of India (official website: https://cpcb.nic.in),whichisastatutoryorganizationunder the Indian government. The dataset that wecollected had 32440entrieswith8fields(Location,Date,PM25,PM10,O3, NO2,SO2,CO).Thesizeofthedatasetisaround2.0MB.The sampleofthedatasetisbelow.
International Research Journal of Engineering and Technology (IRJET) e-ISSN: 2395-0056
Volume: 11 Issue: 06 | Jun 2024 www.irjet.net p-ISSN: 2395-0072
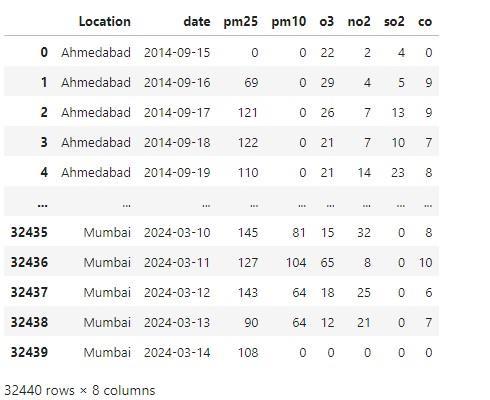
Figure 4: Air pollutant dataset in India (2014 - 2024) collected from the CPCB website
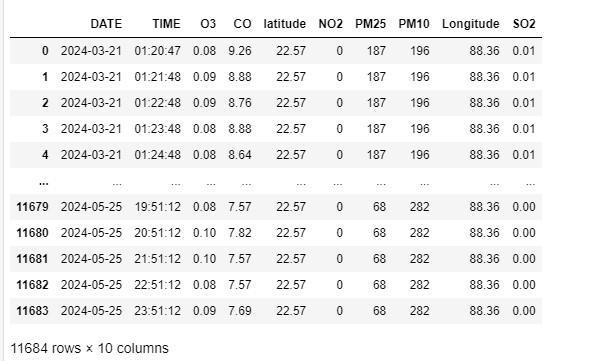
IoT Device Data: DatawascollecteddailyfromanIoT-based devicedevelopedaspartoftheproject,whichwaslocatedin Kolkata.Thisdevicecontinuouslymonitorsandrecordsair quality parameters in real-time. The data collection was done on an hourly basis and the current CSV file contains 11684rowsand10columns,andthesizeofdatais912.9KB. Thedatasetcollectedusingthedevicehasbeenuploadedto theKagglewebsite.
Thelinktothewebsite: https://kaggle.com/datasets/794d435b73dabe0a762cd5f 6b93911ef1f058bf8d25f24bcd0a8971306f02fa2
5:
5.1 DATA PREPROCESSING
When we loaded the data, we found the data was not suitableforourwork.Ithadproblemswithitstypeandhad manymissingvalues.So,thedatahadtobeprocessedina usefulformat.
Dataprocessingwasdoneinthefollowingsteps:
i.DataCleaning
ii.DataTransformation
iii.DataReduction
Data Cleaning: This process involves removing unwanteddatalikeduplicatedata,unformatteddataand incorrectdata.
In our dataset we saw that the format of the data was all object so we had to convert them to their respectivetype.
Thedatefieldhadtobeconvertedtoadate-time format.
Thelocationfieldhadtobeconvertedtostring format.
The various air pollutant fields had to be convertedtointegerformat.
Then we found many data had similar dates and locationssoweremovedthecopy.
Asforcheckingforincorrectdatawedidnotdoit, aswetookthedatafromagovernmentorganization.
As for the missing values we filled it with the nearestdatabecauseusuallypollutantsdonotchange muchinthenextday.
Data Transformation: This process involves the improvementofthestructureofdata.Thishelpsinbetter data-driven decision-making. This involves Normalization, Attribute Selection, Discretization and ConceptHierarchyGeneration.
WemadeanAQIfieldforourusage.
We normalized data before fitting it to various models.
We converted the daily data to a monthly mean valuebeforefittingittotheSARIMAmodel.
Data Reduction: This process involves reducing the size of the dataset while preserving the important information.SomecommonstepsinvolvedareFeature Selection,FeatureExtraction,Sampling,Clusteringand Compression.
We divided the whole dataset by categorising it accordingtolocation
IoT data device was used to collect pollutant data continuouslyonadailybasis.Eachday,theAirQualityIndex (AQI)wascalculatedfromthecollecteddata. The average AQIforeachdaywasthendetermined.Uponreviewingthe data,itwasfoundthattherearerecordsfor53consecutive days.ThisdatacollectionperiodstartsfromMarch21,2024, andextendstoMay25,2024.Duringthisentireperiod,the
International Research Journal of Engineering and Technology (IRJET) e-ISSN: 2395-0056
Volume: 11 Issue: 06 | Jun 2024 www.irjet.net p-ISSN: 2395-0072
device consistently collected pollutants and AQI was calculated, ensuring a comprehensive set of daily average AQIvalues.
Thedatacollectionanddatapreprocessingwereinitially where duplicate values were removed and missing values were processed. Then eventually the respective AQI was calculated corresponding to a unique date. The data was further divided and stored based on locations in different CSVfiles.
When we loaded the data, we found the data was not suitablefor our work.Ithadproblemsinits typeand had manymissingvalues.So,thedatahadtobeprocessedina usefulformat.
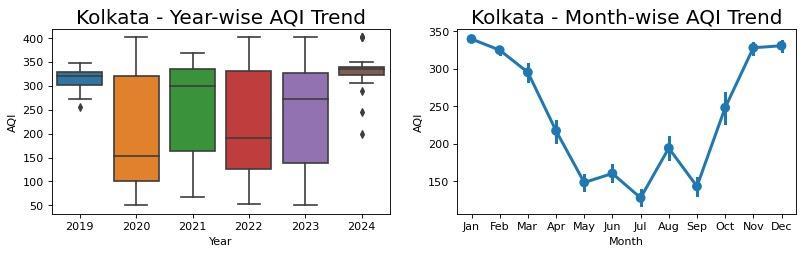
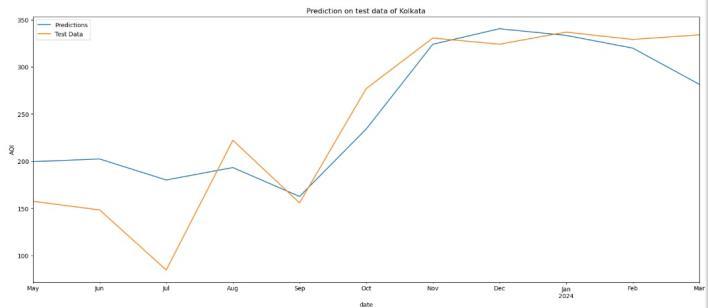
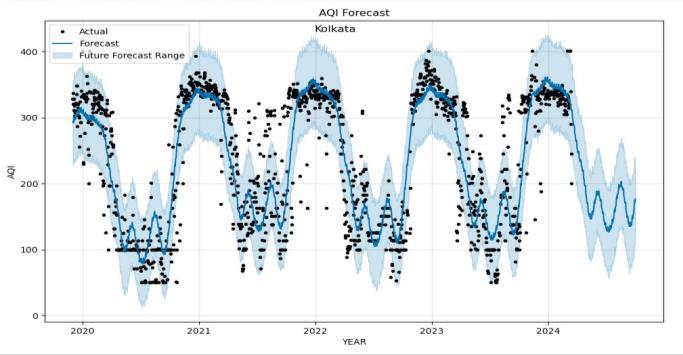
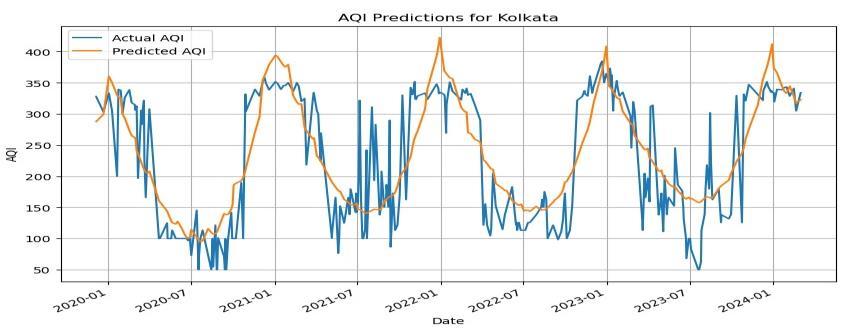
ARIMA and SARIMA were performed on the data to forecast AQI values for different cities. The SARIMA modellingprocesswasdefinedtohandleeachcity.Thedata wasresampledtomonthlyaveragesandplottedtovisualise AQItrendsovertime.Alongwithit,aboxplotwasplottedto showAQIrangedistribution.TheAQItimeserieswassplit into training and testing sets, and the best ARIMA model parameters were determined using the ‘auto_ARIMA’ function.ASARIMAmodelwasfittedtothetrainingdataand predictions were made on the test set. The plotting of predictionsagainsttestdataandtheentiredatasetwasdone includingfuturepredictions.
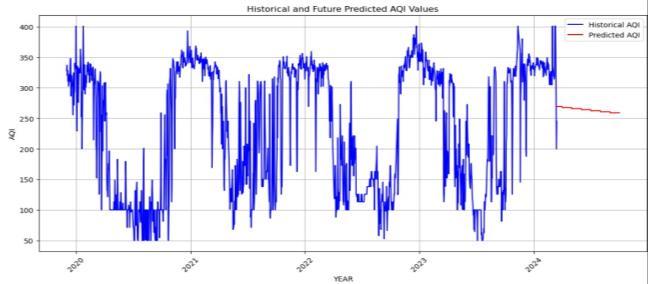
LongShort-TermMemorywasusedtoforecastairquality data,thatisAQI.Thedatasetwasconstructedandtrained andtheLSTMmodelwasevaluated.Themodelisbuiltwith an LSTM layer and Dense layer, compiled using Adam optimizerandmeansquareerrorlossfunction.Themodel wasfittedtotrainingdataandpredictionsweremade.Both actualandpredictedAQIvaluesforthetestsetareplotted andalsofutureAQIvalueswereforecastedbasedonunique citynamesforaspecifiednumberofsteps,visualizingthese predictionsalongsidehistoricaldata.
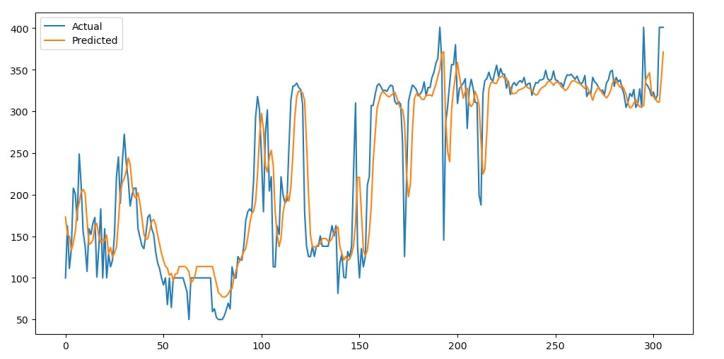
9: Graph between AQI and Date on Actual and Predicted Data
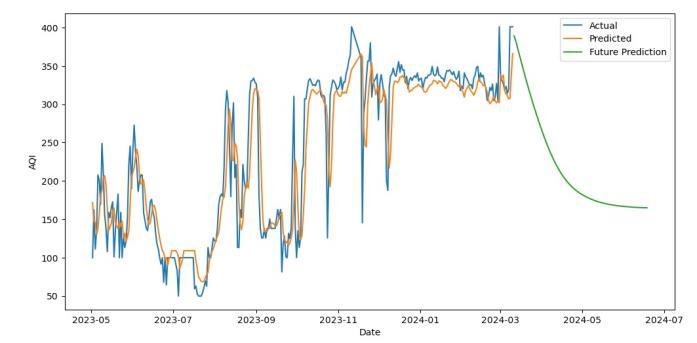
Figure 10: Graph between AQI and Date on Actual, Predicted and Future Prediction Data
International Research Journal of Engineering and Technology (IRJET) e-ISSN: 2395-0056
Volume: 11 Issue: 06 | Jun 2024 www.irjet.net p-ISSN: 2395-0072
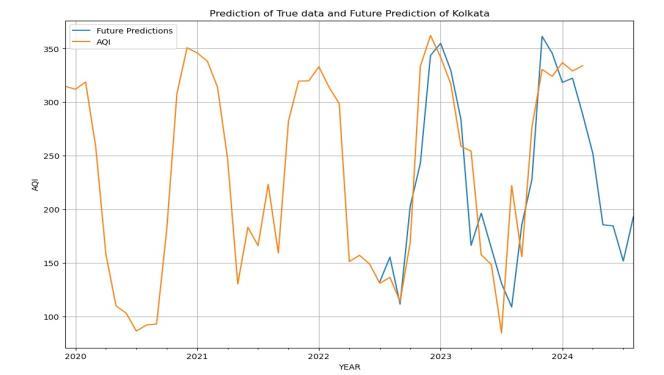
TheProphetforecastingtoolwasusedtopredicttheAQI forvariouscities. Thedatawasprocessedandforecasting wasperformed.Thecreationofnewcolumnswasmade‘ds’ and‘y’whicharerequiredbyProphetfrom‘date’and‘AQI’, respectively, and then data was resampled to monthly averages,fillinginmissingvalues.Thedatasetwassplitinto trainingandtestingandthenthefunctionwasinitializedand theProphetmodelwasrunonthedataset.Predictionswere made on the test set. Then graph was plotted on the forecasted values against the actual values, with the city name displayed on the plot. It was then fitted to another Prophetmodeltotheentiredatasetanditalsogenerateda futureforecastforthenext200days,thusvisualizingthese predictions along with actual values. In addition to the overall forecast, the trend was plotted, and yearly seasonality components were extracted by the Prophet modelwhichprovidedinsightsintotheunderlyingpatterns intheAQIdata.Thesevisualizationshelpedustounderstand bothlong-termtrendsandseasonalvariations.
6.6 IMPLEMENTATION USING POLYNOMIAL REGRESSION
Polynomial Regression was used to predict the AQI for various cities based on historical data. The data were processedandpolynomialfeatureswerecreatedandadded for regression. The linear regression model was fitted to polynomial features and data were split into training and testingsets.ItgeneratedfutureAQIpredictionsandplotting wasdone.
6.5 IMPLEMENTATION USING LINEAR
Linear Regression was used to predict the AQI for differentcitiesusinghistoricaldata.Thedatawassplitinto trainingandtestingsetsandthenfittedtoalinearregression model. The plotting was done for actual vs predicted AQI valuesandalsofuturepredictionsof200daysaregenerated.
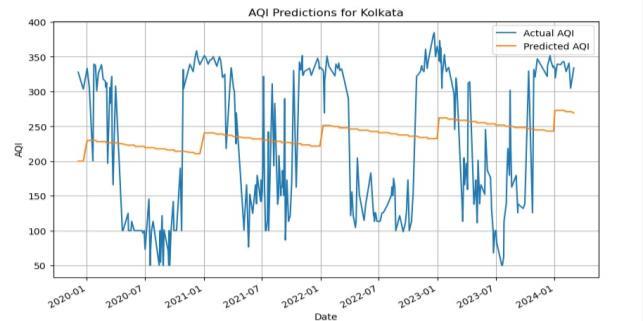
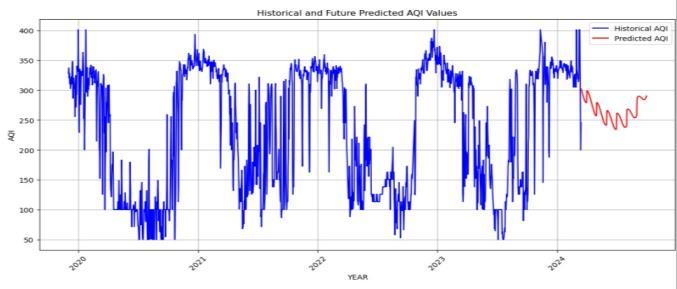
Figure 15: Graph between AQI and Date on Original and Predicted Data
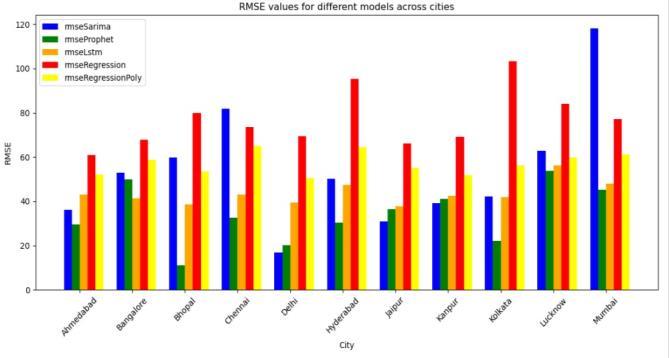
6.7COMPARISONS OF MODELS FOR ALLLOCATIONS
Themodelimplementationwasdoneinall11cities.The cities are Ahmedabad, Bangalore, Bhopal, Chennai, Delhi, Hyderabad,Jaipur,Kanpur,Kolkata,LucknowandMumbai. LikeKolkata,asshownabove,asimilarevaluationwasdone fortheother10citiesaswell.
International Research Journal of Engineering and Technology (IRJET) e-ISSN: 2395-0056
Volume: 11 Issue: 06 | Jun 2024 www.irjet.net p-ISSN: 2395-0072
16:
17:
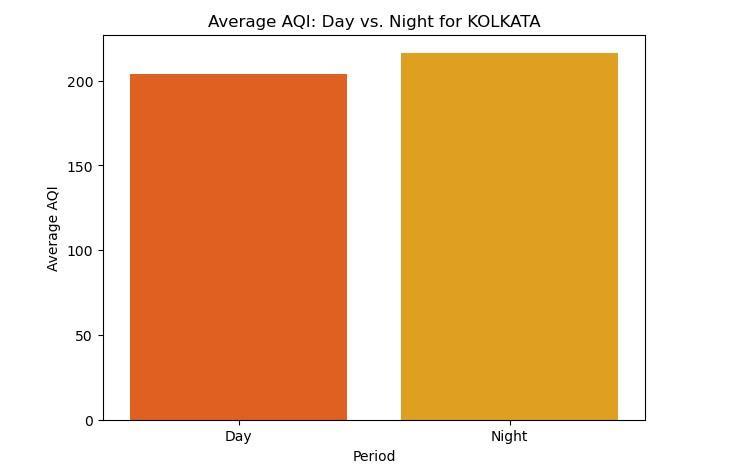
6.8 MODEL IMPLEMENTATION FOR INDOOR AQI PREDICTION
DATA VISUALIZATION FOR INDOOR DATA
It was also observed that the AQI at night was more comparedtoday.
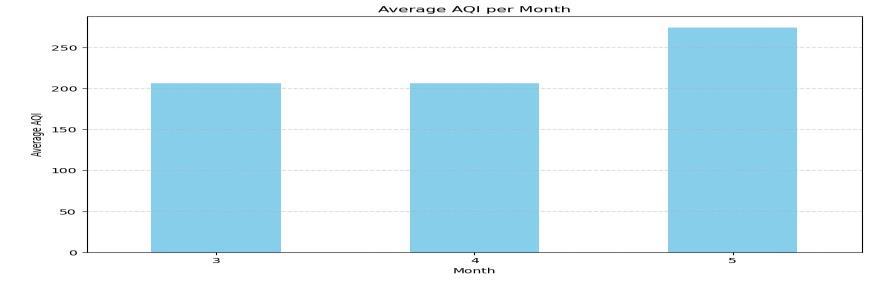
Figure 18: Monthly average AQI Visualization
6.9 PROPHET MODEL IMPLEMENTATION FOR INDOOR AQI PREDICTION
Afterimplementingthemodels,itwasfoundthatthebest modelevaluationwasgivenbyPROPHET.Thus,thismodelis alsousedinfuturepredictionsforindoorAQI
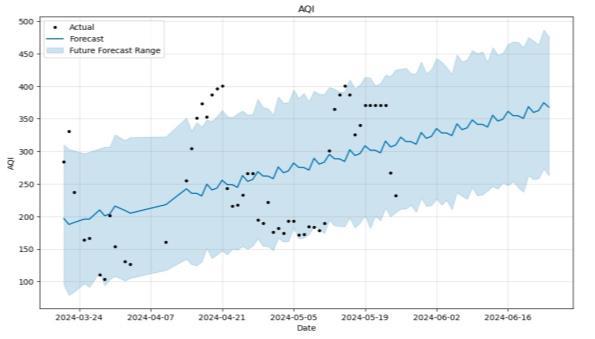
20: Graph between AQI and Date on Actual and Forecasted data with Future Range Data
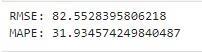
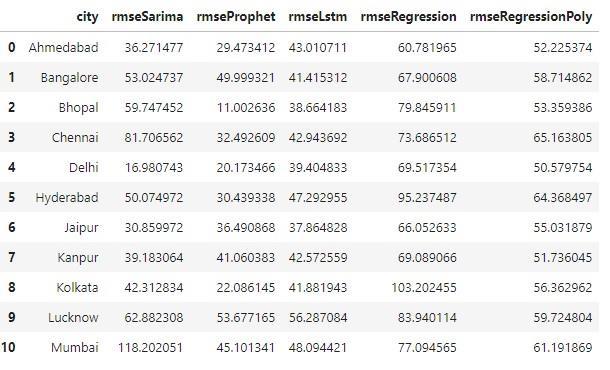
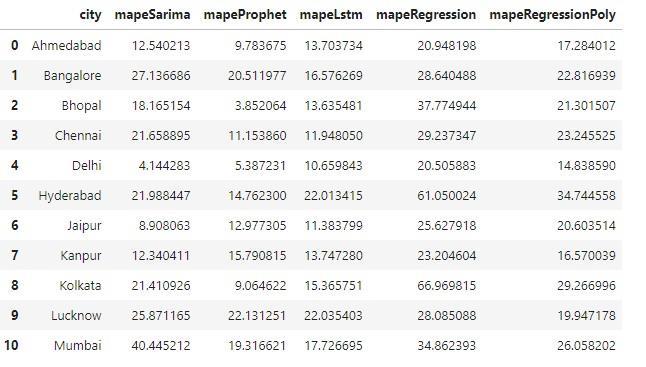
21: RMSE and MAPE evaluation
7. MODEL PERFORMANCE COMPARISON
Performance evaluation is an important part of the implementationofthemodels.Ithelpsustounderstandthe bestmodelsuitableforourproject.Themodelperformance has been carried out using two measures. The analysis is carried out based on computations which were done by comparingtheactualvaluestothepredictedoutcomes.The Root Mean Square Error (RMSE) and Mean Absolute Percentage Error (MAPE) were used to check the performance of the model by performing necessary evaluations.
International Research Journal of Engineering and Technology (IRJET) e-ISSN: 2395-0056
Volume: 11 Issue: 06 | Jun 2024 www.irjet.net p-ISSN: 2395-0072
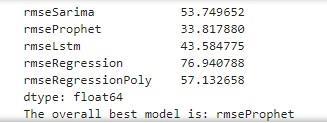
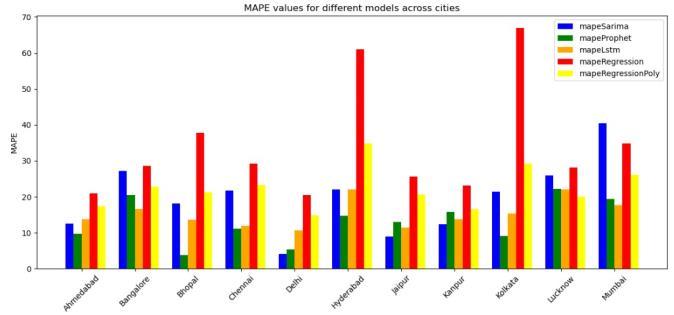
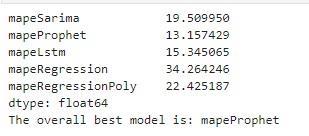
After comparing it is found that the best model is Prophet.ThemodelhasameanRMSEof33.817880anda mean MAPE of 13.157429 which is less than the other models,thereforeimplyingthattheProphetmodelisgood forforecastingAQI.
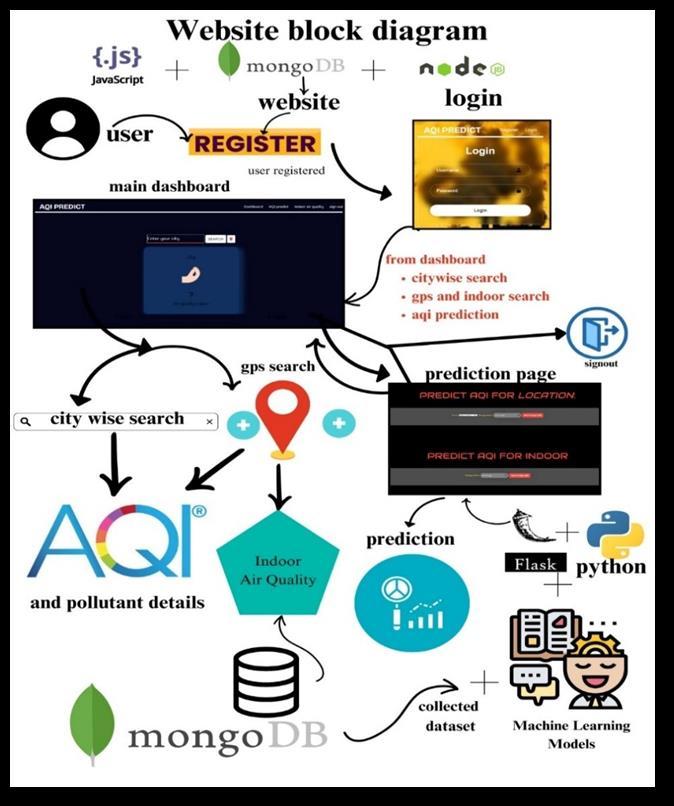
8. WEBSITE DEVELOPMENT
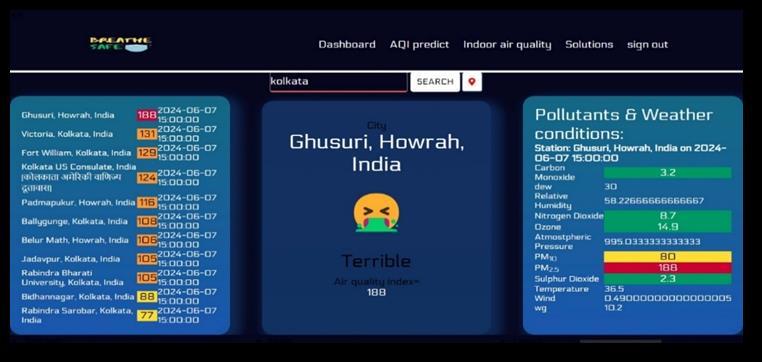
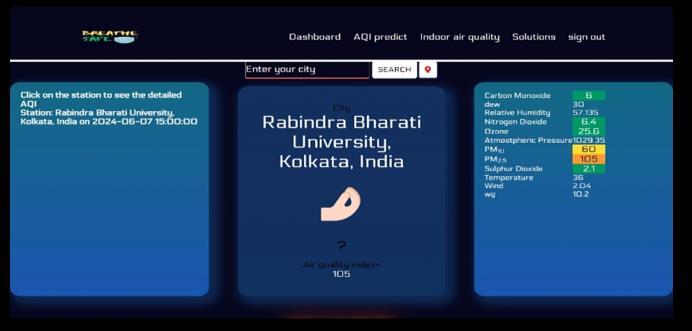
The website developed by our team offers a comprehensiveairqualitymonitoringandpredictionservice.
Users begin by registering their details in our MongoDB database.Onceregistered,userscanlogintoaccessthemain dashboard.Thedashboardfeaturesasearchbarthatutilizes APIwhichcallstoWaqi.info,allowinguserstosearchforAQI andpollutantlevelsinspecificcitiesandnearbymonitoring stations.Additionally,userscanenableGPSlocationservices to detect their current location and display the AQI at the nearestmonitoringstation.Theindoorairqualitycanalsobe monitoredusingoursystemwhichcandisplayindoorAQI readingsfromnearbyIoTsensorswhenGPSisenabled.This dataisalsoretrievedfromourMongoDBdatabase.
A significant feature of our website is AQI prediction. UserscansearchbycityanddatetoobtainAQIforecastfor thenextfivedays.Thispredictioncoversbothoutdoorand indoor air quality and is powered by advanced machinelearningmodelsdevelopedspecificallyforourproject.
The link to the website is: https://fnode7lcl.onrender.com/
International Research Journal of Engineering and Technology (IRJET) e-ISSN: 2395-0056
Volume: 11 Issue: 06 | Jun 2024 www.irjet.net p-ISSN: 2395-0072

29: Website showing precautionary measures to reduce AQI level
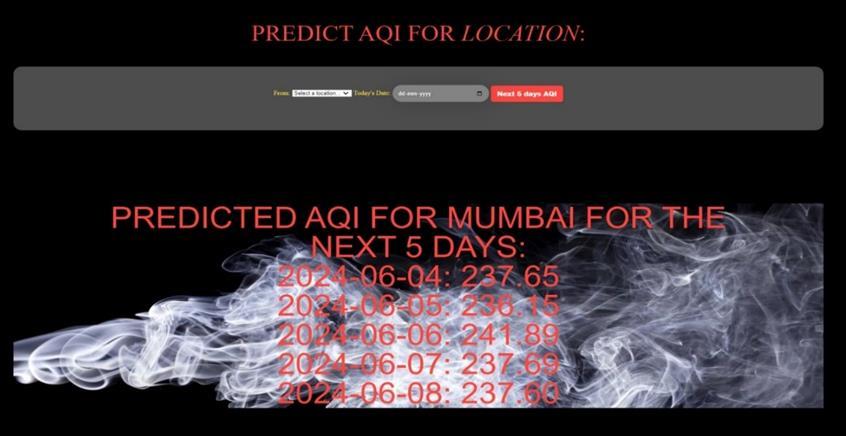
Figure 30: Website showing Predicted AQI values for the next 5 days from a date for a location (Mumbai)
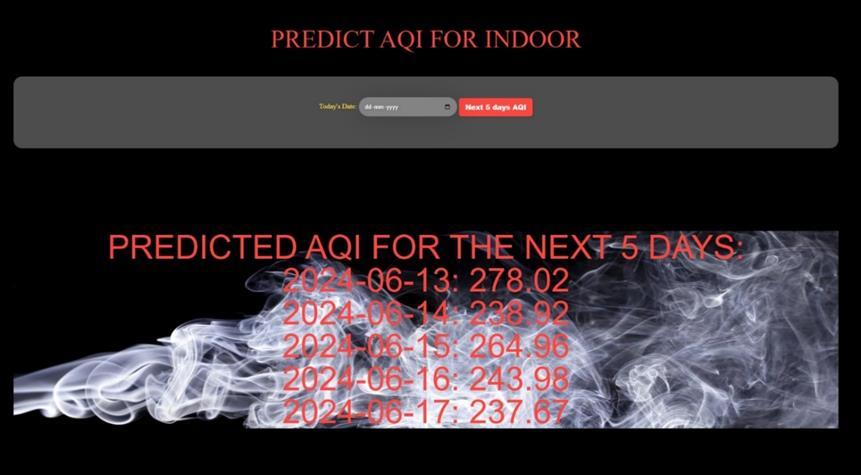
FIGURE 31: Website showing Predicted AQI values for the next 5 days from a date for the place where the device is placed
Thedatawhichwasusedinourresearchisstatic.However, ourproposedmodelaimstocollecthourlydata.Whenthe data collection is done in real-time, we can use the cloud which will give us a more accurate performance. The predictedAQIresultswillbefurthercategorizedbasedon healthstandardsandtheairqualitymeasuredindoorscan be categorized as hazardous or not. Depending on this prediction a website is built where using static data forecastingisdoneforthenextfivedays.Forbetterusageof this facility app development can be used which will be easierforuserstogetnotificationsandalerts.Precautions will be advised depending on the AQI values for example installationofHEPAfilters,encouragingusageofN95masks andplantingmoreindoorplants.
In this study, the performance metrics RMSE and MAPE evaluatedforvariouscitiesshowedthatthemodelPROPHET gavethelowestRMSEandMAPEandthuswasobservedto be the best fit for forecasting AQI. This model can also be appliedtotheindoorhardwaredevicesetupandthuswill helpustoachieveaccurateforecastingresults.IftheAQIis predictedcorrectlypollutioncanbecontrolled.
With the help of the prediction and usage of GPS the contaminatedareacanbedeterminedandalsothecauseof pollution can be identified. Several pollutants pose a hazardousthreattohumanhealthandthusaddressingthis issueisanurgentmatter.
[1]T.Dutta,A.Dutta,andR.Roy,"TimeseriesanalysisofAir Quality Index for several Indian cities," Department of ComputerScience,VidyasagarCollege,UniversityofCalcutta, Project Report, 2021. [Online]. Available: https://www.academia.edu/104580770/Time_series_analys is_of_Air_Quality_Index_for_several_Indian_cities.
International Research Journal of Engineering and Technology (IRJET) e-ISSN: 2395-0056
Volume: 11 Issue: 06 | Jun 2024 www.irjet.net p-ISSN: 2395-0072
[2] T. C. Bui, V. D. Le, and S. K. Cha, "A deep learning approachforforecastingairpollutioninSouthKoreausing LSTM,"arXivpreprintarXiv:1804.07891,2018.
[3]D.Dessai,S.Dessai,andS.D.C.S.eAraujo,"TimeSeries Analysis for Air Quality Forecasting," Journal of Emerging TechnologiesandInnovativeResearch(JETIR),vol.7,no.7, pp. 272-277, 2020. [Online]. Available: http://www.jetir.org/papers/JETIR2007331.pdf
[4] N. K. R, S. Bhumika, S. R, and V. R, "Air Quality Index Prediction using LSTM," International Research Journal of Engineering and Technology (IRJET), vol. 7, no. 6, 2020. [Online].Available:http://www.irjet.net.
[5]S.KumarandA.Jasuja,"Airqualitymonitoringsystem based on IoT using Raspberry Pi," in 2017 International ConferenceonComputing,communicationandAutomation (ICCCA),2017,pp.1341-1346.
[6]J.Jo,B.Jo,J.Kim,S.Kim,andW.Han,"Developmentofan IoT-basedindoorairqualitymonitoringplatform,"Journalof Sensors,vol.2020,pp.1-14,2020.
[7] A. Barthwal and D. Acharya, "An IoT-based sensing system for modelling and forecasting urban air quality," WirelessPersonalCommunications,vol.116,no.4,pp.35033526,2021.
[8] R. S. AbdulWahhab, "Air quality system using IoT for indoor environmental monitoring," in Proceedings of the 2019 5th International Conference on Computer and TechnologyApplications,2019,pp.184-188.
[9]K.RajakumariandV.Priyanka,"Airpollutionprediction in smart cities by using machine learning techniques," IJITEE,vol.9,no.5,pp.1272-1279,2020.
[10] N. Sahu and A. Sarkar, "Time Series Analysis of Air Quality of an Industrial District of India Using Remote SensingandGIS:ImpactofCovid-19Lockdown,"2024.
[11]N.S.Guptaetal.,"Predictionofairqualityindexusing machine learning techniques: a comparative analysis," JournalofEnvironmentalandPublicHealth,vol.2023,pp.126,2023.
[12] M. Imam, S. Adam, S. Dev, and N. Nesa, "Air Quality MonitoringUsingStatisticalLearningModelsforSustainable Environment," Intelligent Systems with Applications, vol. 200333,2024.
[13] K. B. Priya Iyer and V. Dharshini, "ANALYSIS AND PREDICTIONOFAIRQUALITYINDEXININDIADURINGPRE ANDPOSTCOVIDPANDEMICUSINGMACHINELEARNING ALGORITHMS,"PalArch’sJournalofArchaeologyofEgypt/ Egyptology, vol. 17, no. 7, pp. 6995-7003, 2020. [Online]. Available:
2024, IRJET | Impact Factor value: 8.226 |
https://archives.palarch.nl/index.php/jae/article/view/309 7.
[14] R. M. Patil, H. T. Dinde, S. K. Powar, and P. M. Ganeshkhind, "A literature review on prediction of air qualityindexandforecastingambient airpollutantsusing machinelearningalgorithms,"IntJInnov SciResTechnol, vol.5,no.8,pp.1148-1152,2020.
[15]H.PatelandS.Saket,"Airpollutionpredictionsystem for the smart city using data mining technique: a survey," Health,vol.6,no.12,2019.
[16] R. Sharma, G. Shilimkar, and S. Pisal, "Air quality predictionbymachinelearning,"Int.J.Sci.Res.Sci.Technol, vol.8,pp.486-492,2021.
[17] A. Choudhary et al., "Time Series Simulation and ForecastingofAirQualityUsingIn-situandSatellite-Based ObservationsOveranUrbanRegion,"NatureEnvironment& PollutionTechnology,vol.21,no.3,2022.[Online].Available: https://doi.org/10.46488/NEPT.2022.v21i03.018
[18] V. Chaudhary, A. Deshbhratar, V. Kumar, and D. Paul, "Time series-based LSTM model to predict air pollutant’s concentrationforprominentcitiesinIndia,"UDM,Aug.2018. [Online].Available:https://philippe-fournier-viger.com.
[19] V. Deva Sekhar and P. Natarajan, "Prediction of air qualityandpollutionusingstatisticalmethodsandmachine learning techniques," International Journal of Advanced Computer Science and Applications, vol. 14, no. 4, 2023. [Online].Available:https://proquest.com
[20] J. Kalajdjieski, M. Korunoski, B. R. Stojkoska, and K. Trivodaliev, "Smart city air pollution monitoring and prediction:AcasestudyofSkopje,"inICTInnovations2020. Machine Learning and Applications: 12th International Conference,ICTInnovations2020,Skopje,NorthMacedonia, September 24–26, 2020, Proceedings 12. Springer International Publishing, 2020, pp. 15-27. [Online]. Available:https://researchgate.net