
International Research Journal of Engineering and Technology (IRJET) e-ISSN: 2395-0056
Volume: 11 Issue: 05 | May 2024 www.irjet.net p-ISSN: 2395-0072
International Research Journal of Engineering and Technology (IRJET) e-ISSN: 2395-0056
Volume: 11 Issue: 05 | May 2024 www.irjet.net p-ISSN: 2395-0072
Geeta1 , Mukesh Kumar2 , Kakali Deka3
1First Asst. Prof., Department of Mechanical Engineering PKG Group of Institutions.
2Second M.Tech Student, Department of Mechanical Engineering PKG Group of Institutions.
3Third: M.tech, Design Engineer, Noida Up
Abstract - The present work deals with comparative study on cutting performance of (BUSH P-780308A) made up of C-20 plain carbon steel using HSS, TiN Coated HSS cutting tool. The experimented optimal setting ensured minimization of surface roughness, and maximization of MRR (Material Removal Rate) Regression equations, used to get the relation between different response variables (MRR and surface finish) and the input parameters (speed, feed, and depth of cut) were found out using software for statistical analysis In addition to it, the significance of the model is also analyzed graphically with the diagnostic graphs like Actual v/s Predicted result. Further the individual and combined effects of factors at various levels on the chosen response are discussed with the help of Interaction plots, Perturbation plots and ANOVA technique.
Key Words: Cutting parameters, Surface roughness, Optimize machining time and Material removal rate.
Quality and productivity play significant role in today’s competitivemanufacturingmarket.Forconsumerviewpoint qualityisveryimportant.Therefore,everymanufacturingor production unitalwaysconcerned about the quality ofthe product. Every manufacturing industry aims at producing manyproductswithinrelativelylessertime.Butitisfeltthat reduction in manufacturingtime may causesevere quality loss.Toembracethesetwoconflictingcriteria,itisnecessary tobalancethequalitylevel&productivityleveloftheitem. Wherevermetalisuseditssurethatitmusthavereachedits finalstagethroughprocessingwithmachinetools.Intermsof annualexpenditure,machiningisthemostimportantofthe manufacturingprocesses.
2. MATERIALS AND METHOD
2.1. Work Piece Material
TheworkpiecematerialusedforpresentworkwasC20plain Carbo steel. Table 1 and Table 2 show the chemical compositionandmechanicalpropertiesofC20plainCarbo steel.
Table -1: ChemicalCompositionC20Plaincarbonsteel
Mechanical Properties of C20 Plain carbon steel
Property Value
Carbon(C) 0.15-0.25
Manganese(Mn) 0.60-0.90
Silicon(Si) 0.15-0.35
Phosphorus(P) 0.0-0.06
Table -2: MechanicalPropertiesofC20Plaincarbonsteel
Mechanical Properties of C20 Plain carbon steel
Property Value
TensileStrength 425MPa
Density 7.8g/cm3
Elongation
Machinability
Thecuttingtoolusedforexperimentationwiththestandard specificationisTiNCoatedHSS
Table -3: CuttingToolDetail.
Single Point Cutting Tool
Material HSS,TiNCoatedHSS
Type Rhombus80°,12mmside,4mmthickness
No.ofedge 4
Coated HSS tools have shown better performance when comparedtotheuncoatedcarbidetools.
Modelingandanalysisweredoneby3kfactorialdesignisthe mostwidelyusedfactorialdesignhavingthreelevelsforeach of‘k’factors.Thethreelevelsoffactorsarereferredtoaslow
International Research Journal of Engineering and Technology (IRJET) e-ISSN: 2395-0056
Volume: 11 Issue: 05 | May 2024 www.irjet.net p-ISSN: 2395-0072
(0),intermediate(1)andhigh(2). All threelevelsofthese parametershadbeendecidedbasedonmachinetooldesign handbookandfullfactorialapproachhasbeenemployedfor experimentation.
Cuttingexperimentsareconductedconsidering.threecutting parameters: Cutting Speed (m/min), Feed rate (mm/rev), DepthofCut(mm)andoverall,27experimentswerecarried out. All three levels of theseparametershad been decided based on machine tool design handbook and full factorial approachhasbeenemployedforexperimentation.Table4 shows the values of various parameters used for experiments:
TABLE 4: Levels of control factors Level
TABLE 6: Fullfactorialdesignwithprocessparameters
2.4.
2.4.1 Preparation of work piece
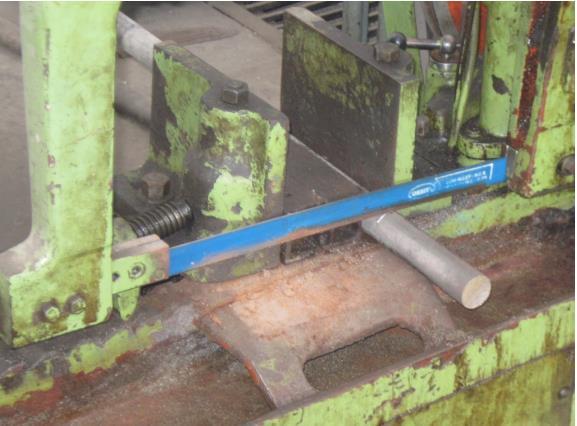
To perform the experiments, work pieces from the 25mm diameter cylindrical bars of C-20 material were cut up to required length of 100mm with the help of power saw as showninthefig:1.
FIGURE: 1 Cuttingofworkpiecewithpowersaw
2.4.2
Further, the diameter of rough turned work pieces were measured and approximately 30 pieces having in range of outer diameter 25 mm were collected for conducting the experiments.Thefinishedturningoperationwascarriedout on these rough turned work pieces using the different combinationofcuttingparametersdesignedbytheDesignof ExperimentonExperimentalCNCturningcenter
2.4.3 Determination of Material Removal Rate & Surface Finish
Thematerialremovalrate(MRR)inturningoperationsisthe volumeofmaterial/metal thatisremovedperunittimein mm3 /min. For each revolution of the work piece, a ringshapedlayerofmaterialisremoved.
MRR = (π.Davg.dfN) in mm3/ min
where N=cuttingspeedinRPM, f =feedinmm/rev,
International Research Journal of Engineering and Technology (IRJET) e-ISSN: 2395-0056
Volume: 11 Issue: 05 | May 2024 www.irjet.net p-ISSN: 2395-0072
d =Depthofcutinmm,& Davg =(Do+Df)/2
2.4.4
ThesurfaceroughnesswasmeasuredbyusingMitutoyoSJ301SurfaceRoughnessTester.ThesurfaceroughnessRacanbemeasuredininchesaswellasinµm,withdiamond pointstylusroughnesstesteratthreedifferentplaces The measuredRavaluesinµmwererecordedinthetable7.The values of material removal rate and surface roughness obtained from the experiments conducted using different combinationofcuttingconditionswereusedforfindingthe optimumcombinationofcuttingconditions.
TABLE 7: InputAndOutputCuttingParameter.
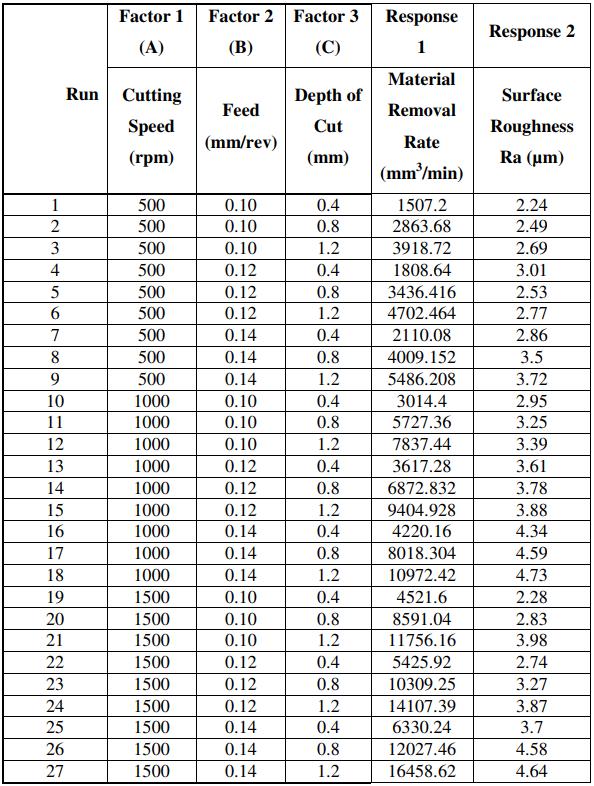
A 3*3 full factorial design was used to get the output data uniformly distributed all over the ranges of the input parameters. In this way 27 experiments were carried out with different combinations of the levels of the input parameters. Regression equations, to get the relation between different response variables (metal removal rate and surface finish) and the input parameters (speed, feed, anddepthofcut)werefoundoutusingsoftwareforstatistical analysis. Thesoftware required the cuttingconditions and responses from the experiments, and developed the statisticaldesignsummary,signaltonoiseratio,Analysisof variance, to verify the significance of the model obtained
through Regression Equations for material removal rate (MRR) and surface roughness (Ra). In addition to the significanceofthemodelisalsoanalyzedgraphicallywiththe diagnostic graphs like Actual v/s Predicted and Box-Cox transformation plot. Further the individual and combined effectsoffactorsatvariouslevelsonthechosenresponseare discussed with the help of Interaction plots, Perturbation plots and 3-D graphs of Response Surface methodology (RSM).
Afterenteringalltheprocessparametersandresponsesin thedesignedinputtablegivenbythesoftware,theTransform levelwascheckedbysoftware.ByselectingMRRasresponse for analysis, the suggested Transform determined by the software.
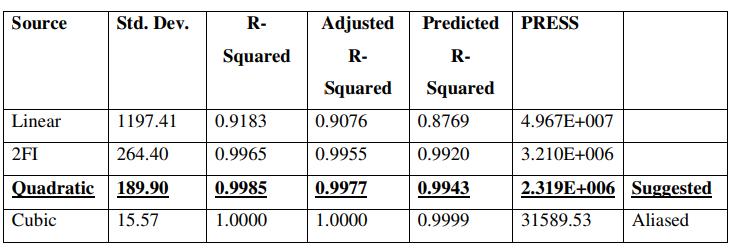
Thesummarytable8indicatesthatsequentialsourceofthe modelislinear,2FactorialInteractionandQuadraticbutthe softwaresuggeststhatthedesirabilityofmodelisQuadratic. TheDetailedSummarytableisshownbelow.
(a) The Sequential Model Sum of Squares
TABLE 8: Sequentialmodelsumofsquares[typeI]
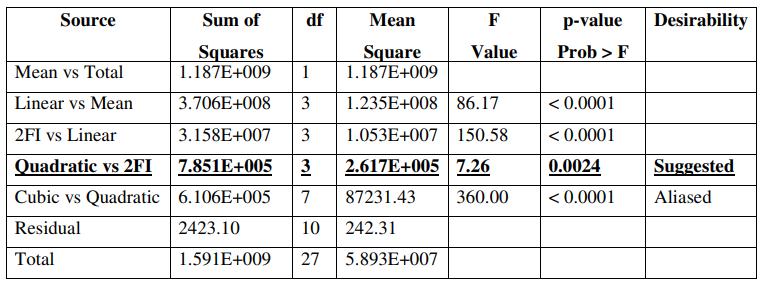
From Sequential Model Sum of Squares, it is depicted that highestorderpolynomialisselectedwhereadditionalterms aresignificant,andthemodelisnotaliased.Thistableagain indicates that the model is suggested to analyze with QuadraticprocessorderbecauseoflowestvalueofF=7.26 withp-value0.0024isindicatedinfrontofQuadraticvs2FI asasourceofprocessshowninTable8.
(b) Model Summary Statistics: Thissummaryfocusonthe model maximizing the “Adjusted R-Squared” and the “PredictedR-Squared”valuesanditistabulatedinthe
Table 9. Modelsummarystatistics
International Research Journal of Engineering and Technology (IRJET) e-ISSN: 2395-0056
Volume: 11 Issue: 05 | May 2024 www.irjet.net p-ISSN: 2395-0072
This wasagain suggested toproceed furtheranalysis with Quadratic,asa processorder AfterselectingtheQuadratic sourceasatypeofmodel,theanalysisofvariance(ANOVA) wascalculatedalongwiththestatistictermssuchasdegree offreedom(DF),sumofsquares(SS),meansquare(MS),F valueandPvaluesforMRRasaresponse.
Thefundamentaltechniqueisapartitioningofthetotalsum ofsquaresSSintocomponentsrelatedtotheeffectsusedin themodel.Forexample,themodel forasimplifiedANOVA withonetypeoftreatmentatdifferentlevelsis
SSTotal=SSError +SSTreatments
ThenumberofdegreesoffreedomDFcanbepartitionedina similarway.Oneofthesecomponents(thatforerror)specify a chi-squared distribution which describes the associated sum of squares, while the same is true for “treatments” if thereisnotreatmenteffect.
DFTotal =DFError +DFTreatments
TheF-testisusedforcomparisonofthecomponentsofthe total deviation. For example, in one-way or single-factor ANOVA,statisticalsignificanceistestedforbycomparingthe F-teststatistic

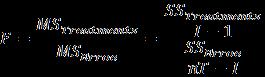
WhereMSismeansquare,I=numberoftreatmentsandnT= total number of cases to the F-distribution with I-1, nT-I degree of freedom ANOVA for Response Surface for QuadraticModelisgiveninTable10.
Table 9. Analysisofvariance[partialsumofsquares–typeiii]
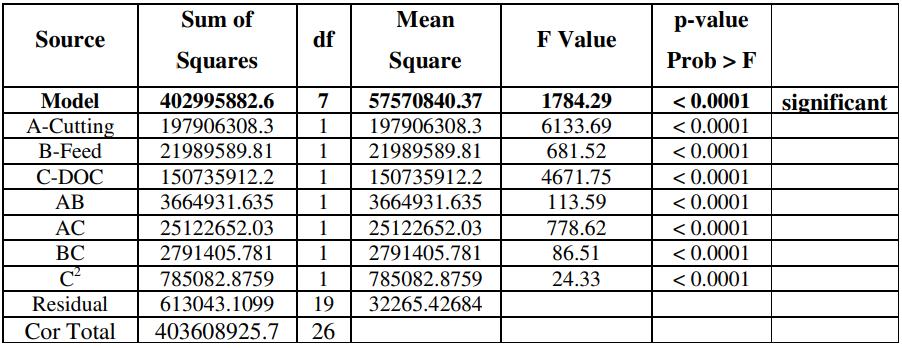
TheModelF-valueof1784.29impliesthemodelissignificant. There is only a 0.01% chance that a "Model F-Value" this largecouldoccurduetonoise.Valuesof"Prob>F"lessthan 0.0500indicatemodeltermsaresignificant.InthiscaseA,B,
C,AB,AC,BC,C2aresignificantmodelterms.Valuesgreater than0.1000indicatethemodeltermsarenotsignificant.
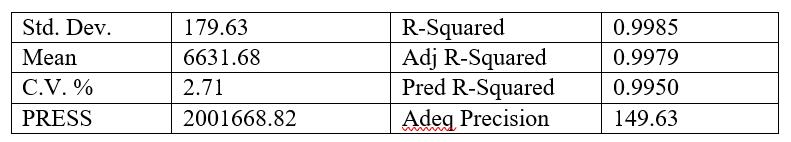
The"PredR-Squared"of0.9950isinreasonableagreement withthe"AdjR-Squared"of0.9979.
Moreover,theregressionanalysishasalsobeenprovidedby DesignExpertbygivingtheRegressionEquationforMRRin codedandactualvalues.Theequationinbothformsaregiven below.
(i) Final Equation in Terms of Coded Factors:
MRR = +6872.83+3315.84*A+1105.28* B+2893.82* C+552.64*A*B+1446.91*A*C
+482.30*B*C-361.73*C2
(ii) Final Equation in Terms of Actual Factors:
MRR = +4581.89-5.79 * CS-48230.40 * Feed3617.28*DOC+55.26*CS*Feed+7.24*CS*DOC
+60288.00*Feed*DOC-2260.80*DOC2
ThisregressionequationforMRRgivesthepredictedvalues withintherangeofinputprocessparameters.Theactualand predictedvalues of MRR arefurthercompared graphically (Figure2)areplacedonX-axisandY-axisrespectively.
FIGURE: 2 ActualandpredictedvaluesofMRR
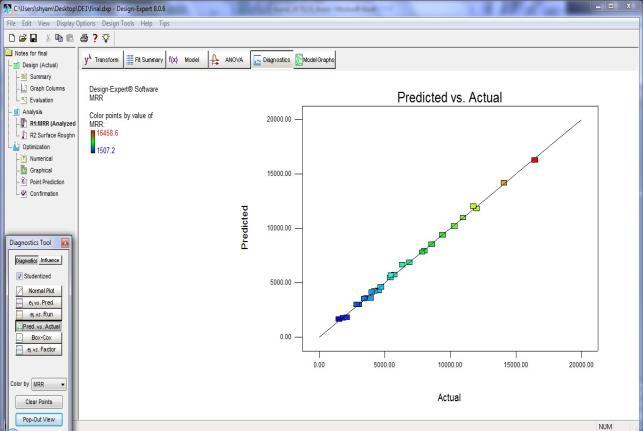
Graph, showing the relationship between MRR and input parameters for both the prediction methods and for the experimental values show that the trend shown by these graphs for both the prediction techniques and the experimentalvaluesisincreasing. Thesegraphscanhelpin indirectmeasurementoftheMRR.Lower,middleandhigher
International Research Journal of Engineering and Technology (IRJET) e-ISSN: 2395-0056
Volume: 11 Issue: 05 | May 2024 www.irjet.net p-ISSN: 2395-0072
values are displayed with blue, green and red color respectively.
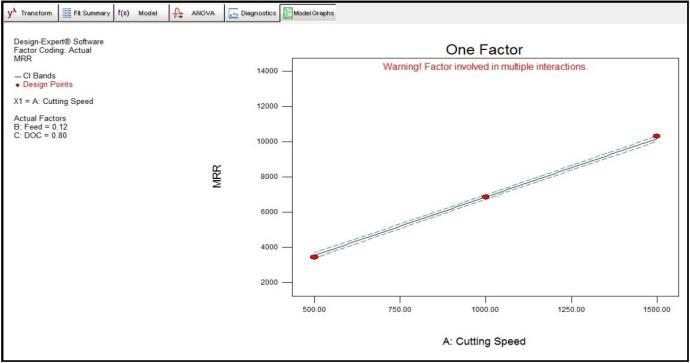
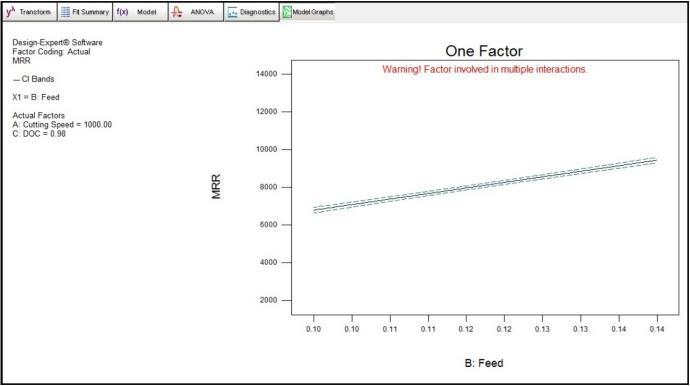
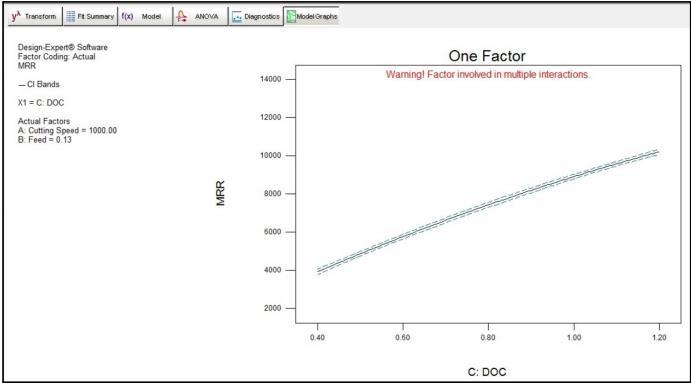
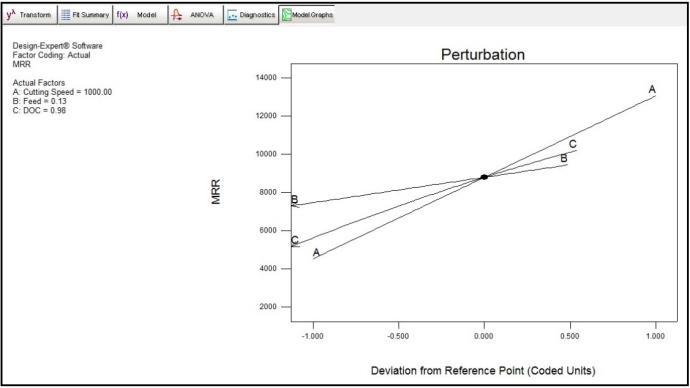
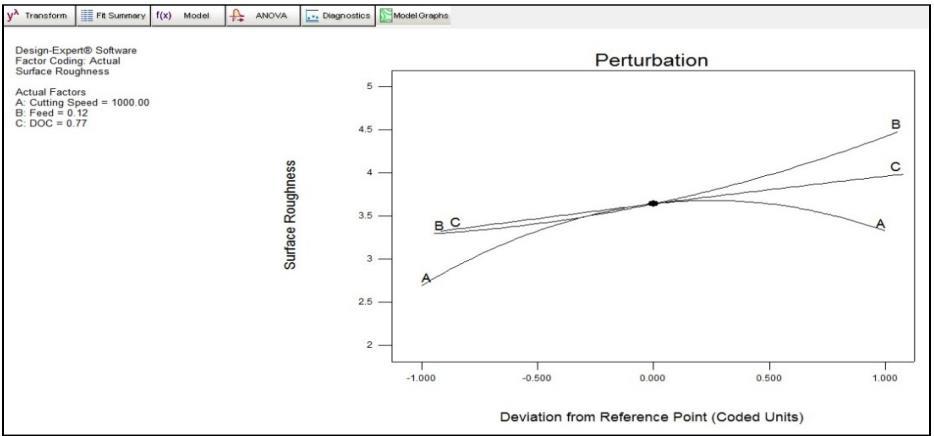
Amaineffecttestwillmerelylookatwhetheroverallthereis something about a particular factor that is making a difference.Maineffectsareessentiallytheoveralleffectofa factor AllThemaineffectplotsshowsthatthereisincrease invalueofMRRwithincreaseinvalueofcuttingspeed,feed and depth of cut individually. The interaction effects of CuttingSpeedandFeed,FeedandDepthofcutandCutting Speed and Depth of cut on surface roughness value were analyzed.
6: Perturbationgraphofcuttingparametersverses MRR
2.5.1.4
The combined effect of feed and cutting speed has been plottedforresponseMRR bythesoftwareasshowninthe Figure7.ThegraphindicatestheincreasingtrendofMRRby increasing cutting speed A: cutting speed (CS) on X1 axis ranges from 500 rpm to 1500 rpm along with increasing value of B: feed rate (FR) on X2 axis ranges from 0.10 mm/revto0.14mm/rev.
7: Interactiongraphofcuttingspeed,feedvsMRR
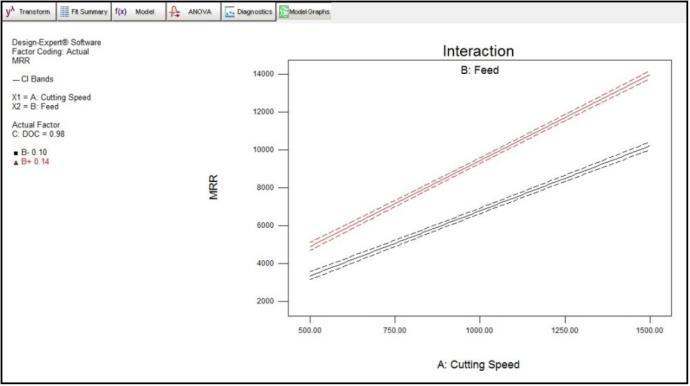
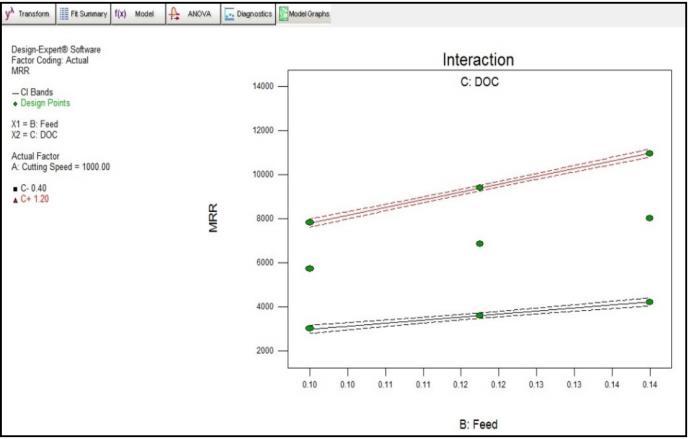
Figure 8: The interaction graph of feed and depth of cut
International Research Journal of Engineering and Technology (IRJET) e-ISSN: 2395-0056
Volume: 11 Issue: 05 | May 2024 www.irjet.net p-ISSN: 2395-0072
Theinteractiongraph(figure8)hasbeenplottedbetween2 input parameters DOC (X2) and Feed (X1) and MRR. This graph shows significant increase in values of MRR as DOC changesfromitsminimumlevel0.4mmtomaximumlevelof 1.2mm,asCS1000rpm,whereasfeedratehaslesseffecton MRR.
Above same process followed for Surface roughness optimization.TheInputandOutputprocessparametersand responsesaretakenfromtable7.
2.5.2.1:
Instatistics,analysisofvariance(ANOVA)isacollectionof statisticalmodels,andtheirassociatedprocedures,inwhich theobservedvarianceinaparticularvariableispartitioned into components attributable to different sources of variation.Initssimplestform,ANOVAprovidesastatistical test of whether or not the means of several groups are all equal, and therefore generalizes t-test to more than two groups.Doingmultipletwosamplet-testswouldresultinan increasedchanceofcommutingatypeIerror.Forthisreason, ANOVAareusefulincomparingtwo,threeormoremeans.In thiscasethe,ANOVAwascalculatedandtherelatedterms weretabulatedinthe
Table 9: ANOVA[partialsumofsquares–typeiii]
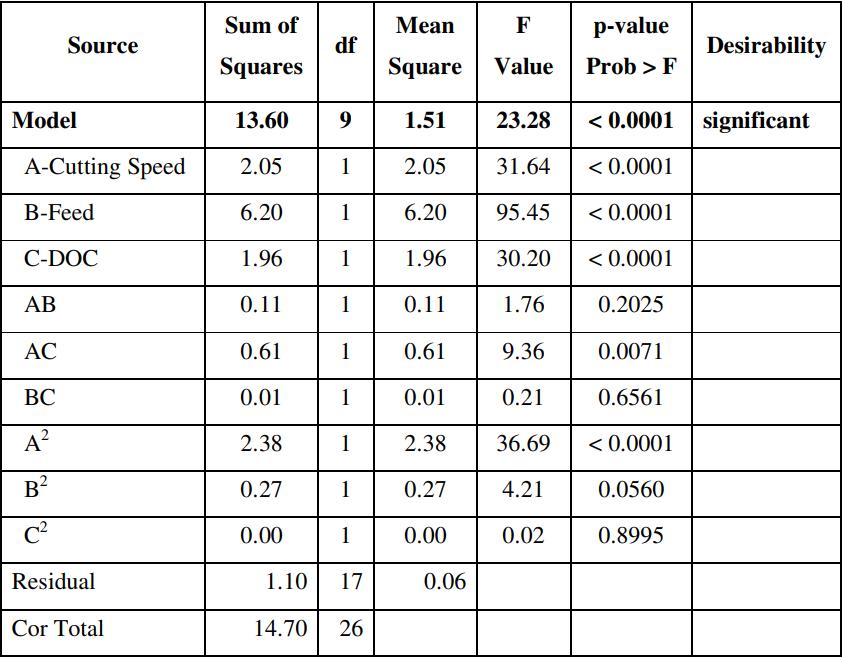
Table 10: Standarddeviationandadjustedvalues
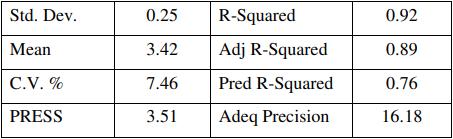
The“PredR-Squared”of0.76isinreasonableagreementwith the“AdjR-Squared”of0.89
2.5.2.2 Regression Analysis Equation for Ra value
The results obtained by this method were formed as RegressionAnalysisEquationforRavalueequationbythe samesoftwaresimilarwithabovedoneforMRRfindings.
Figure 9: ActualVsPredicatedvalueofRa
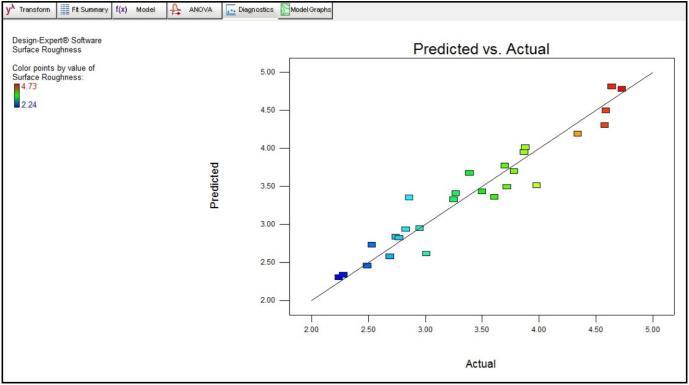
Thegraphbetweenactualandpredictedvaluesisshownin Figure9.Theplotshowsscatteredpointsalittlebitdeviated fromfittedline.ThelowrangevaluesofSurfaceroughness areshowninbluecolorpointsandhighrangevaluesinred color.ItindicatesthatlowestvalueofRai.e.2.24(blue)and thevalue4.73(red)aremostdeviatedexperimentalvalues.
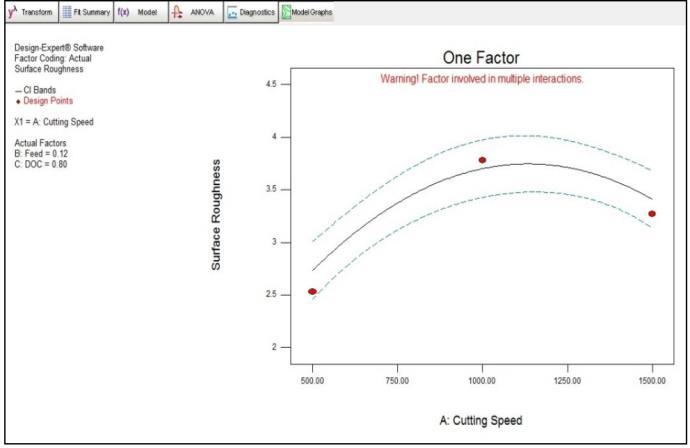
Figure 10: CuttingspeedvsRa
International Research Journal of Engineering and Technology (IRJET) e-ISSN: 2395-0056
Volume: 11 Issue: 05 | May 2024 www.irjet.net p-ISSN: 2395-0072
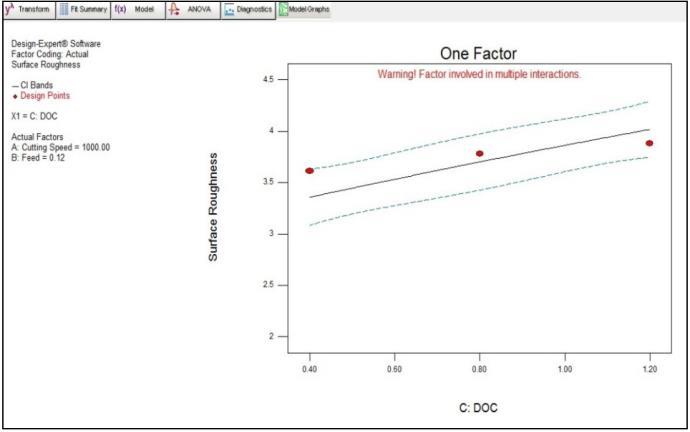
11: DOC vs Ra
12: perturbationgraphofcuttingparametersvsRa
2.5.2.3 Interaction Plots
Figure 13: Theinteractiongraphofcuttingspeed,feedvs Ra
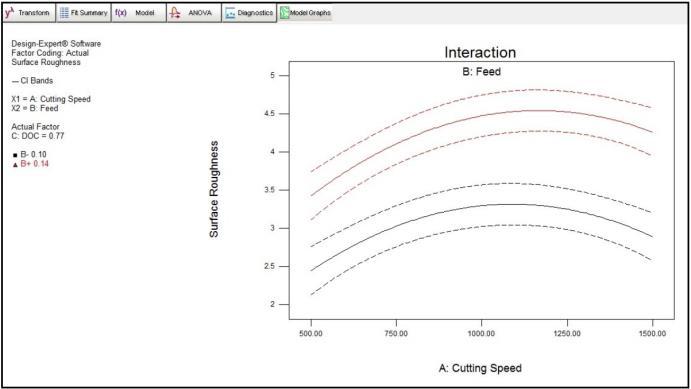
Figure 14:Theinteractiongraphofcuttingspeedanddepth ofcutversesRa
2.5.3 Optimized Result
After making discussions and analysis the optimization process was carried out with assigning the values of constraintsintheprescribedspaceprovidedbythesoftware.
After analyzing the result, the number of solutions were obtainedbythesoftware,alongwiththe selectedoptimum cuttingparametersareasshowninfig14
Figure 12: Graphofconstraintsforoptimization
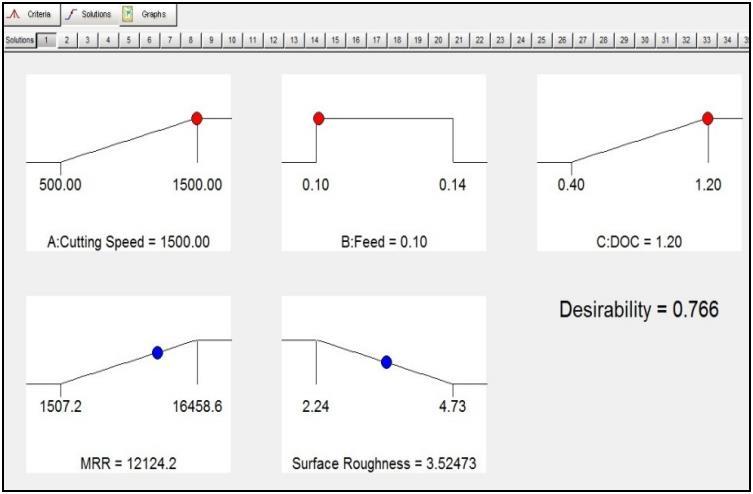
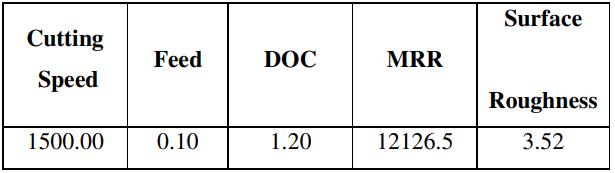
the solution number one with highest desirabilityvalue of 0.766wasselectedasthesetofoptimumcuttingparameters. Therefore,thesuggestedOptimumCuttingParametersgiven inTable11
Table 10: Suggestedoptimumcuttingparameters.
[1] Lin W. S., Lee B. Y., Wu C. L., (2001), “Modeling the surfaceroughnessandcuttingforceforturning”, Journal of Materials Processing Technology, Volume 108, pp. 286-293
[2] FengC.X.(Jack)andWangX.,(2002),“Developmentof Empirical ModelsforSurfaceRoughnessPredictionin Finish Turning”, International Journal of Advanced Manufacturing Technology,Volume20,pp.348–356.
[3] SureshP.V.S.,RaoP.V.andDeshmukhS.G.,(2002),“A geneticalgorithmicapproachforoptimizationofsurface roughness prediction model”, International Journal of Machine Tools and Manufacture, Volume 42, pp. 675–680.
[4] Lee S. S. and Chen J. C., (2003), “Online surface roughness recognition system using artificial neural networkssystem in turning operations” International Journal of Advanced Manufacturing Technology,Volume 22,pp.498–509.
© 2024, IRJET | Impact Factor value: 8.226 | ISO 9001:2008 Certified Journal | Page644