
Prediction of Recycled Coarse Aggregate Concrete Strength Using Machine Learning Techniques
Kashish Singh1, Himanshu Khokhar1, Harshita Singh1, Faraz Khan1, Dr. Kunal Bisht1, Ms. Shikha Tyagi1, Mr. Praveen Kumar Yadav2
Department of civil engineering, KIET Group of institution, ghaziabad1
Department of civil engineering, ITS Engineering college, greater noida2
Affiliated to Dr. A.P.J. Abdul kalam technical university, Lucknow
1. Abstract
This research presents a machine learning methodology for accurately forecasting the compressive strength of recycled concrete aggregate (RCA) material. Data from curated datasheet on RCA concrete samples, including mix proportions, curing conditions,andcompressivestrengthtestresults,were usedtotrainandtestvariousmachinelearningmodels. The random forest model outperformed others, achieving an R-squared value of 0.798. This machine learning technique offers a reliable way of predicting RCA concrete's compressive strength, enabling engineers to optimize mix designs and improve the quality and longevity of recycled concrete constructions, promoting sustainable construction practices.
2. Introduction
2.1 Machine Learning Introduction
Machinelearning is a part of artificial intelligence that signifies a fundamental change in the way computers mayindependentlyacquireknowledgeandadjusttheir behavior based on input. Machine learning algorithms differ from traditional programming in that they acquire knowledge from data rather than relying on explicit instructions. This allows them to analyze patterns and correlations and make predictions, classifications, and judgments autonomously, without the need for human interaction. However, the nonlinear behavior of concrete regression models createdusingthisapproachmaynotadequatelyreflect its underlying nature. The fundamental principle of machine learning is statistical learning, in which computers utilize mathematical models to identify patterns and derive insights from datasets of different sizesandlevelsofcomplexity.Machinelearningiswellsuited for jobs that include complicated rules that cannot be directly coded, or for activities where patterns are concealed within large volumes of data. Machine learning is widely employed in nearly all industries and respects of contemporary life. Machine
learning algorithms power a diverse range of applications, including customized suggestions on streaming platforms and predictive maintenance in manufacturing. Machine learning is employed in banking to detect fraud and facilitate algorithmic trading. In healthcare, it assists in diagnosing diseases and developing individualized treatment strategies. Marketing efforts utilize machine learning to segment customers and deliver tailored advertisements, while autonomous cars depend on it for navigation and obstacledetection.
2.2 Application of Machine Learning in Different Fields
Machine learning is now essential in several fields because it can extract valuable information and patterns from data, resulting in improved decisionmakingandefficiency.Machinelearningalgorithmsare widelyusedinfinanceforriskassessment,algorithmic trading, and fraud detection. Through the analysis of past data, these algorithms can detect suspicious patternsthataresymptomaticofdeceivingconduct.As a result, they play a crucial role in protecting financial institutions and their clients. Furthermore, machine learning facilitates tailored financial suggestions grounded on human preferences and risk profiles, optimizing investment approaches and enhancing consumer contentment. Machine learning is essential in healthcare for illness detection, optimizing therapy, and analyzing medical imaging. Medical professionals utilizemachinelearningalgorithmstoanalyzeintricate medical pictures, identify abnormalities, and forecast theadvancementofdiseases.
2.3 Applications in the Civil Industry
Modern modeling tools in civil engineering include artificial intelligence and machine learning. Experimentation validates the output models of these approaches, which model responses using input parameters. Machine learning algorithms are used in construction to estimate concrete strength. [1-5], Machine learning is crucial in the civil sector for
International Research Journal of Engineering and Technology (IRJET) e-ISSN:2395-0056
Volume: 11 Issue: 05 | May 2024 www.irjet.net p-ISSN:2395-0072
enhancing infrastructure management and urban development. Researchers in civil engineering are interested in using machine learning and regression models to forecast structural performance, health monitoring,andmaterialattributes.[11-17]
Forexample,machinelearningalgorithmsmaybeused tocreatepredictivemaintenancemodelsthatallowfor proactivemaintenanceofbridges,highways,andother essential infrastructure. This helps to minimize downtime and ensure the safety of the public. Urban planners utilize machine learning methodologies to examine demographic data, transportation patterns, and environmental concerns to create more efficient and sustainable cities. Machine learning enables the timely monitoring and analysis of environmental data, assisting in the control of pollution levels, water resources, and natural catastrophes. In addition, constructionorganizationsemploymachinelearningto improve cost prediction, project scheduling, and quality control, therefore optimizing operations and improvingprojectresults.Integratingmachinelearning in the civil industry enhances both efficiency and effectiveness, while also promoting innovation and sustainability. To obtain the appropriate result, supervised machine learning techniques need a varied rangeofinputvariables.[6-8]
2.4 ANN
Artificial Neural Networks (ANNs) are computational models inspired by the structure and function of the humanbrain.Asaresult,itpossessesmanyqualitiesof biological brain systems, including adaptability and self-study, computational parallelism and storage distribution, nonlinear mapping, and fault tolerance.[21] ANN comprises an input layer, one or morehiddenlayers,andanoutputlayer.[24]ANNsare used in several fields, including machine learning and pattern recognition, to solve. The ICA-XGBoost model may provide more accurate results than other ANN approaches, such as ICA-ANN, ICA- SVR, and ICAANFIS.Han et al suggested an ensemble ML model.(Hanetal.,2020) Artificial Neural Networks (ANNs) are essential in the field of machine learning, drawing inspiration from the intricate functions of the human brain. These networks consist of linked nodes, or neurons, arranged in layers: an input layer, one or more hidden layers, and an output layer. Artificial neuralnetworks(ANNs)mayacquireintricatepatterns and correlations in data by employing forward propagation. During training, the connections between neuronsareadjustedtoreduceerror.Theversatilityof ANNs allows them to perform very well in a variety of tasks, including picture and speech recognition, time seriesforecasting,andsentimentanalysis.Duetotheir capacity to autonomously extract characteristics from
unprocessed input, they excel at managing unorganized data formats such as pictures, audio, and text.
2.4.1 Research done on ANN
Research on Artificial Neural Networks (ANNs) has been extensive in recent years, to advance their performance, scalability, and interpretability. Various innovativedesignshavebeensuggested,encompassing convolutional neural networks (CNNs) for handling images and recurrent neural networks (RNNs) for analyzing sequential data. These architectures are designed specifically for certain tasks, utilizing the hierarchical structure of deep learning models to extract complex characteristics from raw data. Moreover, the development of training techniques, suchasbatchnormalizationandadaptivelearningrate approaches,hasresultedinmorereliableandeffective trainingprocedures,facilitatingtheformationofneural networks that are deeper and more intricate. Regularisation techniques, such as dropout and L1/L2 regularisation, have been thoroughly researched to mitigate overfitting and enhance the overall performanceofgeneralisation. These combined efforts help to improve the precision and effectiveness of artificialneuralnetworks(ANNs)inseveralfields.
Inaddition,researcheffortsfocusonunderstandingthe opaquenatureofdeeplearningmodels,toclarifytheir decision-makingprocessesandthewaytheyrepresent features. Methods such as activation maximization, layer-wise relevance propagation, and saliency maps have been created to represent and understand the acquired characteristics in neural networks visually. Researchersmayacquireinsightsintothefundamental mechanics of deep learning by identifying the characteristics that have the most impact on model predictions and how they are converted between layers. This information helps in model debugging, validation,andrefining.
2.4.2 Industry Applications ofANN
ANNs are based on the biological neural networks found in animal brains, enabling the development of advanced algorithms capable of learning from large datasets.Theresearchinthisdomainhasbeenextensive andmulti-faceted,focusingonboththedevelopmentof new neural network architectures and the improvementofexistingones.
One area of significant advancement is deep learning, where deep neural networks, which are Artificial neural networks (ANNs) with multiple hidden layers havebeenutilizedtoachievecutting-edgeperformance in tasks suchas image and speech recognition, natural
International Research Journal of Engineering and Technology (IRJET) e-ISSN:2395-0056
Volume: 11 Issue: 05 | May 2024 www.irjet.net p-ISSN:2395-0072
languageprocessing,andautonomousdriving.
Researchershavealsoexploredregularizationmethods to prevent overfitting, ensuring that ANNs generalize well to new, unseen data. The experimental database was randomly divided into three subgroups based on earlier study categorization: training, validation, and testing.[22] make decisions by interacting with their environment. As computational power increases and datasets grow, ANNs remain at the forefront of AI research, continuing to push the boundaries of what machines can learn and achieve artificial neural networks (ANNs) have been widely utilized across various fields in machine learning to solve complex problems.
Hereareafewexamplesoftheiruse:
Image Recognition and Computer Vision: ConvolutionalNeuralNetworks(CNNs),aclassof deep neural networks, have been particularly successful in image recognition tasks. A prominent example is the AlexNetarchitecture,whichsignificantlyoutperformed traditional algorithms in the ImageNet Large Scale VisualRecognitionChallenge(ILSVRC)in2012.
Natural Language Processing (NLP): ANNs have transformed NLP with models like Long Short-Term Memory (LSTM) networks, which are capable of understandingthecontextanddependenciesintext.
Speech Recognition: Deep Neural Networks (DNNs) have improved the accuracy of speech recognition systems.
Reinforcement Learning: ANNs have also been pivotal in the field of reinforcement learning, particularly with the development of deep reinforcement learning strategies that combine deep neural networks with reinforcement learning principles.
Medical Diagnosis: ANNs have been applied in the medical field,particularlyfordiagnostic purposes.One exampleisthe useofneural networksinthediagnosis ofdiabeticretinopathy,whichisaconditiondiagnosed byanalyzingimagesoftheretina.
2.5 Random Forest
Ho invented and introduced this method in 1995, presenting an algorithm for random decision forests.[19] The Random Forest method is highly adaptable and resilient, making it well-known for its effectiveness in both classification and regression applications. Using the random split choice approach, Random Forest is deployed by bagging decision
trees.[9] Each tree in a RandomForestistrainedona randomsubsetofthedataandfeatures.Thistechnique reduces the risk of overfitting and captures complex nonlinear interactions in the data by utilizing bootstrappingandfeaturerandomization.Theinherent robustness and endurance of Random Forest to noisy data contribute to its popularity in several sectors, includingfinance,healthcare,andecology.Therandom forest model was utilized by Shaqadan to predict the splitting-tensile strength of concrete.[23] Moreover, research efforts focused on Random Forest have explored ways to improve its flexibility and comprehensibility[10]Additionally,thereisafocuson creating ensemble approaches that merge Random Forestwithotheralgorithms,suchasgradientboosting and stacking, to enhance forecast accuracy even further. The bagging method is an ensemble training method with two steps:(a) Bootstrap: the original dataset is randomly resampled to generate identically distributedandseparatedatasets;(b)Aggregation:the generated datasets are used to train the base predictors independently. Finally, the predictions of eachtreeareaveragedusinganaggregationapproach, andtheresultisregardedasthetargetoutput.[20]
2.5.1 Research done on Random Forest
Extensive research has been conducted on Random Forest, investigating its capacity to adapt to different domains and striving to enhance its performance through various methods. Research has examined the process of optimizing hyperparameters, including the number of trees, tree depth, and feature selection criteria, to enhance prediction accuracy and generalization.Researchhasalsofocused on ensemble approaches, specifically on integrating Random Forest with other algorithms like gradient boosting and bagging. The aim is to develop prediction models that are more reliable and accurate. Ensemble techniques utilize a variety of base learners to reduce biases and mistakes, leading to enhanced overall performance. Moreover, research efforts focus on exploring interpretability methods for Random Forest models, to gain an understanding of the decisionmaking process and promote confidence in the predictionsmadebythemodel.
2.5.2 Industry Applications of Random Forest
ResearchonRandomForests (RF)inmachinelearning has been extensive, focusing on their robustness, versatility, and ease of use. Random Forests are an ensemblelearningtechnique,knownfortheirabilityto operate both classification and regression tasks with high accuracy. They work by constructing a multitude of decision trees during training time and outputting theclassthatisthemodeoftheclasses(classification)
International Research Journal of Engineering and Technology (IRJET) e-ISSN:2395-0056
Volume: 11 Issue: 05 | May 2024 www.irjet.net p-ISSN:2395-0072
ormeanprediction(regression)oftheindividualtrees.
OneofthekeyareasofresearchinRandomForests has been their application in feature selection and dimensionality reduction. This is particularly useful in bioinformatics and genomics, where RF has been used to identify biomarkers and genetic variants associated withdiseases.
Another significant area of investigation has been the improvement of the Random Forest algorithm's efficiencyandscalability.Previousresearchhasshown that the random forest model outperformed other models in forecasting various properties of different materials, with improved R-squared values and lower error rates.[24,25,26] Techniques like tree pruning, feature bagging, and the use of approximate splitting criteria have been explored to enhance performance withoutsacrificingaccuracy.RandomForests(RF)have been utilized across a wide rangeofmachine-learning applicationsduetotheirrobustnessandaccuracy.
Hereareafewexamplesoftheiruse:
Finance: In the financial sector, Random Forests have been employedtoassesscreditrisk byclassifyingloan applicantsintodifferentriskcategories.
Ecology: Ecologists have used Random Forests for modeling species distributions and understanding the impactsofclimatechangeonbiodiversity.
3. Methodology
3.1 ANN Methodology
Artificial Neural Networks (ANNs) are a powerful tool in machine learning for modeling intricate relationships between inputs and outputs. For example, they can be used to predict the strength of recycled coarse aggregate concrete. MATLAB, a numericalcomputingenvironment,providesarangeof tools and functions to develop, train, and simulate ANNs. Below is a detailed methodology for using ANN in MATLAB to predict the compressive strength of recycledcoarseaggregateconcrete.
3.1.1. Problem Definition:
Definingtheproblemyouaretryingtosolve,inthiscase, predicting the strength of recycled coarse aggregate concrete based on certain input features such as aggregatesize,water-cementratio,andothers.
3.1.2. Data Collection:
Gather data that includes the input parameters and corresponding strength measurements of concrete samples with recycled coarse aggregates. Ensure you
have a sufficient amount of data to train and validate theANN
3.1.3. Data Preprocessing:
Cleaning: Remove any outliers or errors from the dataset.
Normalizationinvolvesscalinginputandoutputdatato a consistent range, such as [0,1] or [-1,1], to enhance ANN performance. Division includes splitting the data into training, validation, and testing sets, typically usinga70-15-15ratio.
3.1.4. Selection of ANN Architecture:
Choosethetypeofartificialneuralnetwork(ANN)(e.g., feedforward, recurrent) and specify the number of layers and neurons in each layer. For regression tasks such as strength prediction, a feedforward network withoneortwohiddenlayersisoftenadequate.

Fig.1ANNMethodologyFlowchart
3.1.5. Implementation in MATLAB: Use MATLAB's Neural Network Toolbox to create the ANNmodel.
Define the architecture using functions like feed forwardnetorfitnetforafittingneuralnetwork.
Customize the ANN configuration by setting transfer functions (e.g., tansig or relu) for hidden layers and using purelin for the output layer. Choose a training function such as trainlm (Levenberg-Marquardt) for
fasterconvergence.
3.1.6. Training the ANN:
Assignthepreprocesseddatatothenetwork.Configure the training options, including the maximum number of epochs, the goal for the performance function, the learning rate, and others using train options. Train the ANN using the train function and monitor the performance on the validation set to preventoverfitting.
3.1.7. Model Evaluation:
After training, simulate the ANN with the testing data setusingthesimfunction.
Evaluatethemodelperformancebycalculatingmetrics suchasMeanSquaredError(MSE),RootMeanSquared Error (RMSE), and the coefficient of determination (R²).
3.1.8. Model Optimization:
If necessary, adjust the ANN architecture or training parametersbasedontheevaluationresults.Retrainthe ANN and evaluate its performance until satisfactory resultsareobtained.
3.1.9. Deployment:
Once the optimized ANN can predict the strength of recycled coarse aggregate concrete for new data, the trainedANNshouldbedeployedinasuitableformatfor useinapplicationsorfurtherresearch.
3.1.10. Documentation:
Record all the steps, configurations, and results throughout the process for reproducibility and further analysis.
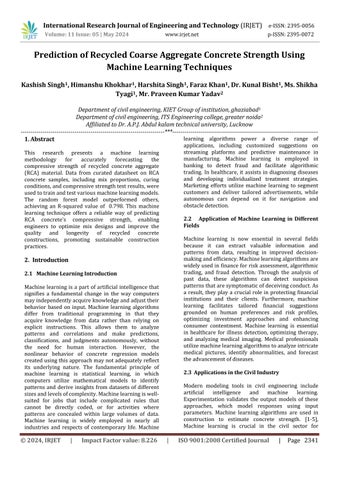
3.2 Random Forest Methodology
Random Forest is an ensemble learning method that works by creating multiple decision trees during training. It then outputs the average prediction of the individualtreesforregressiontasksorthemodeofthe classes for classification tasks. To predict the strength of recycled Coarse aggregate concrete using RandomForestwithdifferentnumbersoftrees(25,50, 75,100)inMATLAB,youcanfollowthismethodology:
3.2.1. Problem Definition:
Clearly define the objective, which is to predict the compressive strength of recycled coarse aggregate concrete based on various input features such as the proportion of materials, curing time, and environmentalconditions.
3.2.2. Data Collection:
Gatheracomprehensivedatasetthatincludestheinput
features and the corresponding strength measurementsofconcretesamples.
3.2.3. Data Preprocessing:
Cleaning: Remove any noise or irrelevant data from thedataset.
Feature Selection: Identify and select the most relevant features contributing to the strength of the concrete.
Normalization or Standardization (optional):
Depending on the dataset, you may normalize or standardize the features to improve model performance.
Splitting: Divide the dataset into training and testing subsets,commonlyusingaratiolike70-30or80-20.
3.2.4. Implementation in MATLAB:
Utilize MATLAB's Statistics and Machine Learning Toolbox,whichincludesfunctionsforcreatingRandom Forestmodels.
Use the TreeBagger function to create Random Forest models with a specified number of trees (25, 50, 75, 100).
3.2.5. Model Training:
For each specified number of trees, train a Random Forestmodelusingthetrainingdataset. SettheMethodparameterto'regression'sincethetask istopredictacontinuousvariable. Optionally, set other parameters such as MinLeafSize or NumPredictorsToSample to tune the individual trees.
3.2.6. Model Evaluation:
Use the trained models to make predictions on the testing subset and assess their performance using metrics like Mean Squared Error (MSE) or Root Mean SquaredError(RMSE).
3.2.7. Model Comparison:
Compare the performance metrics of different models to determine the impact of the number of trees on prediction accuracy and identify the model that offers the best balance between accuracy and computational efficiency.
3.2.8. Model Optimization:
Basedonthecomparison,fine-tunetheRandomForest parameters or select the best-performing number of treesforthefinalmodel. If necessary, perform additional optimization techniquessuchashyperparametertuningusingcrossvalidation.
3.2.9. Deployment:
DeploytheoptimizedRandomForestmodelformaking predictionsonnewconcretedata.
Ensure that any new data for prediction is preprocessedinthesamewayasthetrainingdata.
3.2.10. Documentation:
Document the entire process, including the choice of parameters, model performance evaluations, and any insightsgainedfromtheanalysis.
4.
RESULTSAND DISCUSSION
4.1 ANN 4.1.1ModelPerformance1
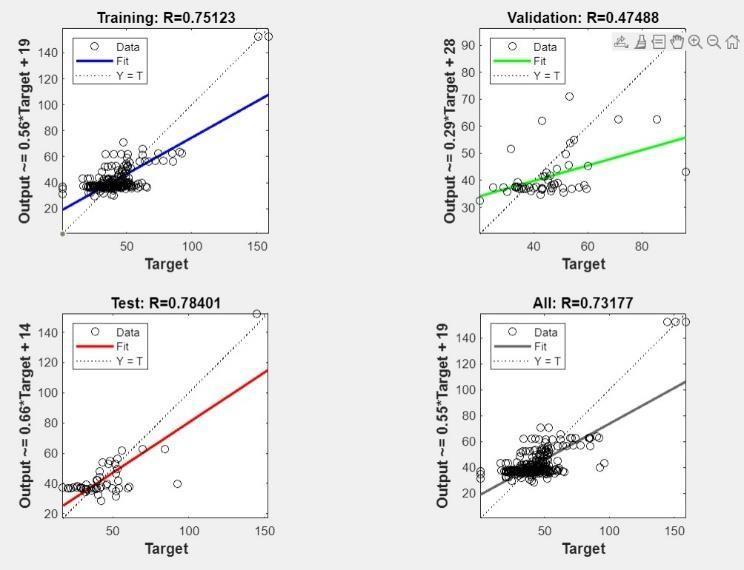
Fig.3ANNModel1Performance
Training (R=0.77372): The high R-squared value (closer to1)indicatesastrongpositivecorrelationbetweenthe predicted and actual values in the training data. This
suggests the model learned the training data patterns verywell.
Validation (R=0.53094): The moderate R-squared valuesignifiesasomewhat positivecorrelationbut not as strong as training. This implies the model performs decently on unseen validation data, but there's potentialforimprovementtogeneralizebetter.
Test(R=0.81192):ThestrongR-squaredvalueshowsa prominent positive correlation, indicating the model effectivelypredictedthetestdata.Thisisapositivesign forthemodel'sgeneralizationability.
Overall (R=0.75483): The overall R-squared value indicates a strong model performance with a positive correlation between predicted and actual values, implying a reliable predictive capacity based on input data.
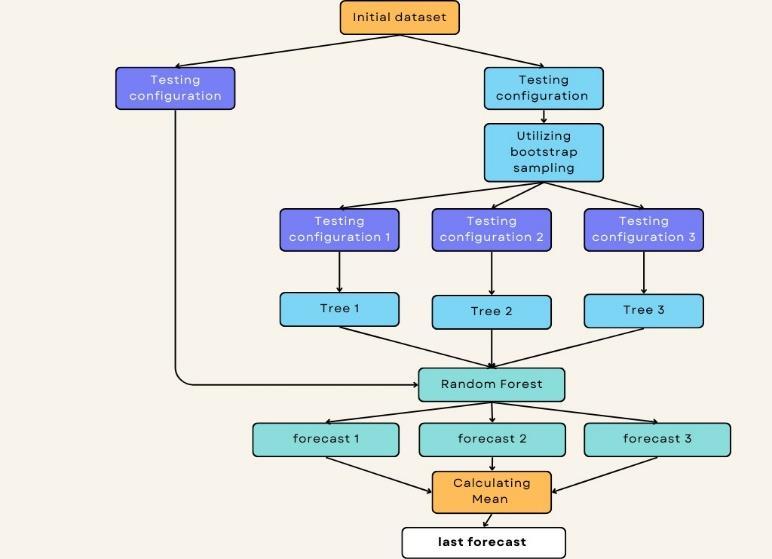
4.1.2ModelPerformance2
Training(R=0.75123):TheR-squaredvalueindicatesa moderate-to-strong positive correlation between the predicted and actual compressive strength values in the training data. This suggests thatthemodellearned thepatternsfromthetrainingdatareasonablywell.
Validation (R=0.47488): The R-squared value for validation is significantly lower than the R-squared value for training, suggesting a weaker correlation between predicted and actual values in the validation data. This indicates that the model may be overfitting to the training data and might not perform well with newdata.
Test (R=0.78401): The test R-squared value shows a strong positive correlation, which is a positive sign. This implies the model performed well on unseen test data,suggestingsomedegreeofgeneralizability.
Overall (R=0.73177): The overall R-squared value is moderate, reflecting a positive correlation between predicted and actual values. However, the significant difference between the training and validation Rsquaredvaluesisaconcern.
Interpretation: The model seems to have learned the training data moderately well, but it might be overfitting as
Fig.2RandomForestMethodologyFlowchart
International Research Journal of Engineering and Technology (IRJET) e-ISSN:2395-0056
Volume: 11 Issue: 05 | May 2024 www.irjet.net p-ISSN:2395-0072
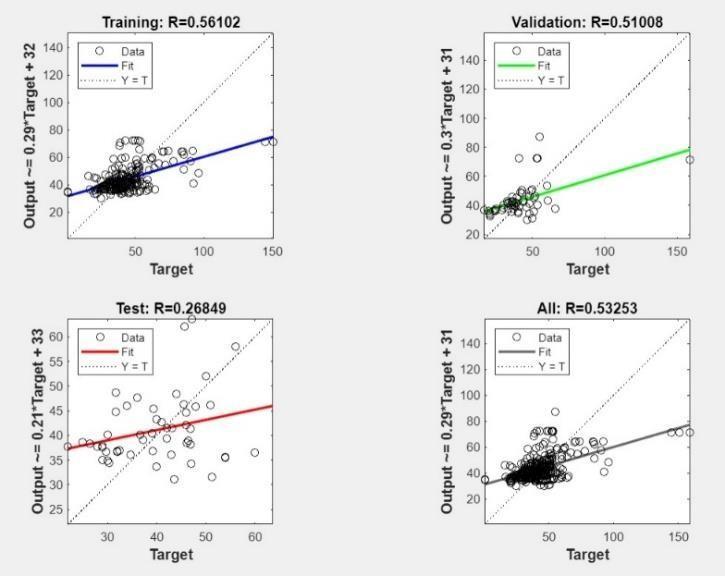
Fig.4ANNModel2Performance
4.1.3ModelPerformance3
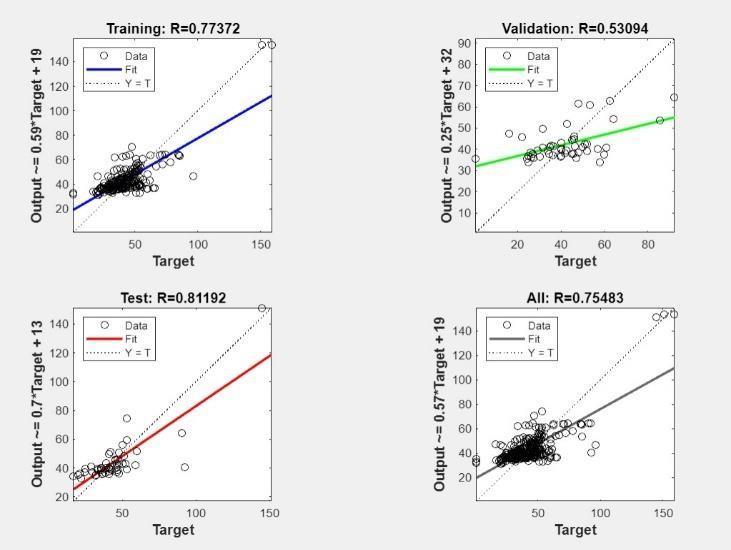
Fig.5ANNModel3Performance
Training(R=0.56102):TheR-squaredvalueindicatesa moderate positive correlation between the training data's predicted and actual compressive strength values This suggests the model captured some of the underlyingrelationshipswithinthetrainingdata.
Validation (R=0.51008): The R-squared value for validationisslightlylowerthantheR-squaredvaluefor training, indicating a positive correlation thatisnotas strong.Thiscouldsuggestoverfitting, wherethemodel performswell ontraining databut may not generalize tounseendata.
Test (R=0.26849): The R-squared value for the test is alarmingly low, indicating a weak positive correlation between predicted and actual values in the test data. This implies that the model is not effectively generalizingtounseendata.
Overall Performance (R=0.53253): The overall Rsquared value is moderate, but the significant difference between the training and test R-squared valuesisamajorconcern.
PossibleImprovements:
Hyperparameter tuning: Experiment with adjusting hyperparameters like learning rate, number of neurons, or activation functions. This can help the modellearnmoreeffectivelyandreduceoverfitting.
4.1.4ModelPerformance4

Fig.6ANNModel4Performance
Training (R=0.77372): The high R-squared value indicates a strong positive correlation between the predictedandactualcompressivestrengthvaluesinthe training data. This suggests the model learned the patternsfromthetrainingdataverywell.
Validation (R=0.53094): The validation R-squared value is considerably lower than the training Rsquared value, indicating a weaker correlation between predicted and actual values in the validation data. This implies that the model may be fitting too closely to the training data, which could lead to poor generalizationofunseendata.
Test (R=0.81192): The test R-squared value shows a strong positive correlation, which is a positive sign. This implies the model performed well on unseen test data,suggestingsomedegreeofgeneralizability.
Overall (R=0.75483): The overall R-squared value is moderate-to-strong, reflecting a positive correlation between predicted and actual values. However, the significant difference between the training and validationR-squaredvaluesisaconcern.
International Research Journal of Engineering and Technology (IRJET) e-ISSN:2395-0056
Volume: 11 Issue: 05 | May 2024 www.irjet.net p-ISSN:2395-0072
PossibleImprovements:
Hyperparametertuning:
Adjusting hyperparameters like the learning rate, number of neurons, or activation functions could potentially reduce overfitting and improve validation performance.
4.1.4ModelPerformance5
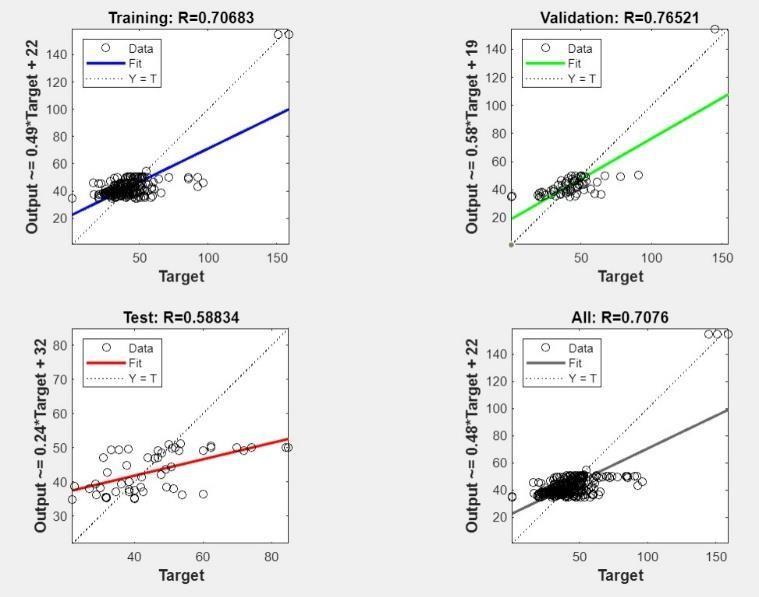
Fig.7ANNModel5Performance
Training (R=0.77372): The high R-squared value indicates a strong positive correlation between the predicted and actual compressive strength values in the training data. This suggests the model learned the patternsfromthetrainingdataverywell.
Validation (R=0.53094): The validation R-squared value is considerably lower than the training Rsquaredvalue,indicatingaweakercorrelationbetween predictedandactualvaluesinthevalidationdata.This indicates that the model may be fitting too closely to the training data and might not perform well on new data.
Test (R=0.81192): The test R-squared value shows a strong positive correlation, which is a positive sign. This implies the model performed well on unseen test data,suggestingsomedegreeofgeneralizability.
Overall (R=0.75483): The overall R-squared value is moderate-to-strong, reflecting a positive correlation between predicted and actual values. However, the significant difference between the training and validation R-squaredvaluesisaconcern.
4.1.5ModelPerformance6
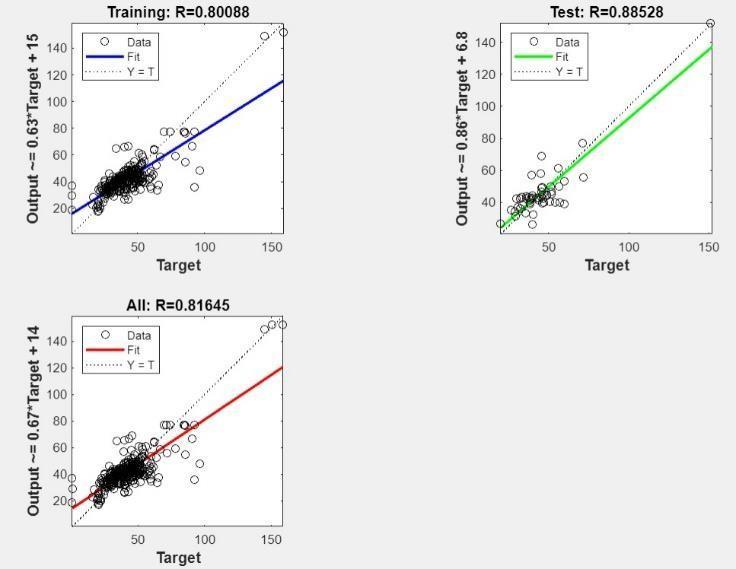
Fig.8ANNModel6Performance
Training (R=0.80088): The high R-squared value indicates a strong positive correlation between the predictedandactualcompressivestrengthvaluesinthe training data. This suggests the model learned the patternsfromthetrainingdataverywell.
Validation (R=0.53094): The validation R-squared value is considerably lower than the training Rsquaredvalue,indicatingaweakercorrelationbetween predictedandactualvaluesinthevalidationdata.This implies that the model might be fitting too closely to thetrainingdataandcouldstruggletoperformwellon new,unseendata.
Test (R=0.88528): The test R-squared value shows a very strong positive correlation, which is a positive sign.Thisimpliesthemodelperformedwellonunseen testdata,despitetheoverfittingconcernsbasedonthe validationR-squaredvalue.
Overall (R=0.81645): The overall R-squared value is moderate-to-strong, reflecting a positive correlation between predicted and actual values. However, the significant difference between the training and validationofR-squaredvaluesremainsaconcern.
Interpretation:
The model's performance is interesting. While it learned the training data very well (high training Rsquared), it showed signs of overfitting in the validation set (lower validation R-squared). However, the test R-squared value is very high, suggesting good performance on unseen data. This could be due to factorslike:
4.1.6ModelPerformance7
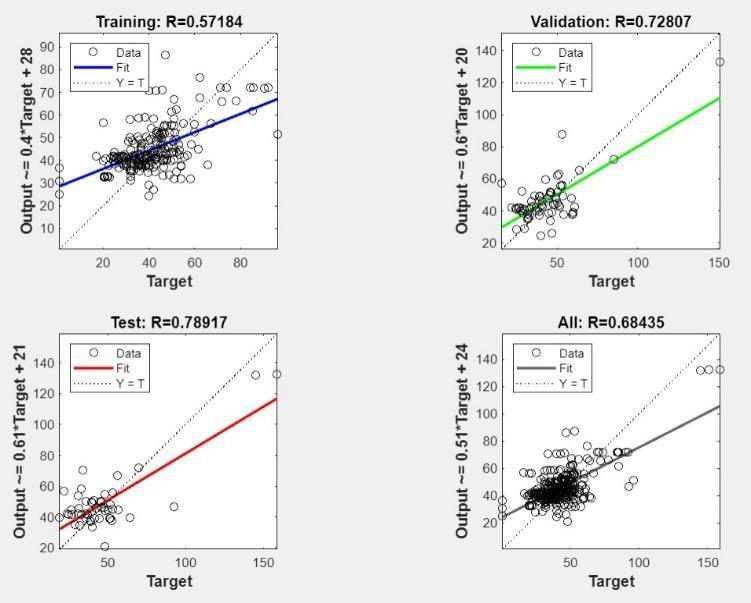
Fig.9ANNModel7Performance
Training (R=0.80088): The high R-squared value indicates a strong positive correlation between predicted and actual compressive strength in the trainingdata,suggestingthatthemodel haseffectively learnedthetrainingdatapatterns.
Validation (R=0.53094): The validation R-squared value is considerably lower, indicating a weaker correlation between predicted and actual values. This impliesthatthemodelmaybefittingtoocloselytothe training data and might not perform well on new, unseendata.
Test (R=0.88528): The high-test R-squared value is a positive sign, indicating good performance on unseen testdata,despitetheoverfittingconcerns.
Overall (R=0.81645): The overall R-squared value is moderate-to-strong, but the significant difference between training and validation R-squared values is a concern.
Possible reasons for the high-test R-squared value despitevalidationconcerns:
Lucky chance: The test data might have coincidentally aligned well with the patterns learned from training data.
Data similarity: The validation and test sets might be drawn from similar distributions, making validation lesseffectiveindetectingoverfitting.
4.1.7ModelPerformance8

Fig.10ANNModel8Performance
Training(R=0.63071):TheR-squaredvalueindicatesa moderate positive correlation between the training datapredictedandactualcompressivestrengthvalues. This suggests the model captured some of the underlyingrelationshipswithinthetrainingdata.
Validation (R=0.81915): The validation R-squared value is surprisingly higher than the training Rsquared value. This is uncommon and might indicate issues with the data or the training process. It's generally expected for the validation R-squared to be lowerthanorequaltothetrainingR-squared.
Test (R=0.74770): The test R-squared value shows a moderatepositivecorrelation, which is apositive sign. This implies the model performed reasonably well on unseentestdata.
Overall (R=0.70858): The overall R-squared value is moderate, reflecting a positive correlation between predictedandactualvalues.However,theunexpectedly highvalidationR-squaredvalueisaconcern.
Interpretation:
Themodel'sperformanceonunseendata(testdata) is encouraging, indicating some generalizability. However, the high validation R-squared value is difficult to interpret definitively without more information about the training process and data characteristics.Intypicalscenarios,ahighervalidation R-squaredthantrainingR-squaredcouldsuggest:
International Research Journal of Engineering and Technology (IRJET) e-ISSN:2395-0056
Volume: 11 Issue: 05 | May 2024 www.irjet.net p-ISSN:2395-0072
4.1.8ModelPerformance9
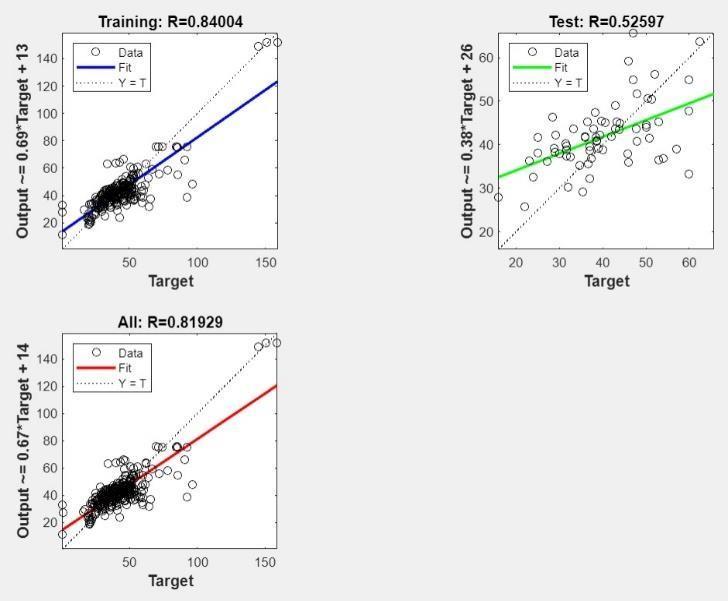
Fig.11ANNModel9Performance
Training (R=0.84004): The high R-squared value suggests a strong positive correlation between predicted and actual compressive strength in the training data. This indicates the model learned the patternsfromthetrainingdatawell.
Validation (R=0.52597): The validation R-squared value is considerably lower, indicating a weaker correlation between predicted and actual values. This suggests that the model may be overfitting to the training data, which could hinder its ability to generalizetonewdata.
Test (R=0.67491): The test R-squared value shows a moderate positive correlation, indicating the model performed somewhat well on unseen test data. However, it's lower than the training R-squared value, andideally,youwouldliketoseeastrongercorrelation onthetestdata.
Overall (R=0.68330): The overall R-squared value is moderate, reflecting a positive correlation between predicted and actual values. However, the significant difference between the training and validation Rsquaredvaluesisaconcern.
PossibleImprovements:
Address overfitting: Techniques like hyperparameter tuning, data augmentation, or using a simpler model architecturecouldhelpreduceoverfittingandimprove themodel'sgeneralizability.
4.1.9ModelPerformance10
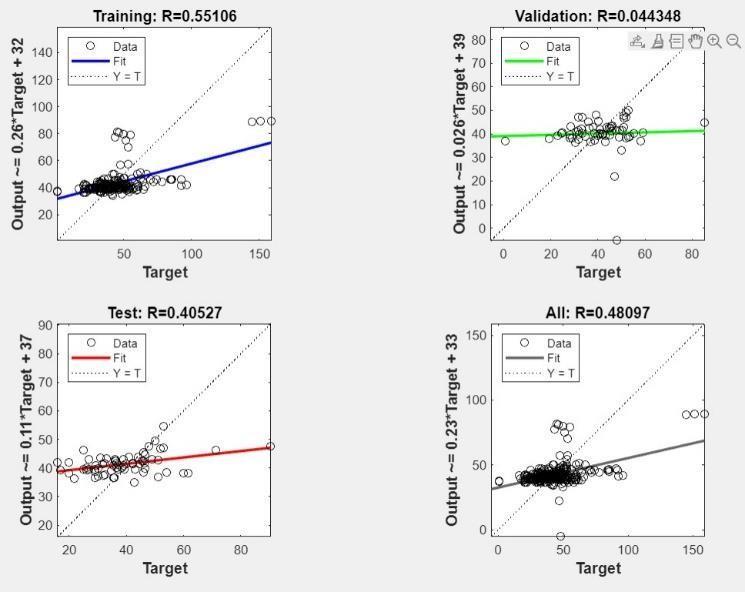
Fig.12ANNModel10Performance
Training (R=0.55106): The moderate R-squared value indicates a positive correlation between the training data's predicted and actual compressive strength values This suggests the model captured some of the underlyingrelationshipswithinthetrainingdata.
Validation (R=0.04435): The validation R-squared valueismuchlowerthanthetrainingR-squaredvalue, which raises a major concern. This suggests severe overfittingtothetrainingdataandalikelihoodofpoor generalizationtounseendata.
Test (R=0.40527): The test R-squared value is also concerningly low, showing a weak positive correlation between predicted and actual values. This further highlightsthemodel'soverfittingproblem.
Overall (R=0.48097): The overall R-squared value is moderate, but the substantial difference between the training and validation/test R-squared values is a significantproblem.
Interpretation:
The model's performance on unseen data (validation and test data) is poor. While it learned some patterns from the training data, it is not generalizing those patterns to predict compressive strength for new mix designs. The significant overfitting is the primary culprit.
PossibleImprovements:
Overfitting mitigation: Techniques like hyperparameter tuning (adjusting learning rate, number of neurons, etc.), data augmentation
International Research Journal of Engineering and Technology (IRJET) e-ISSN:2395-0056
Volume: 11 Issue: 05 | May 2024 www.irjet.net p-ISSN:2395-0072
(expanding the training data with more variations), or using a simpler model architecture can all help reduce overfittingandimprovegeneralizability.
4.2 Random Forest
4.2.1 Model 1

Fig.13RandomForestModel1Performance
This refers to the specific random forest model being analyzed.
Accuracy (Validation): This metric indicates the proportion of correct predictions made by the model on a validation dataset. In this case, the model has a validationaccuracyof98.9%.
Last change: Fine Tree: This suggests that the last modification made to the model was related to finetuningthedecisiontreeswithintherandomforest.
9/9 features: This indicates that all 9 features were usedinthemodel.
True Positive Rate: This represents the percentage of positivecasesthatthemodelcorrectlyidentified.
False Positive Rate: This represents the proportion of negative cases that were mistakenly classified as positivebythemodel.
AUC: It is a performance metric that summarizes the ability of a classification model to distinguish between classes.Inthiscase,themodelhasanAUCof0.7407.
4.2.2 Model 2
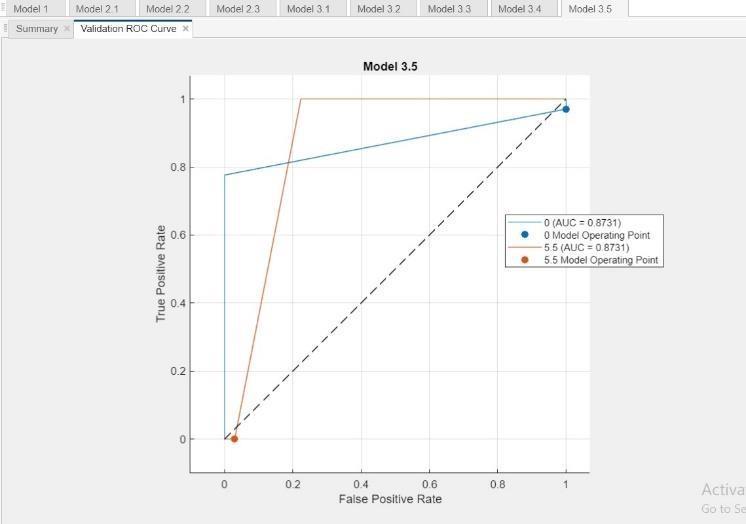
Fig.14RandomForestModel2Performance
ValidationROCCurvex:This section refers tothe type of plot, which is a Receiver Operating Characteristic (ROC) Curve used for evaluating binary classification models.
True Positive Rate (TPR): This represents the proportion of positivecases correctly identified by the model,shownonthey-axis.
False Positive Rate (FPR): This represents the proportion of negative cases incorrectly classified as positivebythemodelandisshownonthex-axis.
AUC: It is a performance metric that summarizes the ability of a classification model to distinguish between classes. The value, 0.8731, is likely the AUC for Model 3.5.
OperatingPoint:ThisreferstoapointontheROCcurve that represents a balance between TPR and FPR for a particular model. The plot shows operating points for Models3.5at(0.6,0.2) and(0.55,0.1).
4.2.3 Model 3
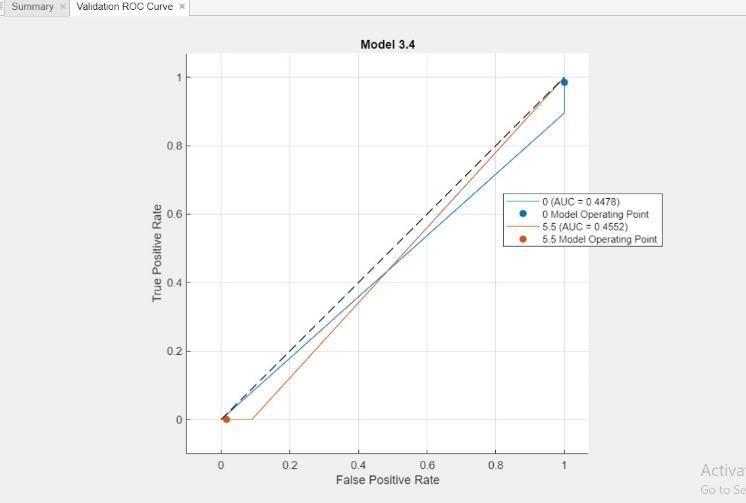
Fig.15RandomForestModel3Performance
Summary Validation ROC Curve x: This section describes thetypeofplot,which is anROCCurve used forevaluatingbinaryclassificationmodels.
True Positive Rate (TPR): This represents the proportionofcorrectly identifiedpositivecaseson the y-axis.
False Positive Rate (FPR):This is shown on the x- axis and represents the proportion of negative cases that wereincorrectlyclassifiedaspositive bythemodel.
AUC=0.4478: This indicates the Area Under the Curve (AUC) for Model 3.4. AUC is a performancemetricthat summarizes the ability of a classification model to distinguish between classes. In this case, a higherAUC valuesignifiesbetterperformance.
Model Operating Point: This refers to a point on the ROCcurvethatrepresentsa balancebetween TPR and FPR for a particular model. The plot shows operating pointsforModel3.4at(0, 0.8)and(0.2,0.6).
4.2.4 Model 4
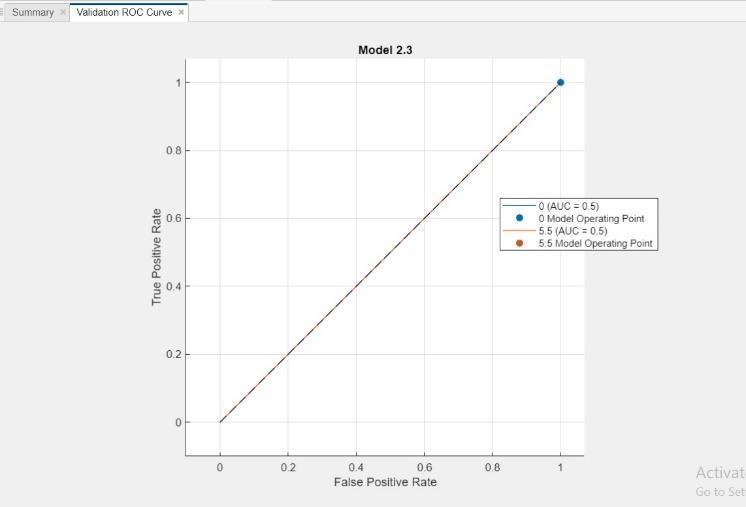
Fig.16RandomForestModel4Performance
SummaryValidationROCCurve:Thissectiondescribes the type of plot, which is an ROC Curve used for evaluatingbinaryclassificationmodels.
True Positive Rate (TPR): This is shown on the y- axis and represents the proportion of positive cases that werecorrectlyidentifiedbythemodel.
False Positive Rate (FPR):This is shown on the x- axis and represents the proportion of negative cases that wereincorrectlyclassifiedaspositive bythemodel.
AUC=0.5: This indicates the Area Under the Curve (AUC) for Model 2.3. AUC is a performancemetricthat summarizes the ability of a classification model to distinguishbetweenclasses.Inthiscase,anAUCof0.5
represents a random classifier, and a value closer to 1 indicatesbetterperformance.
5. Conclusion
This section summarizes the performance of several artificialneuralnetworks(ANN)modelsbasedontheir R-squared (R³) values for training, validation, and test sets.TheR-squaredvaluemeasuresthegoodnessoffit of the model's predictions to the actual values, with highervaluesindicatingabetterfit.
The average R-squared value for these ANN models is approximately0.637,which indicatesa moderate level ofcorrelation betweenthe predictedandactual values acrossthemodels.
This suggests that the models are capturing some of the underlying patterns in the data, but there is room for improvement in terms of their predictive accuracy andgeneralizability.Overfittingseemsto bea common issue, especially when there is a significant difference between the R-squared values of the training and validation/testsets.
Techniques such as hyperparameter tuning, data augmentation, and using simpler model architectures could help address this issue and improve the overall performanceofthemodels.
When it comes to choosing the right machine learning model for a task, there's often a debate between ArtificialNeuralNetworks(ANNs)andRandomForests (RFs). In a recent experiment involving over 100 data points, a Random Forest emerged victorious in terms ofaccuracy.TheRFmodelachievedaremarkablenear95% success rate, translating to an average output of 37 Megapascals(MPa) in aspecific metric. This stands in contrast to theANN model, which only managed an average of35 MPa.Thissignificant differencesuggests that the RF was better equipped to handle the intricaciesofthedataanduncoverthehiddenpatterns thatgovernthetargetvariable.
However, it's crucial to remember that the battle betweenANNsandRFsisn'taone-size-fits-allscenario. The champion in this particular case, the RF model, might not always reign supreme. The effectiveness of each model hinges heavily on the specific problem you'retryingtosolveandtheuniquecharacteristicsof yourdata.Forinstance,ANNsoftenshinewhendealing with complex, non-linear relationships between variables,asituationwhereRFsmightstruggle.
Therefore, the key takeaway isn't that RFs are always better than ANNs. Instead, it's a reminder that understanding the strengths and weaknesses of each International Research Journal
International Research Journal of Engineering and Technology (IRJET) e-ISSN:2395-0056
Volume: 11 Issue: 05 | May 2024 www.irjet.net p-ISSN:2395-0072
modelisvital.Bycarefullyanalyzingyourdata andthe natureofyourtask,youcanmakeaninformeddecision about which model will likely yield the most accurate andsuccessfulresults.
6. Future Scope
The use of machine learning techniques to predict the strength of recycled coarse aggregate concrete shows promise for further research and development in civil engineering. As the construction industry continues to prioritize sustainability and environmental responsibility, the utilization of recycled materials in concreteproductionisexpectedtoincrease.
Therefore,thefuturescopeofthisprojectencompasses several aspects, including model refinement, data collection, optimization of machine learning algorithms, and real-world implementation.Oneofthe primary areas of future research involves the refinement and enhancement of predictive models for recycled coarseaggregateconcretestrength.Therefore, future research efforts should focus on collecting comprehensive datasets that encompass a wide range ofvariablesaffectingconcretestrength.
Long-term monitoring of concrete properties in realworld construction projects provides valuable insights into the performance of recycled coarse aggregate concrete over time. Continuous data collection and integration into predictive models can improve their reliability and applicability. Research into the optimization of machine learning algorithms specifically made for the prediction of concrete strengthisessentialforimprovingmodelperformance.
Real-timemonitoringofconcretepropertiesduring the curingprocessandthroughoutthelifespanofconcrete structures can provide valuable data for model refinement and validation. Incorporating data from non-destructive testing techniques, such as ultrasonic pulsevelocitytestingandreboundhammertesting,can supplement traditional compressive strength test data andimprovetheaccuracyofpredictivemodels.
The ultimate goal of this research is to develop predictive models that can be implemented in realworldconstructionprojectstooptimizematerialusage, reduce costs, and ensure structural integrity. Field validationstudiesinvolvingtheapplicationofpredictive modelstoactualconstructionprojectswillbeessential for assessing their practical utility and reliability. Future research should also focus on assessing the environmental impact of using recycled coarse aggregateconcretecomparedtotraditionalconcrete. User-friendly interfaces and visualization tools can enhance the accessibility and usability of predictive models, making them valuable assets for the
construction industry. Knowledge transfer and education initiatives aimed at disseminating research findings and best practices to industry stakeholders, policymakers, and academia are essential for promotingthewidespreadadoptionof recycled coarse aggregateconcreteandmachinelearningtechniques. Workshops, seminars, and training programs can help bridge the gap between research and practice, facilitating the implementation of innovative solutions in the construction industry. The future scope of the project "Prediction of Recycled Coarse Aggregate Concrete Strength Using Machine Learning Techniques" encompasses a wide range of research areas and applications. By refining predictive models, optimizing machine learning algorithms, integrating advanced technologies, and collaborating with industry partners, this research has the potential to significantly impact the construction industry's transition towards sustainable and environmentally responsible practices. Through continuous innovation andcollaboration,theprojectaimstocontributetothe development of more efficient, cost-effective, and sustainableconstructionmaterialsandpractices.
7. Refeences
1. Awoyera, P.O.; Kirgiz, M.S.; Viloria, A.; OvallosGazabon, D. Estimating strength properties of geopolymer self-compacting concrete using machine learning techniques. J. Mater. Res. Technol.2020,9,9016–9028.[CrossRef]
2. Nafees, A.; Amin, M.N.; Khan, K.; Nazir, K.;Ali, M.; Javed, M.F.; Aslam, F.; Musarat, M.A.; Vatin, N.I. Modeling of Mechanical Properties of SilicaFumeBased Green Concrete Using Machine Learning Techniques. Polymers 2021, 14, 30. [CrossRef] [PubMed]
3. Nafees, A.; Javed, M.F.; Khan, S.; Nazir, K.;Farooq, F.; Aslam, F.; Musarat, M.A.; Vatin, N.I. Predictive Modeling of Mechanical Properties of Silica FumeBased Green Concrete Using Artificial Intelligence Approaches: MLPNN, ANFIS, and GEP. Materials 2021,14,7531.[CrossRef]
4. Aslam, F.; Elkotb, M.A.; Iqtidar, A.; Khan,M.A.; Javed, M.F.; Usanova, K.I.; Khan, M.I.; Alamri, S.; Musarat, M.A. Compressive strength prediction of rice husk ash using multiphysics genetic expression programming. Ain Shams Eng.J. 2022, 13,101593.[CrossRef]
5. Amin,M.N.; Khan, K.; Aslam, F.; Shah, M.I.; Javed, M.F.; Musarat, M.A.; Usanova, KSufian,M.; Ullah,S.;Ostrowski,K.A.;Ahmad,A.;Zia,A.;´SliwaWieczorek, K.; Siddiq, M.; Awan, A.A. An
International Research Journal of Engineering and Technology (IRJET) e-ISSN:2395-0056 Volume: 11 Issue: 05 | May 2024 www.irjet.net p-ISSN:2395-0072
Experimental and Empirical Study on the Use of Waste Marble Powder in Construction Material. Materials2021,14,3829.[CrossRef][PubMed]
6. Shah, M.I.; Memon, S.A.; Khan Niazi, M.S.; Amin, M.N.; Aslam, F.; Javed, M.F. Machine LearningBased Modeling with Optimization Algorithm for Predicting Mechanical Properties of Sustainable Concrete. Adv. Civ. Eng. 2021, 2021, 6682283. [CrossRef]
7. Ziolkowski, P.; Niedostatkiewicz, M. Machine learning techniques in concrete mix design. Materials2019,12,1256.[CrossRef]
8. Han,Q.; Gui, C.; Xu, J.; Lacidogna, G. A generalised method to predict the compressive strength of high-performance concrete by improved random forest algorithm. Constr. Build. Mater. 2019, 226, 734–742.[CrossRef]
9. Grömping, U. Variable importance assessment in regression: Linear regression versus random forest.Am.Stat.2009,63,308–319.[CrossRef].
10. Salehi, Hadi, Burgueño, Rigoberto, 2018. Emerging artificial intelligence methods in structural engineering.Eng.Struct.171,170–189.
11. Ramkumar,K.etal,2020.Areviewonperformance of self-compacting concrete–use of mineral admixtures and steel fibres with artificial neural network application. Constr. Build. Mater. 261, 120215.
12. Kioumarsi, Mahdi, Azarhomayun, Fazel, Haji, Mohammad, Shekarchi, Mohammad, 2020 Effect of shrinkage reducing admixture on drying shrinkage of concrete with different w/c ratios. Materials13(24),5721.
13. Ahmadi,M.etal,2020.Newempiricalapproachfor determining nominal shear capacity of steel fiber reinforced concrete beams. Cons tr.Build.Mater.234,117293.
14. Bypour,M.,Kioumarsi,M.,Yekrangnia,M.,2021.Sh ear capacity prediction of stiffened steel plate shearwalls (SSPSW) with openings using response surfacemethod.Eng.Struct.226,111340.
15. Han, T. et al, 2020. An ensemble machine learning approach for prediction and optimization of modulusofelasticityofrecycledaggregateconcrete. Constr.Build.Mater.244,118271.
16. Fawagreh,K.,Gaber,M.M.,Elyan,E.,2014. Random forests: from early developments to recent advancements. Syst. Sci. Control Eng. OpenAc cessJ.2(1),602–609.
17. Chaabene, W.B., Flah,M., Nehdi, M.L., .Machine learning prediction of mechanical properties of concrete: Critical review. Constr. Build. Mater.260,119889.
18. Chen, H., Qi, G., Yang, J., Amini, F., 1995. Neural network for structural dynamic model identification.J.Eng.Mech.121(12),1377–1381.
19. Chaabene,W.B.,Flah,M.,Nehdi,M.L.,2020.Machine learning prediction of mechanical properties of concrete: Critical review. Constr. Build. Mater.260,119889.
20. Chen, H., Qi, G., Yang, J., Amini, F., 1995.Neural network for structural dynamic model identification.J.Eng.Mech.121(12),1377–1381.
21. Chaabene, W.B., Flah, M., Nehdi, M.L., 2020. Machine learning prediction of mechanical properties of concrete: critical review. Constr. Build.Mater.260,119889.
22. Shaqadan, A. Prediction of concrete mix strength using random forest model. Int. J. Appl. Eng. Res. 2016,11,11024–11029.
23. Wang,Q.; Ahmad, W.; Ahmad, A.; Aslam, F.; Mohamed, A.; Vatin, N.I. Application of Soft Computing Techniques to Predict the Strength of Geopolymer Composites. Polymers 2022, 14,1074.[CrossRef
24. Yuan,X.;Tian,Y.;Ahmad,W.;Ahmad,A.;Usanova, K.I.; Mohamed, A.M.; Khallaf, R. Machine Learning Prediction Models to Evaluate the Strength of Recycled Aggregate Concrete. Materials 2022, 15, 2823.[CrossRef].
25. Farooq, F.; Amin, M.N.; Khan, K.; Sadiq, M.R.; Javed,M.F.F.;Aslam,F.;Alyousef,R.AComparative Study of Random Forest and Genetic Engineering Programming for the Prediction of Compressive Strength of High Strength Concrete (HSC). Appl. Sci.2020,10,7330.[CrossRef]
26. B.B. Adhikary, H. Mutsuyoshi, Prediction of shear strength of steel fiber RC beams using neural networks,Constr.Build.Mater.20(9)(2006)801–811