
International Research Journal of Engineering and Technology (IRJET) e-ISSN: 2395-0056
Volume: 11 Issue: 05 | May 2024 www.irjet.net p-ISSN: 2395-0072
International Research Journal of Engineering and Technology (IRJET) e-ISSN: 2395-0056
Volume: 11 Issue: 05 | May 2024 www.irjet.net p-ISSN: 2395-0072
Nilam N. Parmar1, Dr. Sweta S. Panchal2
1Research Scholar, Computer Science and Engineering, Dr. Subhash University, Gujarat, India
2Associate Professor, Electronics and Communication, Dr. Subhash University, Gujarat, India
Abstract - Customer segmentation in virtual shopping is enhanced through RFM analysis, focusing on the recency, frequency, and monetary value of purchases. RFM analysis allows for a deeper understanding of customer behaviors and preferences, enabling businesses to tailor their marketing strategieseffectively.Bycategorizingcustomersbasedontheir past purchasing patterns, businesses can optimize their approaches for different customer segments. Analyzing the recency,frequency,andmonetaryvalueofpurchasesprovides valuable insights that can guide targeted marketing efforts. This study emphasizes the importance of utilizing RFM analysis in virtual shopping environments to improve customer segmentation and enhance overall marketing strategies. By leveraging RFM analysis, businesses can better understandtheircustomers' needsandpreferences,leadingto more personalized and effective marketing campaigns.
Key Words: Customer segmentation, Virtual shopping, Recency,FrequencyandMonetaryValue,RFMAnalysis
Marketersareawarethatcustomershavediverseneedsand desires. To effectively identify and understand different customer groups, companies have employed various segmentationcriteriaandtechniques,enablingthemtooffer tailored products and services that meet these varying needs. Segmentation also allows companies to create profitable segments and respond strategically to these segments based on their competitive strengths. However, many marketers struggle with accurately identifying the right customer segments for organizing marketing campaigns[1]
To formulate a marketing strategy, segmentation is employed to cluster customers based on their loyalty criteria.Segmentingthecustomerbaseisoneoftheinitial stepsindevelopingabusinessmodel.Thisprocessinvolves dividing a customer base into uniform subgroups, each considered a distinct marketing audience. Customer segmentation helps quantify customer value, enabling businessestoidentifyhigh-revenueclientsandthose who generatelessrevenue [2]
In data segmentation, customers are grouped into sets of individualswithdistinctsimilarities.Relevantattributesfor customer segmentation include gender, age, lifestyle,
location, purchase behavior, and income behavior. These attributes are primarily categorized based on historical purchasingbehavior,which canleadtospecific outcomes, suchasincreasedsalesandhigherprofitsforthecompany. [3].
Clusteringinvolvesdividingorgroupingcustomersbasedon their interactions with the company, whether direct or indirect. Customer data can include metrics such as time spent on social media platforms, transaction data, or time spentonspecificposts.Thispaperfocusesonthetransaction data of customers from a UK online retail ecommerce platform. Although the dataset contains numerous attributes, selecting the most relevant ones is crucial for optimal results. To address this challenge, many data scientists prefer using the K-means algorithm, an unsupervisedlearningmethod,inconjunctionwiththeRFM model. RFM stands for recency, frequency, and monetary valueofacustomer.Thecollecteddatacanthenserveasa foundationforcustomersegmentation[4].
The aim of this paper is to identify the type of customer (supercustomers,intermediatecustomers,basecustomers) and determine their value so that companies can discern which customer classes generate substantial revenue and whichdonot.Thisinformationwillhelpcompaniesdevelop newmarketstrategiestoimprovetheirrevenuegrowth[4].
Recency, frequency, and monetary (RFM) analysis is an effective method for market segmentation and behavioral analysis.ThemainadvantageoftheRFMmodelisitsability to provide a detailed behavioral analysis of customers, groupingthemintohomogeneousclusters.Additionally,it helps develop a marketing plan tailored to each specific market segment. RFM analysis enhances market segmentation by examining when customers made purchases (recency), how often they made purchases (frequency),andhowmuchmoneytheyspent(monetary). Customerswhohaveboughtmostrecently,mostfrequently, andhavespentthemostmoneyaremorelikelytorespond tofuturepromotions[5].
The strength of the RFM model lies in its use of several observableandobjectivevariables,allofwhicharederived fromeachcustomer'spastorderhistory.Thesevariablesare
International Research Journal of Engineering and Technology (IRJET) e-ISSN: 2395-0056
Volume: 11 Issue: 05 | May 2024 www.irjet.net p-ISSN: 2395-0072
categorizedaccordingtothreeindependentcriteria:recency, frequency,andmonetaryvalue.Recencyreferstothetime intervalbetweenacustomer'slastpurchaseandaspecified referencepoint,withashorterintervalindicatingahigher likelihood of repeat purchases. Frequency measures the number of transactions a customer has made within a particulartimeframe,whilemonetaryvaluerepresentsthe amountofmoneyspentduringthatperiod.Traditionally,the RFMmodelisappliedbysortingcustomerdataaccordingto each RFM variable and dividing them into quintiles. Segmentationstartsbyrankingcustomersbasedonrecency, followedbyfrequency,andthenmonetaryvalue[5]
The RFM model is highly effective in building customer segmentation models. However, its simplicity can limit its power,asimprovementsoftenrequiremanualadjustments. Additionally,RFMmodelsmaystruggletoadapttochanges in the business environment, necessitating ad hoc managerial decisions. This paper identifies optimal definitionsforR,F,andMtocreateadynamicRFMmodel. ByincorporatingK-Meansclustering,weproposeanR+FM model that dynamically builds customer segmentation models[6].
TheresearcheremploystheRFM(Recency,Frequency,and Monetary) model, a widely used approach for segmenting customersbasedontheirlastvisittime,visitfrequency,and revenue generated for the company. One of the primary reasonsforpersistingwiththeRFMmodelisitssimplicity and ease of implementation within companies. Moreover, RFMisreadilycomprehensibletomanagersandmarketing decision-makers.[6].
There are multiple distinct steps in the procedure. Additionally,thedataset'savailabledatawillbepreprocessed usingtheKnowledgeDiscoverytechniqueaspartofthefirst phase. After that, the important data will be extracted for trainingusingamachinelearningmethod.
After that, the Min-Max normalization method is utilized. Findingtheprobabilitythatascorewillfallintothedataset's normaldistributionisitsmaingoal.Clusteringisusedinthis proceduretoexamineunlabeleddataandfindclusters.This stageinvolvesgroupingthedataaccordingtohowsimilar theyaretooneanotherintermsofaparticularattribute.
Finally,SilhouetteAnalysisisappliedtoassesshowclosethe datapointsaretooneanotherineachcluster.Thismakesit easier to create a graphical depiction that accurately represents the classification outcomes produced by the algorithm.
The dataset utilized comprises transactional information from an online retail business based in the UK, aimed at
clustering analysis. It consists of 525,461 records with 8 distinctattributes:
Invoice: Each transaction is assigned a unique integral number,representingtheinvoicenumber.Ifatransactionis cancelled,itismarkedwitha'c'.
StockCode: A unique nominal number assigned to each product,servingasitsproductcode.
Description:Thisattributedenotesthenameoftheproduct, categorizedasnominal.
Quantity: Numeric data representing the quantity of each productinvolvedinatransaction.
InvoiceDate:Indicatesthedateandtimeofeachtransaction, recordedasnumericdata.
Price:Numericdatarepresentingtheunitpriceofaproduct, denotingtheproductpriceperunit.
Customer ID:Eachcustomerisassignedauniqueintegral number,servingastheircustomerID.
Country:Denotesthecountrynameofthecustomerinvolved inthetransaction.
This dataset offers a comprehensive view of the online retail transactions, facilitating insights into customer behavior,productpopularity,andgeographicdistribution.
Data columns (total 8 columns):
# Column Non-Null Count Dtype
0 Invoice 370929 non-null object
1 StockCode 370929 non-null object
2 Description 370929 non-null object
3 Quantity 370929 non-null int64
4 InvoiceDate 370929 non-null datetime64[ns]
5 Price 370929 non-null float64
6 CustomerID 370929 non-null object
7 Country 370929 non-null object
8 Amount 370929 non-null float64
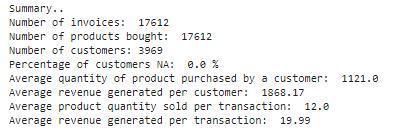
Fig -1:DataAnalysisofeachAttribute
International Research Journal of Engineering and Technology (IRJET) e-ISSN: 2395-0056
Volume: 11 Issue: 05 | May 2024 www.irjet.net p-ISSN: 2395-0072
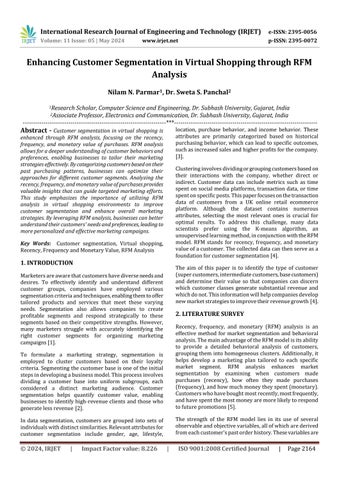
ThestudyofTable1andFig.1aboveshowsthatthedataset contains a great deal of rich and diverse information, offeringmanychancesforextractionandresearch.Owingto itsextensivefeatureset,whichincludestransactionhistory, product details, and consumer demographics, the dataset presentsawiderangeofanalyticalopportunities.Itmakesit possible to do thorough analyses of consumer behavior, product popularity, long-term purchasing trends, and relationships between different factors. The depth of the datasetalsomakesiteasiertodivideuptheconsumerbase into discrete groups, which allows for more specialized marketingandcustomizedtactics.
The model consists of the following phases to acquire the cluster,whichisnothingmorethancustomersegmentation, as illustrated in Fig.-2 Here, the entire dataset was first obtainedandloaded,andthenallpreprocessingorcleaning of the data was completed by applying methods such as scaling,addressingmissingvalues,andremovingduplicate values.
UsingtheRFMmodeltocalculateeachcustomer'sRecency, Frequency,andMonetaryscore;finally,usingtheK-means methodtoplacetheclientintheappropriatecluster.
A CSV file containing the dataset discussed earlier was imported to create a new data frame. Through a series of
preprocessingsteps,thedatawascleanedandaggregatedas per the specified requirements. The original dataset, comprisingapproximately525,461tuples,wasrefinedtoa retailsalesdatasetcontaining370,929tuples.
Duringpreprocessing,NAvalueswereremoved,andanew attribute named Revenue was introduced, calculated by multiplyingthequantitybytheunitprice.Additionally,two additional datasets were created through aggregation: customeraggregatedataandinvoiceaggregatedata.
Severalstepsweretakentocleanthedatafurther:invoices unrelatedtocustomerswerediscarded,alongwithduplicate entries,fullycancelledtransactions,andentrieswithmissing valuesintheCustomerIDcolumn.Thesemeasuresensured the integrity and quality of the dataset for subsequent analysis.
RFM (Recency, Frequency, Monetary) analysis serves as a robustmarketingtoolforcustomersegmentation,drawing insights from customer behavior. This model categorizes customersbasedontheirtransactionalpatterns,focusingon how recently, how often, and how much they have purchased. By leveraging RFM analysis, businesses can identify clusters of customers who may be at risk of discontinuingtheirrelationshipwiththecompany.
1. Recency: This metric gauges the freshness of customeractivitiesbymeasuringthetimeelapsed sincetheirlasttransaction.
2. Frequency: Frequency assesses the rate of customertransactions,oftenquantifiedasthetotal numberofrecordedtransactions.
3. Monetary: Monetary value encapsulatesthe total amount spent by each customer, indicating their overalltransactionalvalue.
TheRFMfactorsshedlightonkeyinsights:
1. Recent purchases indicate heightened responsiveness to promotional efforts from customers.
2. Higher frequency in purchases typically reflects greatercustomerengagementandsatisfaction.
3. Monetary value helps differentiate between customerswhoareheavyspendersandthosewho makelower-valuepurchases.
Employing RFM analysis allows businesses to tailor their marketing strategies more effectively, targeting specific customersegmentswithtailoredapproachesbasedontheir transactionalbehaviors.[1]
International Research Journal of Engineering and Technology (IRJET) e-ISSN: 2395-0056
Volume: 11 Issue: 05 | May 2024 www.irjet.net p-ISSN: 2395-0072
TheprocessofRFMcalculationinvolvesseveralstages:
1. Recency Calculation: Recency is determined for each client by subtracting their most recent transactiondatefromthemostrecentdatefoundin theentiredataset, whichinthiscaseisDecember 11,2010.Thisreferencedateisusedtocalculatethe recencyvalueforeachcustomer.
2. FrequencyCalculation:Frequencyiscalculatedby summingupthetotalnumberofpurchasesmadeby each individual customer, providing insights into howoftentheyengageintransactions.
3. Monetary Computation: Monetary value is computed by considering the quantity of each productpurchasedanditscorrespondingunitprice. Bysummingupthetotalsofalltransactionsmade by each customer, their overall expenditure is determined.
These steps enable businesses to gain a comprehensive understanding of their customers' behavior, allowing for more targeted marketing strategies and personalized approachestocustomerengagement.
Table-2 ResultforRecency,FrequencyandMonetary Calculation
firmsareabletosuccessfullycustomizetheirplans,boosting corporateimpactandconsumerengagement.
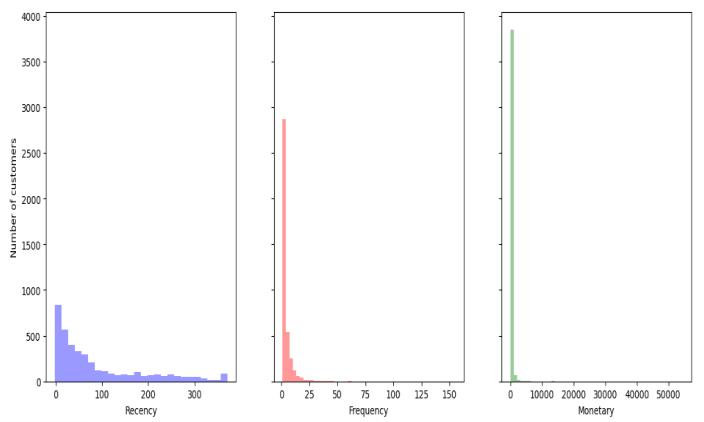
Chart-1 graph assists businesses in modifying their marketingstrategiesandproductofferingsbydisplayingthe distributionofcustomersacrossdifferentrecency,frequency and monetary divisions. Higher bars indicate a larger proportion of customers falling into that demographic, whereas shorter bars indicate fewer people. through examining the distribution of the bars in the areas of monetary,frequency,andrecency.
Thefindingsofthisstudycanbemappedoutandpotential clients identified using a decision support system in the lendingindustry.ByemployingtheRFMapproachforitem segmentation and clustering by item category, we may increasetherecommendationaccuracyandbetterrepresent the attributes of the items. Consequently, we are able to suggest the k-means clustering of item category based on RFMpersonalizedrecommendationsystem.
This study's primary goal was to use the RFM model to separatethecustomerIDsfromthe525461transactiondata sets.
From Table 2 above Customers are given values for the Recency,Frequency,andMonetaryparametersinthefirst stagesofRFManalysis.Thecustomerlististhendividedinto tiers according to three dimensions (R, F, and M), which serve as the foundation for specialized advertising and marketingefforts.Withthehelpofthissmartmethodology,
Future work could focus on refining the decision support systembyintegratingadvancedmachinelearningtechniques toenhancetheaccuracyofitemsegmentationandclustering. Additionally,exploringtheimplementationofreal-timedata analysisandincorporatingcustomerfeedbackcouldimprove thepersonalizationandeffectivenessoftherecommendation system. Expanding the scope to include more diverse datasetsandtestingthemodelindifferentindustrycontexts would provide valuable insights and broaden its applicability.
Furthermore,investigatingtheintegrationofothercustomer behavior metrics beyond RFM could offer a more holistic approachtocustomersegmentationandrecommendation accuracy.
International Research Journal of Engineering and Technology (IRJET) e-ISSN: 2395-0056
Volume: 11 Issue: 05 | May 2024 www.irjet.net p-ISSN: 2395-0072
[1] Ms Sarika Rathi and Prof. Vijay Karwande, “Review PaperonCustomerSegmentationApproachUsingRFM and K-Means Clustering Technique,” © 2022 IJCRT,Volume10,Issue12December2022ISSN:23202882.
[2] Ali Khumaidi, Herry Wahyono, “RFM-AR Model for CustomerSegmentationusingK-MeansAlgorithm”E3S WebofConferences465,02005(2023)ICIMECE2023, DOI:10.1051/e3sconf/202346502005
[3] P. Anitha, Malini M. Patil “RFM model for customer purchase behavior using K-Means algorithm” https://doi.org/10.1016/j.jksuci.2019.12.011 13191578/ 2019TheAuthors.PublishedbyElsevierB.V.on behalfofKingSaudUniversity.
[4] Rahul Shirole, Laxmiputra Salokhe “Customer Segmentation using RFM Model and K-Means Clustering”InternationalJournalofScientificResearch in Science and Technology Print ISSN: 2395-6011 | Online ISSN: 2395-602X (www.ijsrst.com) doi : https://doi.org/10.32628/IJSRST2183118
[5] Rachid AIT DAOUD, Belaid BOUIKHALENE, Abdellah AMINE “Combining RFM Model and Clustering TechniquesforCustomerValueAnalysisofaCompany sellingonline”978-1-5090-0478-2/15/$31.00©2015 IEEE.
[6] NikitaBagul,PreranaBerad,Prof.PriyaSurana“Retail Customer Churn Analysis using RFM Model and KMeansClustering”InternationalJournalofEngineering Research & Technology (IJERT) http://www.ijert.org ISSN: 2278-0181 IJERTV10IS030170 (This work is licensed under a Creative Commons Attribution 4.0 InternationalLicense.)Publishedby:www.ijert.orgVol. 10Issue03,March-2021.
2024, IRJET | Impact Factor value: 8.226 |