
International Research Journal of Engineering and Technology (IRJET) e-ISSN: 2395-0056
Volume: 11 Issue: 05 | May 2024 www.irjet.net p-ISSN: 2395-0072
International Research Journal of Engineering and Technology (IRJET) e-ISSN: 2395-0056
Volume: 11 Issue: 05 | May 2024 www.irjet.net p-ISSN: 2395-0072
Nishita N. Merh1
1Student, Madhav Institute of Science and Technology, Gwalior, India
Abstract - This paper discusses about two approaches for image processing. First is conventional digital image processing algorithm and second is the use of convolutional neural network (CNN) for finding image specific parameters. The proposed approach aims to automate the process of finding specific parameters of a given blob image having a normal distribution and using them for its classification.
Key Words: ConvolutionalNeural Network(CNN),Digital ImageProcessing(DIP).
In the field of Artificial Intelligence (AI) and Machine Learning(ML),the“data”playsavitalrole.Thisdataneeds to be processed, analyzed and inferences are drawn and learned. Then only any AI/ML based system can perform optimally. The data may belong to finance, engineering, science,orsocialfields.Foranalysisofanykindofdataand forgettinganyinference outofit,a statistical approachis required. This leads to studying the distribution of data. Normal or Gaussian distribution is the fundamental distributionthatisusedacrossallthedomainsrangingfrom science,technology,medicaltofinanceandsocialstudies.
Inthispaperwewill generateaGaussiandistributionofa blob and find it parameters viz. centre and spread, with conventional digital image processing. The same shall be comparedwithautomatedprocessoffindingtheparameters with the use of CNN. The results of the processing are presented.
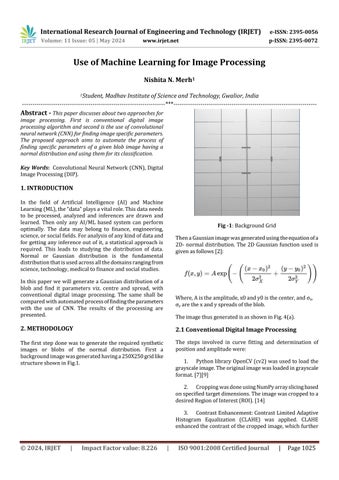
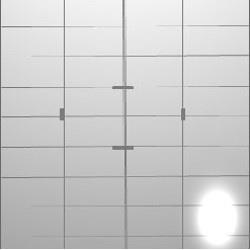
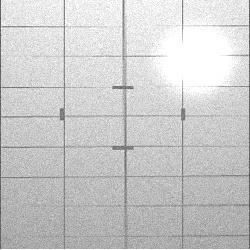
Thefirststep donewastogeneratetherequired synthetic images or blobs of the normal distribution First a backgroundimagewasgeneratedhavinga250X250gridlike structureshowninFig.1.
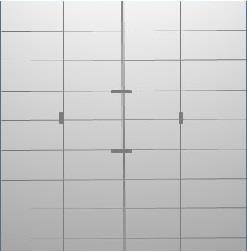
Fig -1:BackgroundGrid
ThenaGaussianimagewasgeneratedusingtheequationofa 2D- normal distribution. The 2D Gaussian functionusedis givenasfollows[2]:
Where,Aistheamplitude,x0andy0isthecenter,andσx, σy arethexandyspreadsoftheblob.
TheimagethusgeneratedisasshowninFig.4(a).
The steps involved in curve fitting and determination of positionandamplitudewere:
1. PythonlibraryOpenCV(cv2)wasusedtoloadthe grayscaleimage.Theoriginalimagewasloadedingrayscale format.[7][9]
2. CroppingwasdoneusingNumPyarrayslicingbased onspecifiedtargetdimensions.Theimagewascroppedtoa desiredRegionofInterest(ROI).[14]
3. ContrastEnhancement:ContrastLimitedAdaptive Histogram Equalization (CLAHE) was applied. CLAHE enhancedthecontrastofthecroppedimage,whichfurther
International Research Journal of Engineering and Technology (IRJET) e-ISSN: 2395-0056
Volume: 11 Issue: 05 | May 2024 www.irjet.net p-ISSN: 2395-0072
helped in bringing out details in both bright and dark regions.[11]
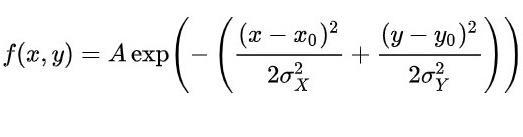
4. BlobSegmentation:BinaryThresholding(>245)and Contour Finding (cv2.findContours ()) were performed. Thresholding was applied to segment the blob from the background. Contours were then found in the thresholded image,andthelargestcontourwasassumedtheblob[9]
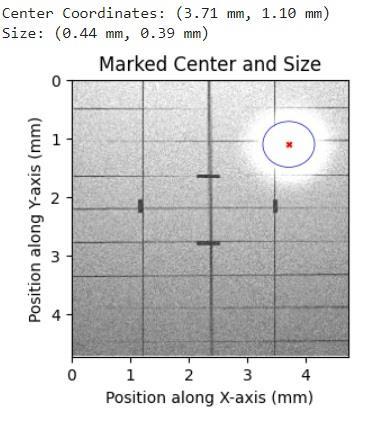
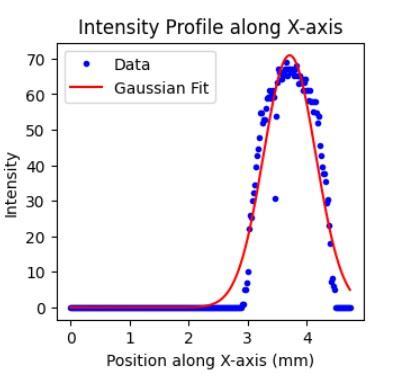
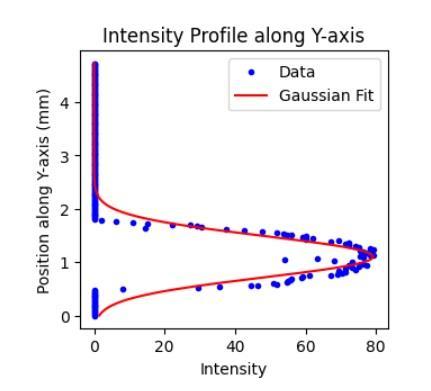
5. Gaussian Curve Fitting: Curve fitting using scipy.optimize.curve_fitwasdone.Intensityprofilesalongthe xandy-axeswerecomputed.Gaussiancurveswerefittedto theseprofilestoestimatetheblob'scentercoordinatesand size.[10]
Python libraries used were OpenCV, Numpy, SciPy, Matplotlib.
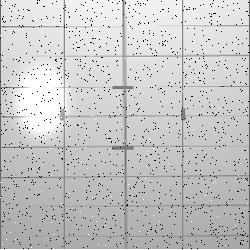
Thesameprocesswasappliedtomultiplenumberofimages. Thoughthenumberincreasedbuttheimageswereofsimilar type.Inordertoincreasethevarietyandavoidgenerating similar images, Gaussian noise as well as salt and pepper noisewasintroducedintheimagesasshowninFig4(b)and Fig.4(c)
However, there were two issues faced in determining the results. First, it was a tedious manual processing which consumedlotoftimeandsecondlythe resultssoobtained needed to be verified for the correctness. The results thus obtained were accurate for only few random images and inaccuratefortheremainingsetofimages.
Withtheuseofconventionalimageprocessingalgorithms, achievingdesiredresultsaccuratelyproveddifficult. Thus, shiftingtoamoresophisticatedapproachinvolvingmachine learning, specifically CNN was thought of. CNN is a
International Research Journal of Engineering and Technology (IRJET) e-ISSN: 2395-0056
Volume: 11 Issue: 05 | May 2024 www.irjet.net p-ISSN: 2395-0072
regularizedtypeoffeed-forwardneuralnetworkthatlearns feature engineering by itself via filters (or kernel) optimization [3]. Vanishing gradients and exploding gradients, seen during backpropagation in earlier neural networks,arepreventedbyusingregularizedweightsover fewer connections [3]. Recognizing CNNs' proficiency in learningspatialhierarchiesoffeaturesfromimages[4],we made a comprehensive dataset comprising synthetic Gaussianblobprofilesandcorrespondingparameters.
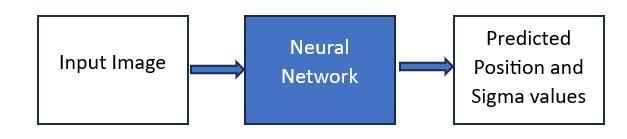
Toremovethelimitationofmanualcalculationoftheimage parameters viz. center point, σx and σy, a convolutional neuralnetworkwasdesigned.
ACNNmodelwasconstructedwitharchitectureasshownin Table 1. This net was constructed using the PyTorch [8] frameworkandaimsatpredictingGaussianparametersfrom synthetic images generated with known Gaussian distributions. The implementation involves several key librariesandfunctions.Firstly,OpenCV(cv2)wasutilizedfor imageprocessingtasks,whilenumpyservedfornumerical computations and manipulation. Python library matplotlib.pyplot [12] was used for data and interactions with the operating system were managed with os. Additionally, pandas [13] was employed for data manipulation and analysis, while the core deep learning functionalities were handled by torch and its submodules suchastorch.nnfordefiningneuralnetworkarchitectures and torch.utils.data for data handling. Furthermore, sklearn.model_selectionwasusedforsplittingthedatainto trainingandtestingsets.Weutilizednn.Sequentialmodule of PyTorch to construct the CNN layers, including convolutional layers, activation functions (ReLU), pooling layers(MaxPooling),andfullyconnectedlayers(Linear).We usedAdamoptimizertooptimizetheresults.
Table -1: Architectureof
Conv2-1 [-1,8,250,250] 80
ReLU-2 [-1,8,250,250] 0
MaxPool2d-3 [-1,8,125,125] 0
Conv2d-4 [-1,16,125,125] 1,168
ReLU-5 [-1,16,125,125] 0
MaxPool2d-6 [-1,16,62,62] 0
Flatten-7 [-1,61504] 0
Linear-8 [-1,256] 15,745,280
ReLU-9 [-1,256] 0
Linear-10 [-1,64] 16,448
ReLU-11 [-1,64] 0
Linear-12 [-1,4] 260
Theneuralnetworkwastrainedforadatasetof900images and test set of 100 images was taken. A loss function is a measureofhowaccuratelytheCNNmodelcanpredictthe expectedoutcome.Thecommonlossfunctions[5]areMean SquaredError(MSE)andMeanAbsoluteError(MAE).
TheMSEisgivenby[6]:

WhereNisnumberofsamplesandYandY^areactualand predictedvalues.Itmeasuresthevarianceofsamples. The MAE is the average of absolute difference between actualandpredictedvaluesofsampleandisgivenby:[6]

WhereNisnumberofsamplesandYandY^areactualand predictedvalues.
TheRootMeanSquarederrorgivesthestandarddeviationof thedifferenceofactualandpredictedvalues[6]. Itisgivenby:

Thefollowingtableshowstheerrorsobtainedbythemodel:
Table -2: Resultsofthemodel
International Research Journal of Engineering and Technology (IRJET) e-ISSN: 2395-0056
Volume: 11 Issue: 05 | May 2024 www.irjet.net p-ISSN: 2395-0072
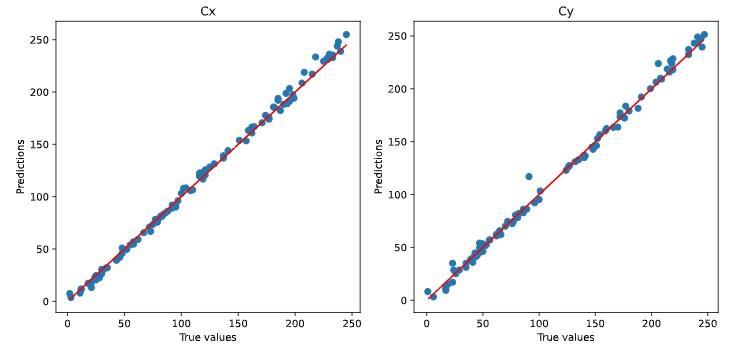
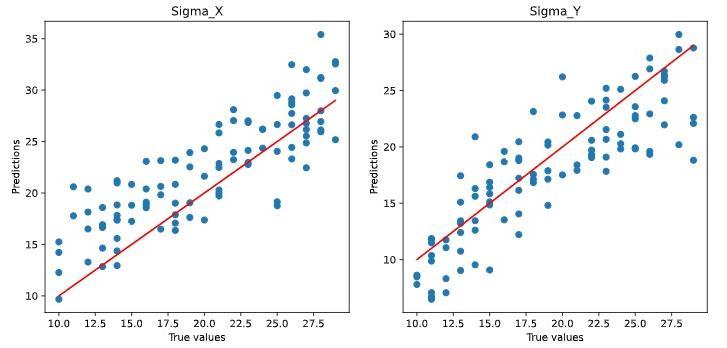
Fig -6:Scatterplotofactualandpredictedvaluesofcenter positionandspreadoftheblob
Themodelperformanceneedstobeimproved.Thiscanbe done by using a bigger data set. In addition, the network layersneedtobeoptimizedbychangingthearchitectureof theneuralnetwork.Alternativeoptimizerscanbetriedout. Pre-trainedmodelscanbeusedformoreaccurateresults The model can then be tested in real time to verify the results.
[1] F. M. Dickey and S. C. Holswade, Laser Beam Shaping: Theory and Techniques, Marcel Dekker, New York (2000).
[2] "GLADopticalsoftwarecommandsmanual,Entryon GAUSSIANcommand"(PDF).AppliedOpticsResearch. 2016-12-15.
[3] Venkatesan, Ragav; Li, Baoxin (2017-10-23). ConvolutionalNeuralNetworksinVisualComputing:A Concise Guide. CRC Press. ISBN 978-1-351-65032-8. Archived from the original on 2023-10-16. Retrieved 2020-12-13.
[4] JonathanJanke,MauroCastelli,AlešPopovič,Analysisof theproficiencyoffullyconnectedneuralnetworksinthe process of classifying digital images. Benchmark of different classification algorithms on high-level image featuresfromconvolutionallayers,ExpertSystemswith Applications, Volume 135, 2019, Pages 12-38, ISSN 0957-4174,
[5] J. Qi, J. Du, S. M. Siniscalchi, X. Ma and C. -H. Lee, "On Mean Absolute Error for Deep Neural Network Based Vector-to-VectorRegression,"inIEEESignalProcessing
Letters, vol. 27, pp. 1485-1489, 2020, doi: 10.1109/LSP.2020.3016837.
[6] ChiccoD,WarrensMJ,JurmanG.2021.Thecoefficientof determination R-squared is more informative than SMAPE, MAE, MAPE, MSE and RMSE in regression analysis evaluation. PeerJ Computer Science 7:e623 https://doi.org/10.7717/peerj-cs.623 https://medium.com/analytics-vidhya
[7] Python Software Foundation. Python Language Reference, version 2.7. Available athttp://www.python.org
[8] https://pytorch.org/
[9] https://opencv.org/
[10] https://scipy.org/
[11] G.R.VidhyaandH.Ramesh,"Effectivenessofcontrast limited adaptive histogram equalization technique on multispectral satellite imagery", Proc. Int. Conf. Video ImageProcess.,pp.234-239,Dec.2017.
[12] https://matplotlib.org/
[13] https://pandas.pydata.org/
[14] https://numpy.org/
2024, IRJET | Impact Factor value: 8.226 | ISO 9001:2008