
International Research Journal of Engineering and Technology (IRJET) e-ISSN:2395-0056
Volume: 11 Issue: 05 | May 2024 www.irjet.net p-ISSN:2395-0072
International Research Journal of Engineering and Technology (IRJET) e-ISSN:2395-0056
Volume: 11 Issue: 05 | May 2024 www.irjet.net p-ISSN:2395-0072
Yashraj Mishra1, Ankita Jaiswal2 , Dr. Goldi Soni 3
1Student , Amity University Chhattisgarh
2Student , Amity University Chhattisgarh
3Assistant Professor, Amity University Chhattisgarh
Abstract- Healthcare establishments all over the world need to handle their medical inventories effectively. Patient care may suffer because of overstocking, stockouts, and higher expenses brought on by inaccurate medication demand predictions. This research proposes an advanced machine learning model-based data-driven approach for medical inventory management optimization The suggested solution seeks to decrease bounce rates by 30%, increase customer happiness, decrease wasteful inventory costs, and improve product availability. The solution's effectiveness is shown by outcome analysis, where the Gradient Boost model performs better than the others. This method has a very low MAPE (Mean Absolute Percentage Error) score (less than 5 percent). Hospital scan work together and embrace best practices more readily because of the solution's scalability, utility, and capacity to be used across several facilities and specialties. The initiative seeks to offer insightful information on supplier selection for higher operational performance, better customer service, and cost efficiency. In this project there are two methodologies used: Python programming libraries and Structured Query Language programming which isusedfor data preprocessing.
Keywords: Python Programming, SQL (Structured Query Language), Exploratory Data Analysis, Machine Learning, Data Preprocessing, Data Visualization, Transportation Cost Reduction
1.Introduction
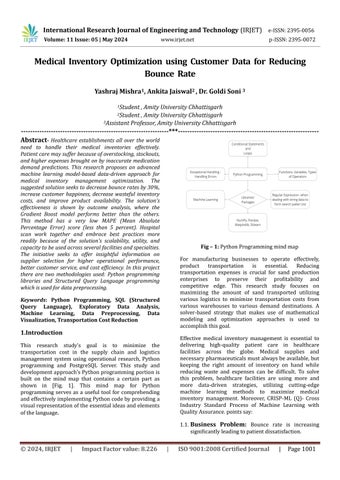
This research study's goal is to minimize the transportation cost in the supply chain and logistics management system using operational research, Python programming and PostgreSQL Server. This study and developmentapproach'sPythonprogrammingportionis built on the mind map that contains a certain part as shown in [Fig. 1]. This mind map for Python programming serves as a useful tool for comprehending andeffectivelyimplementingPythoncodebyprovidinga visualrepresentationoftheessentialideasandelements ofthelanguage.
For manufacturing businesses to operate effectively, product transportation is essential. Reducing transportation expenses is crucial for sand production enterprises to preserve their profitability and competitive edge. This research study focuses on maximizing the amount of sand transported utilizing various logistics to minimize transportation costs from various warehouses to various demand destinations. A solver-based strategy that makes use of mathematical modeling and optimization approaches is used to accomplishthisgoal.
Effective medical inventory management is essential to delivering high-quality patient care in healthcare facilities across the globe. Medical supplies and necessarypharmaceuticalsmustalwaysbeavailable,but keeping the right amount of inventory on hand while reducing waste and expenses can be difficult. To solve this problem, healthcare facilities are using more and more data-driven strategies, utilizing cutting-edge machine learning methods to maximize medical inventory management. Moreover, CRISP-ML (Q)- Cross Industry Standard Process of Machine Learning with QualityAssurance.pointssay:
1.1. Business Problem: Bounce rate is increasing significantlyleadingtopatientdissatisfaction.
Volume: 11 Issue: 05 | May 2024 www.irjet.net
1.2.Business Objective: MinimizeBounceRate
1.3.Business Constraint: MinimizeInventoryCost
1.4. Business Success Criteria: Reduce bounce rate byatleast30%.
1.5.Economic Success Criteria: Increase revenue by atleast20lacINRbyreducingbouncerate
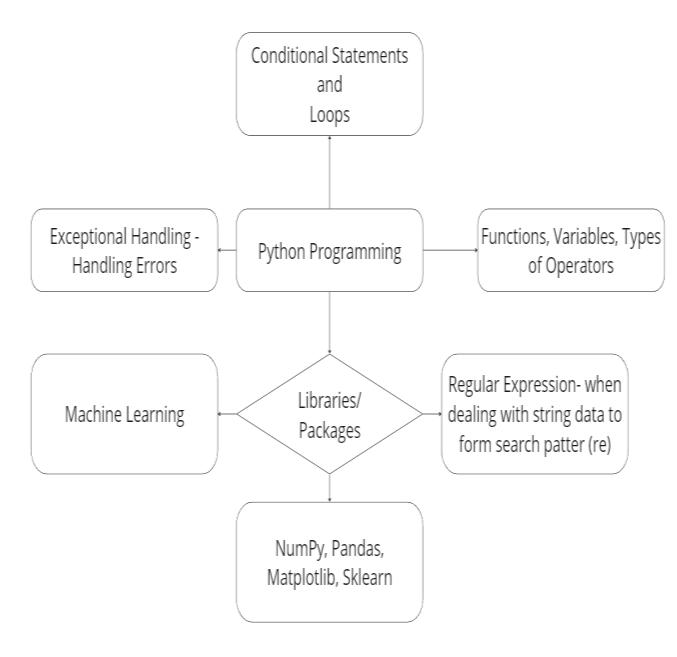
In [Fig. 2] is an architecture that defines workflow of methodologies.
2.1. Data Source and Collection:
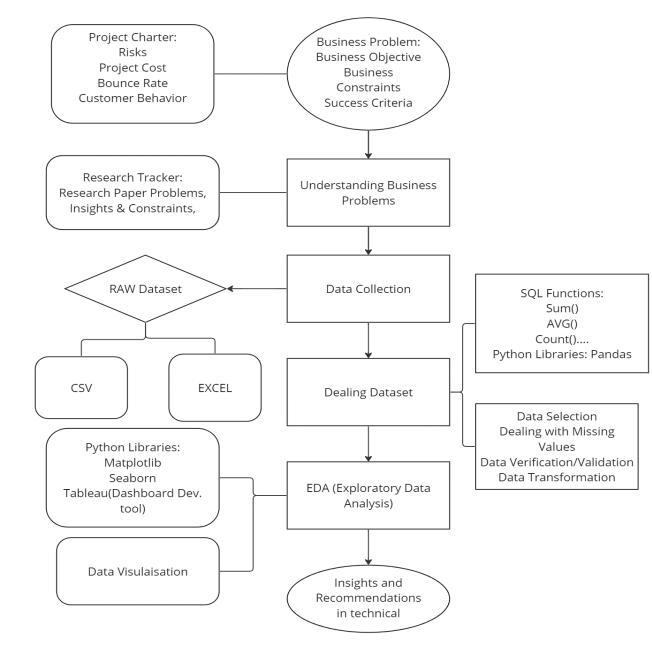
Dataset is collected as well as extracted from the different sources and Client {leading Pharma} provided the dataset. Now, this dataset contains (df.shape) 14218 rowsand14columns.
Using pre-existing data that has been gathered by other researchers, organizations, or sources is known as secondarydatacollecting.Thismethodworkswellwhen gathering primary data is impractical or when researchers want to supplement their conclusions with more data. A popular technique for obtaining secondary dataistodoaliteraturereview,whichislookingthrough books, articles, and other publications to compile pertinent material and pinpoint areas that still need research.
Official statistics, which are generated and disseminated by governments and organizations, are useful tools for academics to examine trends and patterns. Examples of thesestatisticsincludecensusdata,economicindicators, andhealthstatistics
There are in total 14 columns defining types of sales, patientID,SpecializationofDoctors,Department,Dateof Bill, Quantity, Return Quantity, what is Final Cost and FinalSalesofDrugs,MRPofreturnedDrug,Formulations and Subcategories. Now, the following table [Table 1] shows the detailed variable name and variable description.
Variable Name
Variable Description
Typeofsales Type of sale of the drug. Either the drug issoldorreturned.
Patient_ID IDofapatient
Specialisation NameofSpecialisation(eg.Cardiology) Dept Pharmacy, the formulation is related with.
Dateofbill Dateofpurchaseofmedicine
Quantity Quantityofthedrug
ReturnQuantity Quantity of drug returned by patient to thepharmacy
Final_Cost Final Cost of the drug (Quantity included)
Final_Sales Finalsalesofdrug
RtnMRP MRP of returned drug (Quantity included)
Formulation Typeofformulation
DrugName Genericnameofthedrug
SubCat Subcategory (Type) to the category of drugs.
SubCat1 Subcategory (condition) to the category ofdrugs
Following[Fig.3]Afterpreprocessingdatasetwegetthe following information like non-null values, Count and Datatype.
Volume: 11 Issue: 05 | May 2024 www.irjet.net
2.4. Data Preprocessing:
In data processing this research paper uses two strategies: Python Preprocessing as well as Structured QueryLanguage(PostgreSQL)preprocessing.
Data Cleaning:
Data cleaning steps include dealing with missing values, handlingduplicatedata,andfinallyremovingoutliers.
The significance of missing values data in its row and unrefined form often presents a challenge that every data scientist must face a missing value. Missing values can occur for various reasons errors in data collection, system failure, survey nonresponses and more ignoring them is not option they can introduce bias distort correlation and impact the performance of overall machine learning models. There are in total 3 steps to deal with missing values see first, deletion of rows and deletion of the columns, second, is the method of imputation, it involves estimating missing values based on existing data. Techniques included mean, median, mode imputations and more advanced method like regression imputations and third, advanced imputation techniques, used for more sophisticated imputation consider method like K nearest neighbor where missing values are predicted based on their proximity to similar instances for time series data technique like forward fill or backward fill imputation can be effective. Dealing duplicate data is like a distorted mirror reflecting false pattern it can artificially inflate the bottoms of certain featuresleadingtomist model training duplicate entries can also slow down computation and result in an inefficientallocationofresources.
Outliersholdthepowertodistortstatisticalanalysisand machine learning models leading to inaccurate prediction and biased results. Outliers are data points significantly derivate from normalization. They can unusually high or low values that don’t align with overallpatternofthedataset.Outlierscanstemfrom various sources including measurement errors, data entry mistakes or genuine rare events, there are three basicmethodstoremoveoutliersfirst,isZscoreandthe second, is inter-quartile range and third, is outlier removal using percentile method. Following [Fig. 4] shows the inter-quartile range that this research paper hasused:
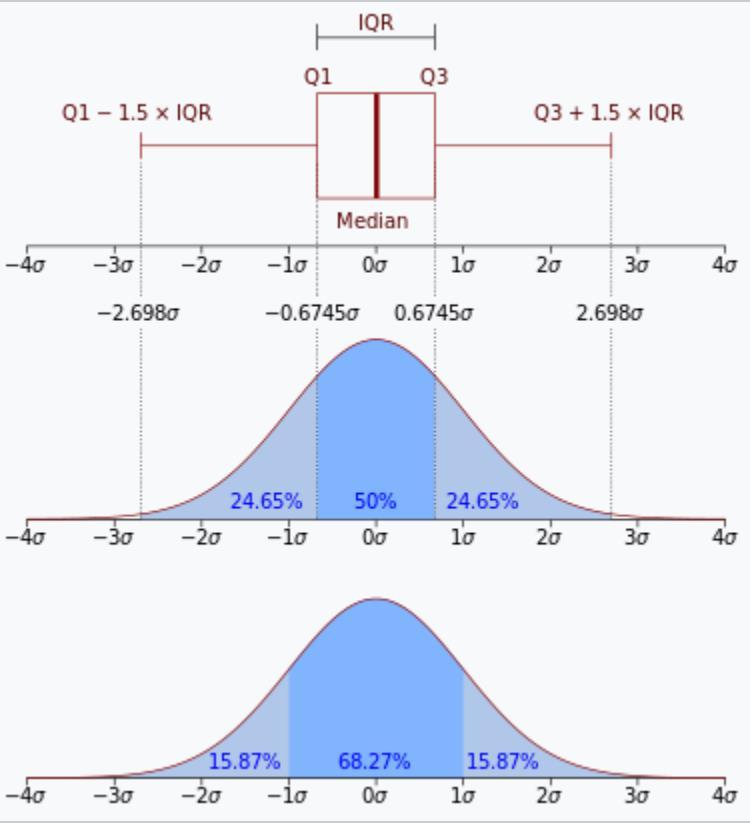
Fig – 4 :BoxPlot+InterquartileRange,Source Wikipedia
Beyondthisapproachesthereisonemoreapproach:2.5.
One effective optimization technique that's frequently employedinoperationsresearchistheSolvermethod.To solve difficult problems, it makes use of mathematical models and algorithms. The transportation problem in this research study will be solved using the Solver approachbyexpressingitasaLinearProgramming(LP) orMixed-IntegerLinearProgramming(MILP)model.
Theprocessflowin[Fig 5]entailsdeterminingtheissue, developing, and putting into practice a model, assessing its efficacy, reviewing test findings, and then putting the solutiontodealwiththeidentifiedproblemintopractice.
International Research Journal of Engineering and Technology (IRJET) e-ISSN:2395-0056
Volume: 11 Issue: 05 | May 2024 www.irjet.net p-ISSN:2395-0072
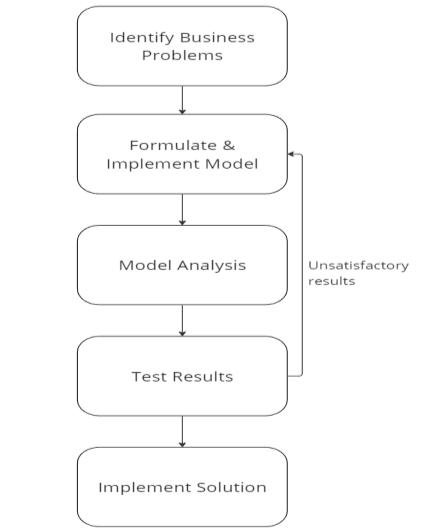
- 5 : Visualmodelofproblem-solvingmethod.
Model Formulation:
Creating the model is the first stage in the Solver process. This entails putting the transportation problem into a mathematical model. The goal of the transportation problem is to minimize transportation costs by figuring out the best way to distribute items from various warehouses (sources) to various destinations (demand points). The model will consider variables like each warehouse's capacity, the demand at each site, and the expenses of each route's transportation. In this instance, a sand production company's goal is to reduce its overalltransportationexpenses.
Decision Variables:
Determinethevariablesthatneedtobeascertained, oftenknownasdecisionvariables,andexpressthem using algebraic symbols. Now let's define the transportation model's decision variables. Assume thatthereare‘n’demandpointsand‘m’warehouses. X (i, j) is a matrix of choice variables that we can make,with‘i’standsforthewarehouseand‘j’forthe demand point. The amount of sand moved from warehouse ‘i’ to destination ‘j’ is represented by the decisionvariableX(i,j).
Objective Function:
The problem's objective can be mathematically represented in terms of decision variables. The model's goal is to reduce the overall cost of transportation.
The total of the transportation expenses for each pair of warehouses and demand locations can be usedtocreatetheobjectivefunction [2].
Minimize Z = C (i, j) * X (i, j)
Here, C (і, j) represents the transportation cost per unit of medical supplies from warehouse i to destination j and X (і, j) represents the quantity of sandtransportedfromwarehouseіtodestinationj.
Constraints:
Constraints built into the model will guarantee that the total amount of sand supplied from each warehousedoesnotbeyonditscapacityandthatthe entire demand at each destination is satisfied. Nonnegativity restrictions on the decision variables are anothertypeofconstraintthatmayexist.Duetothe constraints,itclearswhatwillbesectionwehaveto focusindataanalysis.
3. Code Processing Observation Analysis:
AfterEDA(Amethodforexaminingandcondensingdata collections is called exploratory data analysis, or EDA. Prior to statistical modeling or machine learning, this is animportantstage.).Therearefollowingobservation:
3.1. Four Business Moment Decision:
There are three business moment decisions, here in the research paper to find out the outliers and other visualizationsfocusedonco-relationmatrix.
FIRST MOMENT BUSINESS DECISION: Includes MeasureofcentralTendency(Mean,Median,Mode),
SECOND MOMENT BUSINESS DECISION: Includes Variance,StandardDeviation,Range,
THIRD BUSINESS DECISION: Includes Skewness, and
FOURTH MOMENT BUSINESS DECISION: Includes Kurtosis.
Following [Table 2] and [Table 3] contains the fourbusiness moment decision result before processing and afterpre-processingrespectively.
Column
International Research Journal of Engineering and Technology (IRJET) e
Volume: 11 Issue: 05 | May 2024 www.irjet.net
Table – 2 : BeforeRemovingOutliersFourMomentBusinessDecision:ReadingsUnprocessedData
-0056
Column
Table – 3 : RemovingOutliersFourMomentBusinessDecision:ReadingsProcessedData
From Table 2 and Table 3, the result indicates that the unclean data exhibits higher mean variance standard deviation,rangeskewnessandkurtosisvaluescompared to the clean data. Cleaning this data set has resulted in more stable and normalized distribution with reduced variability and potential basis and statistically best makingitmorereliableforbusinessmakingdecisions.

After removing outliers from uncleaned/ unprocessed data the graph of numerical columns willbe:
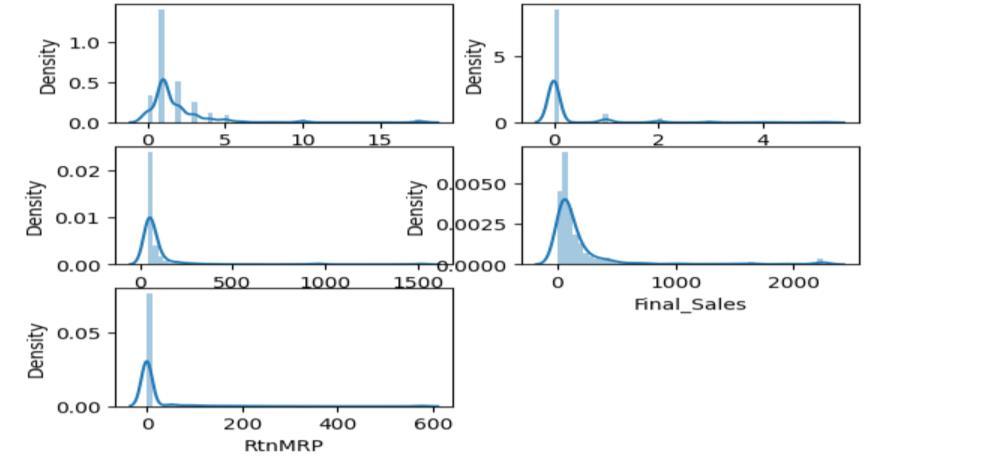

Fig - 6 : Columnsgraphwithremovedoutliers
Volume: 11 Issue: 05 | May 2024 www.irjet.net p-ISSN:2395-0072
Hereabovegraph[Fig.6],statesthat,howthenumerical column behaves after the removal of outliers, for the testing purpose all the values are plotted in the inter quartilerange(IQR)whichistherangebetweenthefirst quartile i.e. 25th percentile and the third quartile i.e. 75thpercentile[11].Datapointsoutsideacertainrangeof theIQRareconsideredasoutliers. So,theabovetableof four momentum graphs can be followed by outlier removal process. This graph was generated by seaborn and matplotlib plotting process using distplot and subplot functions. There are still outliers in some of the numerical columns because they are mostly treated as
the highest value which is important for data wrangling/exploring.
3.2.
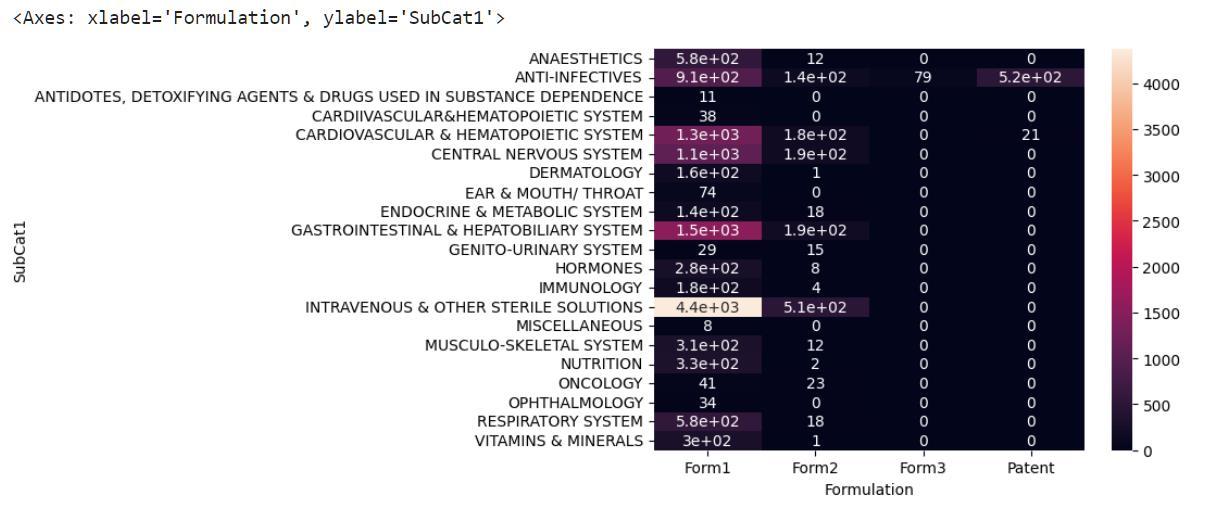
Plotting of the two important categorical data formulationandsubcat1(subcategory1)ofthetotal outcomes using Heatmap (a picture or chart that shows the variations in temperature or infrared radiation that were observed over a certain area or over a certain amount of time). Following [Fig. 7] showstheHeatmap,
Plotting two correlated (df.corr()) numerical data, Final_Sales and Final_Cost based on the Patient ID. Following visuals [Fig. 8] shows the numerical insightsusingscatterplots:-
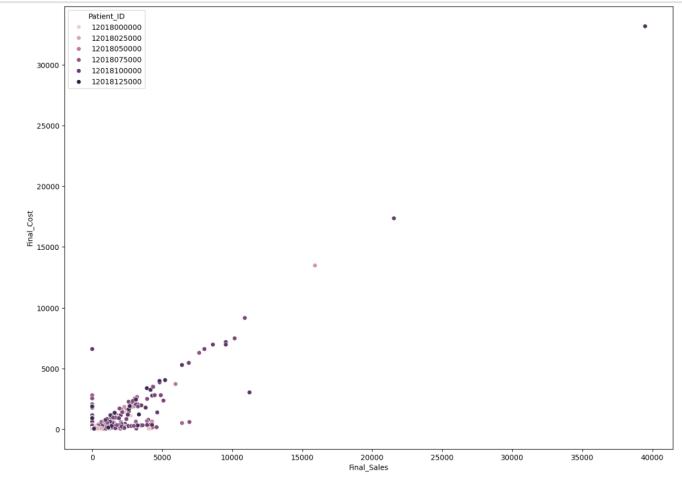
Fig – 8 : NumericalInsights(Final_Cost,Final_Sales basedonPatientID).
Let’splottheMostSubcategoryItemthatwasvisited by patients using pie plots, this visual [Fig. 9] includes the overall bounce rate that patient wants the drugs but due to unoptimized inventory they refuse to buy. As you can see from the visuals ‘INJECTIONS’ were highly wanted items by patients with57.45%.
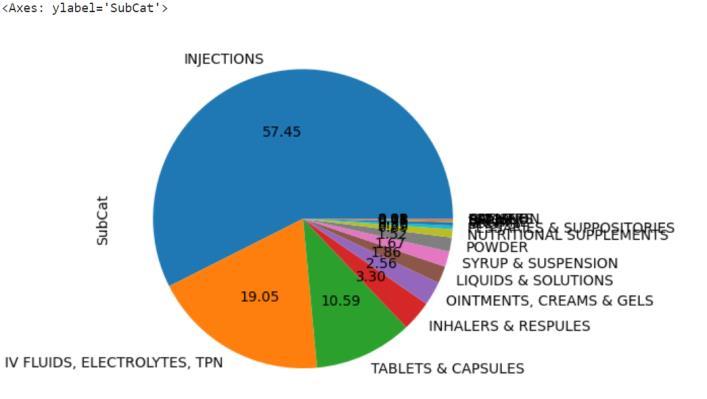
Fig – 9: NumericalInsights(Final_Cost,Final_Sales basedonPatientID)
International Research Journal of Engineering and Technology (IRJET) e-ISSN:2395-0056
Volume: 11 Issue: 05 | May 2024 www.irjet.net p-ISSN:2395-0072
Let’snowseeanotherconstrainti.e.‘Formulation’,In particularresearchwefoundthat‘Form1’showsthe highest type with 86.3%. The following visual [Fig 10]showstheFormulationchart.
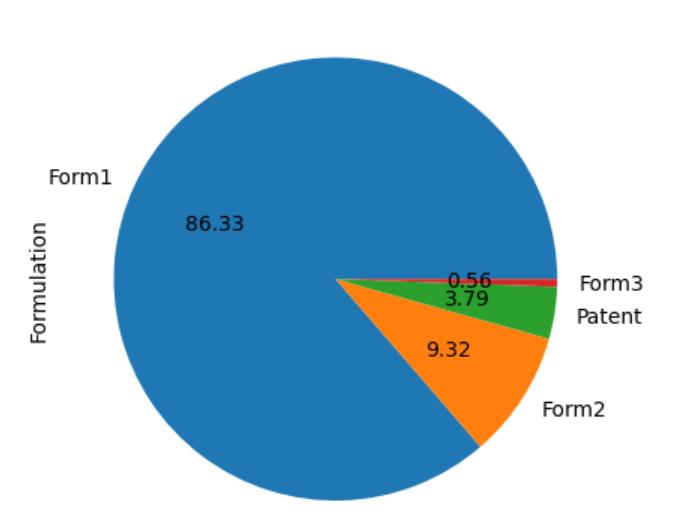
Fig – 10 : FormulationChartAnalysis
Also, we need to plot a pie chart for the most requested Department. In the department research shows[Fig 11]‘Department1’maximumof87.49%.
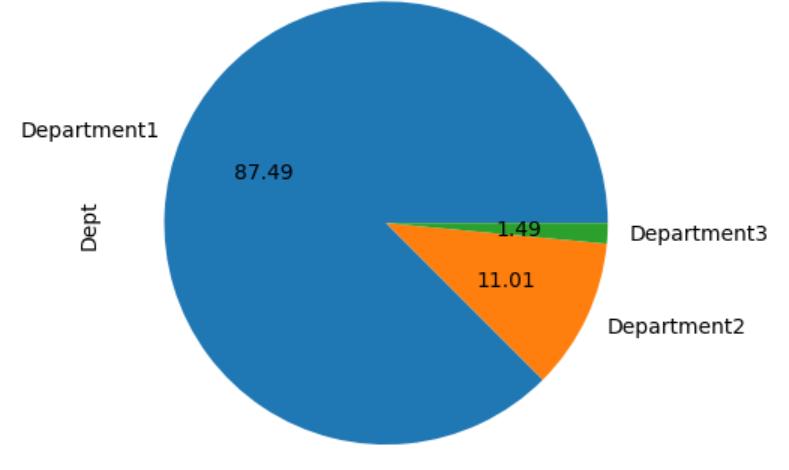
Fig – 11: DepartmentChartAnalysis.
WhenfocusingontheTypeofSalestherearearound 2000productsthatarereturned.
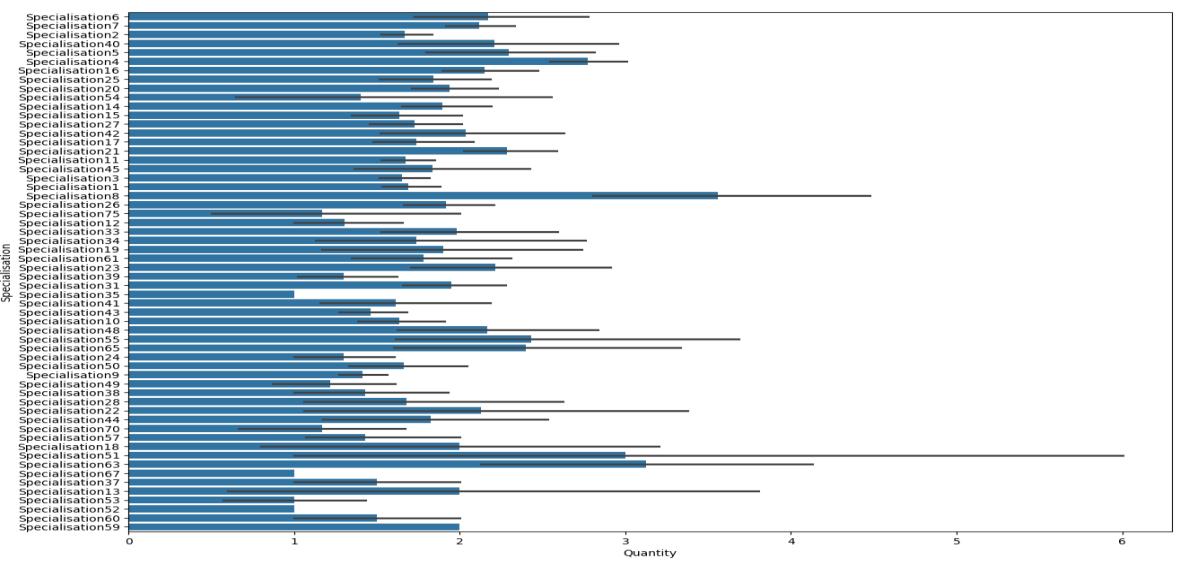
Now, the most important plot is Numerical Categorical Plot Analysis: In the following research weinclude four plots wheredifferentspecializationiscomparedtoamountofQuantity,ReturnQuantity,FinalSalesandReturnMRP.Inthe followingvisuals[Fig 12,13,13,15]showsthenumerical-categoricalplots.
International Research Journal of Engineering and Technology (IRJET) e-ISSN:2395-0056
Volume: 11 Issue: 05 | May 2024 www.irjet.net p-ISSN:2395-0072
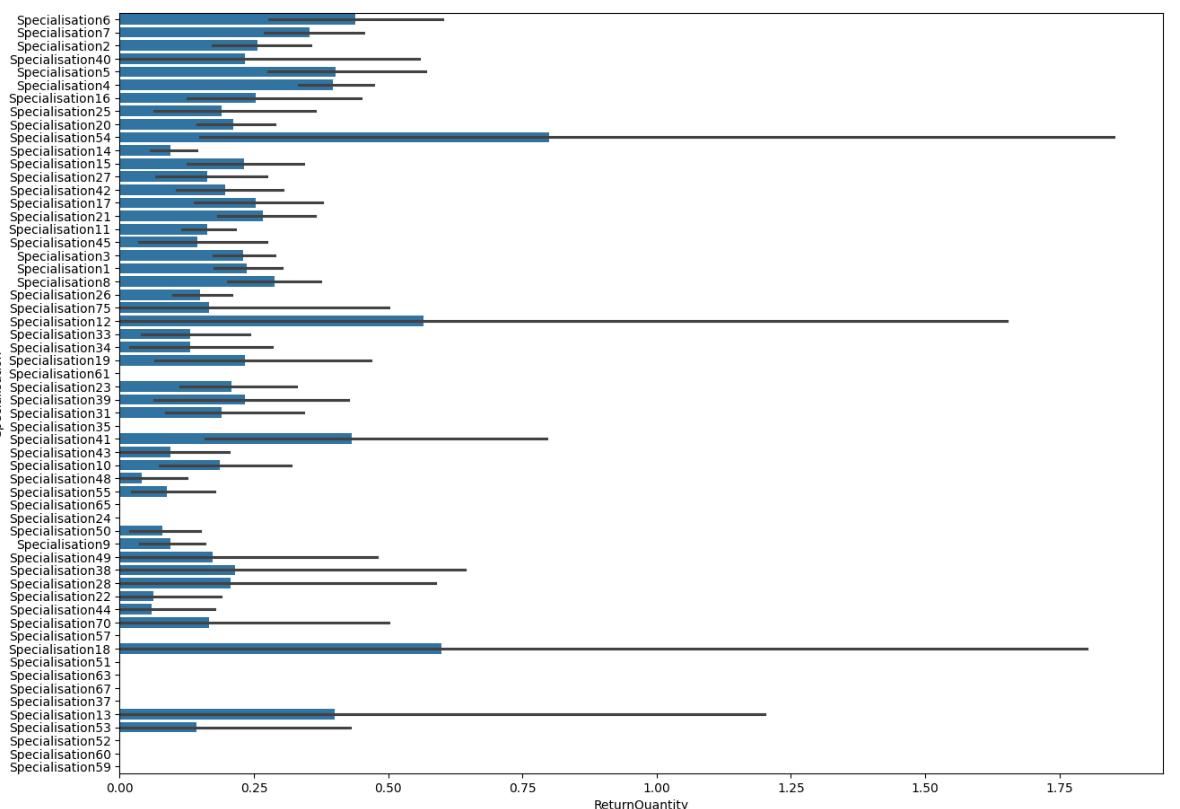
Fig – 13 : SpecializationvsReturnQunatity.
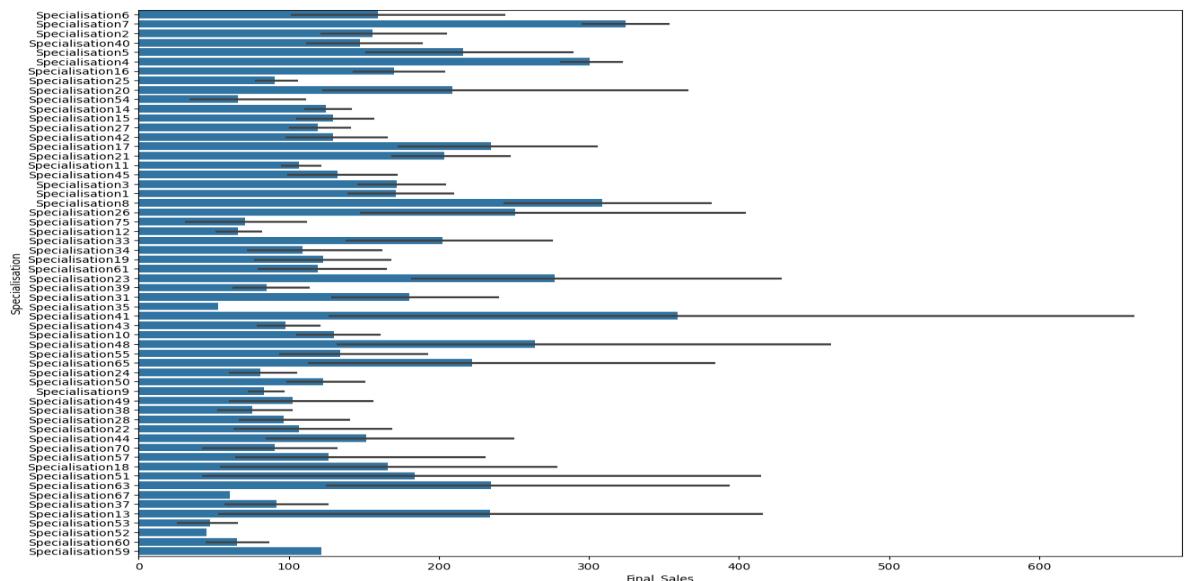
Fig - 14 : SpecializationvsFinalSales.
Volume: 11 Issue: 05 | May 2024 www.irjet.net p-ISSN:2395-0072
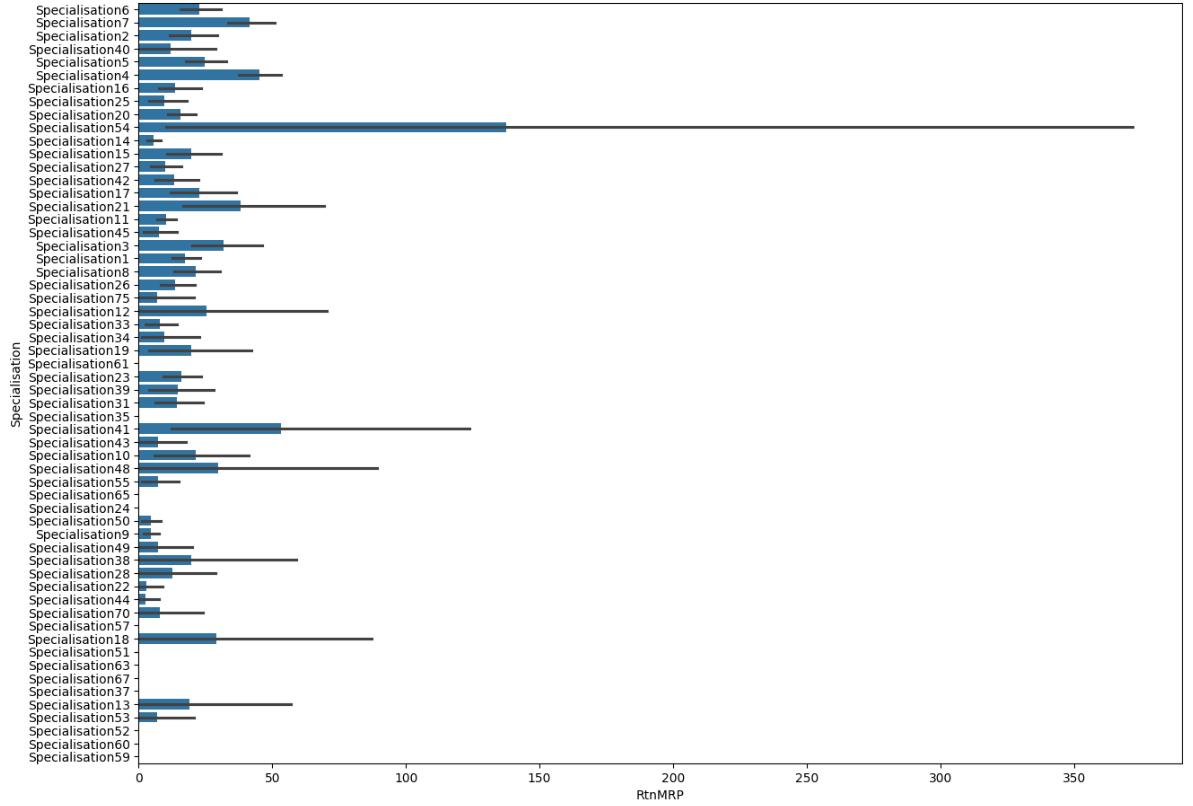
Fig – 15 : SpecializationvsRtnMRP. Similarly,usingPostgreSQLusingdifferentfunctionslikeSUM(),AVG(),COUNT(),etc.Also,canprocessdatasets
4.
I. The future scope of medical inventory optimization and bounce rate is to leverage data-driven approaches and advanced machine learning techniques to forecast drug demand, optimize inventory levels, and reduce waste and costs. Some ofthe benefits ofthisapproachare:
• Minimize drug shortages and stockouts, which can lead to improved patient care and satisfaction, as wellasreducedbouncerate.
• Maximize the availability and utilization of drugs, which can increase sales and profits, as well as customerloyaltyandretention.
• Reduce inventory costs and waste, which can improve cash flow and sustainability, as well as reduce the environmental impact of expired or unuseddrugs.
Unprocessed data shows the noise in all fourmoment business decision like mean, standard deviation,variance,range,skewness,andkurtosis.
Specialisation4 and Specialisation7 with Department1 have a higher number of returns of FORM1{Formulation}.
Specialisation54 contains highest RtnMRP : MRP of returneddrug(Quantityincluded)aswellasHighest ReturnQuantity
Specialisation41 contains highest Final_Cost and Final_Sales
Specialisation8 contains highest Quantity Similarly aftergothroughingallpossiblecombination.
Cleaning the data led to more stable distributions, essentialforaccuratedecision-making.
Specific subcategories like "INJECTIONS" and "TABLETS & CAPSULES" and the "Form1" formulation were identified as having high return counts.
Seasonal trends in hospital operations, with varying revenue and demand across different months, were noted.
Herewecanunderstandthataround30pluspercent (approx.30.548%)ofcustomerinthedatasetbased on a situation where they returned medicine with a final_salesvalueofzerothismeansthatasignificant portion of our customer did not get the medicine they needed which could lead to dissatisfaction of a customer so to improve business criteria we can increase our revenue and it’s important to reduce the bounce rate by ensuring customer service at is best. International Research Journal of
International Research Journal of Engineering and Technology (IRJET) e-ISSN:2395-0056 Volume: 11 Issue: 05 | May 2024 www.irjet.net p-ISSN:2395-0072
5. Recommendations:
After analysing whole research, in recommendations section,therearesomeimprovementsindataset,
Thorough examination of the "TABLETS & CAPSULES" and "INJECTIONS" subcategories to pinpoint and solve the root causes of high return rates.
Athoroughevaluationofthe"Form1"formulationto pinpoint areas in need of modification or replacement.
Assessmentand potentially revaluation of suppliers, particularlyforproductsrelatedtoDepartment1and "Form1"formulation.
To maximize stock levels and prevent returns, Department1enhancedinventorycontrol.
Development of efficient return management practicesinDepartment1.
Implementation of specialisation-specific strategies, particularlyinSpecialisation4andSpecialisation7,to addresshigherreturnrates.
Seasonal resources should be deliberately allocated to maximize operations and resource usage during peakandoff-peakseasons.
6. Conclusion:
Keypointsaftertheresearch:
The initiative is designed with specific recommendations that, when implemented, target keyareasofconcern.
By focusing on these identified problem areas, the primary goal is to address and mitigate issues effectively.
A significant reduction in the bounce rate is one of thecoreobjectivesofthisinitiative.
Lowering the bounce rate is crucial as it reflects directlyonthehospital’sabilitytoretainitspatients.
Increasingcustomersatisfactionisanothervitalgoal oftheinitiative.
Improved customer satisfaction will enhance the patientexperience,contributingtobetterhealthcare outcomes.
Byensuringhigherlevelsofsatisfaction,thehospital expectstoseeapositiveimpactonpatientloyalty.
Enhanced overall performance of the hospital is a direct consequence of successfully implementing thesechanges.
Improved performance will also contribute to the hospital'sfinancialhealth,increasingitsrevenue.
Thus,thisinitiativeaimstoholisticallyimproveboth the qualitative and quantitative metrics of the hospital’soperations.
References:
[1]. Khan,Muztoba.(2014). Transportation Cost Optimization Using Linear Programming. International Conference on Mechanical, Industrial and Energy Engineering 2014 26-27 December 2014, Khulna, BANGLADESH.ICMIEE-PI-140224.
[2]. Vamsikrishna, A. & Raj, Vigneshwar& Sharma S G, Divya. (2021). Cost Optimization for Transportation Using Linear Programming. https://doi.org/10.1007/978-981-16-0976-3_2.
[3]. Uzorh, Engr &Nnanna, Innocent. (2014). Supply ChainManagementOptimizationProblem. https://doi.org/10.13140/RG.2.2.19682.58566.
[4].Oba,Kenneth&Abere,Abiye.(2023).Optimizationof ShippingCostof Sandfor Selected Construction Projects ofJuliusBerger.12.16-20.
https://doi.org/10.5923/j.ijcem.20231201.02.
[5].Çerkini,Bashkim&Bajrami,Roberta&Kosova,Robert & Shehu, Valentina. (2015). Transportation Cost Optimization. Academic Journal of Interdisciplinary Studies.https://doi.org/10.5901/ajis.2015.v4n2s1p42
[6]. Qi, Chenyang & Ren, Jiaying & Su, Jin. (2023). GRU Neural Network Based on CEEMDAN–Wavelet for Stock Price Prediction. Applied Sciences. 13. 7104. https://doi.org/10.3390/app13127104.
[7]. Alkiayat, Mohammad. (2021). A Practical Guide to Creating a Pareto Chart as a Quality Improvement Tool. Global Journal on Quality and Safety in Healthcare. 4. https://doi.org/10.36401/JQSH-21-X1.
[8]. Basha, Mir Mohammed Junaid & V.S, Navya & Wani, Sonali & Gogi, Vivekanand. (2020). Study of Inventory Management in Pharmaceuticals: A Review of COVID-19 Situation.InternationalJournalofInnovativeScienceand Research Technology. 5. 366-371. https://doi.org/10.38124/IJISRT20AUG257.
[9]. Bhojwani, Divya & Bhojwani, Khushboo. (2019). A study to review drug inventory and pharmacy management with reference to I.V. & injectables at a tertiary municipal care hospital with 1800 bedded hospital.342-350.
[10]. Binsar, Faisal. (2020). Drug Stock Optimization Based on Consumption Patterns for Hospital Formulary Using Deep Learning Approach. International Journal of Advanced Trends in Computer Science and Engineering. 9. 2689-2697. https://doi.org/10.30534/ijatcse/2020/31932020.
[11]. Tuga, Mauritsius. (2019). Bank Marketing Data Mining using CRISP-DM Approach. International Journal of Advanced Trends in Computer Science and Engineering. 8. 2322-2329. https://doi.org/10.30534/ijatcse/2019/71852019..
[12]. Mariscal, Gonzalo & Marban, Oscar & Fernandez, Covadonga. (2010). A survey of data mining and knowledgediscoveryprocessmodelsandmethodologies. Knowledge Eng. Review. 25. 137-166. https://doi.org/10.1017/S0269888910000032.
[13].Zolnoori,Maryam&Fung,Kin&Patrick,Timothy& Fontelo, Paul & Kharrazi, Hadi & Faiola, Anthony & Wu, Shirley&Eldredge,Christina&Luo,Jake&Conway,Mike &Zhu,Jiaxi&Park,Soo&Xu,Kelly&Moayyed,Hamideh. (2019). The PsyTAR Dataset: From Patients Generated Narratives to a Corpus of Adverse Drug Events and Effectiveness of Psychiatric Medications. Data in Brief. 24.103838.https://doi.org/10.1016/j.dib.2019.103838.
[14]. Panigrahi, Chhabi & Panda, Bijayalaxmi & Pati, Bibudhendu. (2022). Exploratory Data Analysis and Sentiment Analysis of Drug Reviews. Computacion y Sistemas.26.https://doi.org/10.13053/cys-26-3-4093
[15]. Vibin Ravi Kumar, Pallavi Waghmare, Sampath Bukya, Bharani Kumar Depuru, Dr. Ilankumaran Kaliamoorthy, Forecasting Drug Demand for Optimal Medical Inventory Memangement: A Data Driven Approach with Advanced Machine Learning Techniques. ISSN No.: - 2456-2165. https://ijisrt.com/assets/upload/files/IJISRT23SEP159. pdf
[16]. Shreya.S, Ankita Yadav, Aivarajan S.N, Bharani Kumar Depuru, Efficient Transportation Cost Minimization Strategies in Supply Chain Management: A Comprehensive Analysis and Optimization Framework by using Solver Methodology & Python Programming. ISSN No.:- 2456-2165. https://www.ijisrt.com/assets/upload/files/IJISRT23AU G1773.pdf. International Research Journal of Engineering and Technology (IRJET) e-ISSN:2395-0056
Volume: 11 Issue: 05 | May 2024 www.irjet.net p-ISSN:2395-0072