
International Research Journal of Engineering and Technology (IRJET) e-ISSN: 2395-0056
Volume: 11 Issue: 05 | May 2024 www.irjet.net p-ISSN: 2395-0072
International Research Journal of Engineering and Technology (IRJET) e-ISSN: 2395-0056
Volume: 11 Issue: 05 | May 2024 www.irjet.net p-ISSN: 2395-0072
Md Fariduddin Rafique1 , Varun Joshi2
1University School of Environment Management, Guru Gobind Singh Indraprastha University, New Delhi, India
2 University School of Environment Management, Guru Gobind Singh Indraprastha University, New Delhi, India.
Abstract - The Indian Himalayan Region (IHR), due to its topography, geography, and active tectonics, a rough mountain zone, is among the most vulnerable zones to the landslipdanger.Themostcutting-edgeandaccuratewaysfor creating a landslip susceptibility model (LSM) are advanced statisticaltechniques.Thegoalofthecurrentworkwastouse advanced statistical techniques to analyze and evaluate the updated landslip susceptibility for East District in the NE Himalayas of Sikkim, India. The spatiotemporal landslip inventory forthe yearsareproduced using literature surveys, historical satellite imageries and on-site observations. Slope, aspect, elevation, curvature, plane curvature, profile curvature, topographic wetness index (TWI), lithology, distance to faults, distance to streams, distance to roads, normalized difference vegetation index (NDVI), rainfall, drainagedensityandlanduse/landcover(LULC)aresomeof thetopographic,environmental,geologic,andanthropogenic factorsthatwereincludedinthespatialdatabase.TheseLCFs werechosentostudythearea'speriodiclandslipvulnerability. An inventory of 151 landslides from historical published records, fieldvisits andImagery interpretations, respectively, were used in the experimental design. Information Value Model (IVM), was used to evaluate the vulnerability to landslidesasdeterminedbyfifteenLCFs.Thegoalofthestudy is to help in reducing the number of fatalities and possible economic harm caused by the region's frequent slope instabilities. It is expected that the application of statistical algorithms would assist relevant authorities and organizations in properly planning for and managing the region's landslip threat.
Key Words: East Sikkim, Landslide susceptibility, InformationValueModel
1.Introduction
Themostsignificantgeo-environmentalriskthatisseenin mountainousterrainsacrosstheworldandposesaserious danger to infrastructure and human life is landslides. Landslidesareoneofthemainrisksbroughtonbynatural events like earthquakes and rains, as well as human activitieslikeroadconstructionandurbanisationthatmay resultinslopecollapses.Almost9%ofall-naturaldisasters globallyincludelandslides.Large-scaleslopefailureshave
beencausedbyrecentbigearthquakesthathaveoccurredin China (1999), Kashmir (2005), China (2008, 2010, 2013), Sikkim (2011), Nepal (2015), New Zealand (2016), Japan (2018), etc. Numerous people were killed, injured, and infrastructure was damaged, particularly since the road networks were disrupted, as a result of these disastrous occurrences.1.3%offatalitiesofall-naturaldisastersdied throughlandslides,withAsiaaccountingforaround54%of theselandslides.Inrecentyears,landslideshaveaccelerated in both wealthyandunderdeveloped nationsduetorapid urbanisation and development [65]. Many fatalities worldwide are caused by natural occurrences like earthquake-induced landslides [27,28,38,45,58]. The majorityofthelandslidestakeplaceinregionswithactive tectonics, uneven topography, and high rates of precipitation.Thegeographicdistributionandintensityof landslidesareinfluencedbytopographicfeatures,lithology, geomorphology,landuse,andlandcover[3].TheHimalayan mountainregion'spopulationandinfrastructurearealways underriskduetomassmigrations.Duetothepredominately mountainous topography of the NE Himalaya, landslip activity is seen as a severe issue that threatens both infrastructure and habitation. Thousands of landslides occurredinIndianHimalayanRegion(IHR)anditsadjoining areasasaresultofthecatastrophic2005&2011earthquake in Kashmir and Sikkim [44,59]. Massive landslides, rock avalanches,andotherslopecollapsesthatoccuroftenhave caused severe casualties and significant infrastructure damage[9,5,44,46].Therehavebeenmanystudiesdonein thepasttoidentifythedistributionoflandslides,fielddata collecting techniques, inventory development, and geographicdistributionanalysis[7,6,36,44,57]aswellasto understand the mechanics, distribution, and evolution of earthquake-triggered landslides. The territory has been divided into several susceptible zones using the methodologies of landslip susceptibility, including knowledge-based,statistical,deterministic,probabilistic,and machine learning (ML) [5,26,33]. An efficient method for preventingandreducinglandslidesacrossalargeterritoryis land-slide susceptibility assessment. It is one of the most helpfulinformationalresourcesfordecision-makersandaids expertsinloweringthedangertolifeandproperty.Inrecent years, a number of methods for assessing landslide susceptibilityhavebeencreated,allofwhicharebasedon theideathatfuturemassmovementsmaybepredictedby
International Research Journal of Engineering and Technology (IRJET) e-ISSN: 2395-0056
Volume: 11 Issue: 05 | May 2024 www.irjet.net p-ISSN: 2395-0072
lookingattherelationshipbetweenpreviouslandslidesand theelementsthatinfluencedthem[31,12].Thereareseveral waystocreatealandslipsusceptibilitymap(LSM)basedon variousformulations,butstatisticalapproachesandmachine learning are the most popular ones [23,35,47,55]. For the detection, categorization, and evaluation of landslides, satellite remote sensing (RS) and geographic information systems(GIS)areextensivelyused.Recentyearshaveseen anincreaseintheuseoffreelyavailablemoderateresolution satellitedata,suchasthatfromSentinelsandLandsat8.
Landslides in the area have previously been accurately identifiedusingLISSImageriesofhighresolutions[41].The aidofdataontopographyandenvironmentalcharacteristics hasposedaboontodata-andknowledge-drivenstatistical models,whichhavedominatedtheLSMfieldrecently[32]. Numerous statistical techniques for LSM have been anticipated and effectively used to aid in the analysis of landslipdistributionpatternsandtheprocessesthatcreate them as a result of recent advancements in geospatial technology[42].LSMarequicklyconvertingfromstatistical and knowledge-driven learning to advanced statistical approacheswithmoreprecisionandaccuracy.LSMhasbeen employed to handle the global mapping of landslip risk becauseofitsmagnificence.
Around the world, landslip mapping has been done in a variety of ways, but they all have the same objectives. Numerousmodelsandapproachesarenowbeingproposed at both the local and regional levels to predict the spatial distributionoflandslides.WhileoptimumLSMisofgrowing interest to land geoscientists, many of them are concentratingonastatisticalandknowledge-basedmodel for landslip predictions, such as [2,36,51]. Recently, researchersareworkinguponadvancedstatisticalmodels duetotheirusefulnessandexcellentaccuracy.Theprecision of traditional statistical techniques for LSM make them successful. The most efficient statistical techniques are consideredtobeInformationValueModel(IVM),Statistical index(SI),frequencyratio(FR)andcertaintyfactor(CF).The effectivenessofeachofthelandslidecausativefactorsonthe incidence of landslides is assessed using these methodologies, which are commonly used data-driven approaches.Inordertoreducetheprobabilityoflandslides occurring,itishelpfultoexamineregionallyscaledlandslide risks and their numerous affecting factors. Thousands of landslidesoccurredinEasternHimalayasasaresultofthe anthropogenicandtectonicfactors.Numerousstudieshave been done in different parts of Indian Himalayan Region (IHR)andtheareassurroundingitthatweredamagedbythe tectonic causes in order to characterise landslides and determine their vulnerability [37]. The objective of the current work is to analyse the spatio-temporal LSM using advancedstatistical techniquesthataremorereliableand stable. The aim of this study is to apply cutting-edge advancedstatisticalmethodstoforecastthespatiotemporal vulnerabilityoflandslides.InthedistrictofEastSikkim,NE HimalayasofIndia,thecurrentstudy'sparticulargoalisto
construct and access landslip susceptibility models about theirimpactingcauseutilisingtemporaldatafromhistorical records, field visits and satellite Imageries. Further evaluation of the sensitivity and risk maps for landslip mitigationandtheuseofdisasterreductionmethodsinthe areamightbedoneusingsusceptibilitymaps.
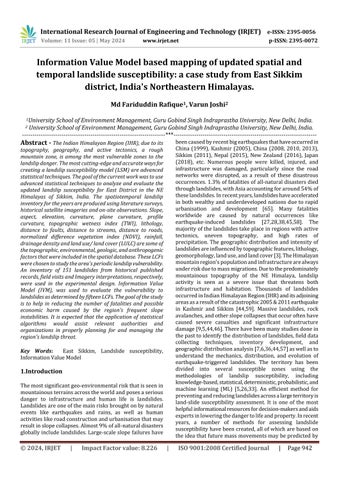
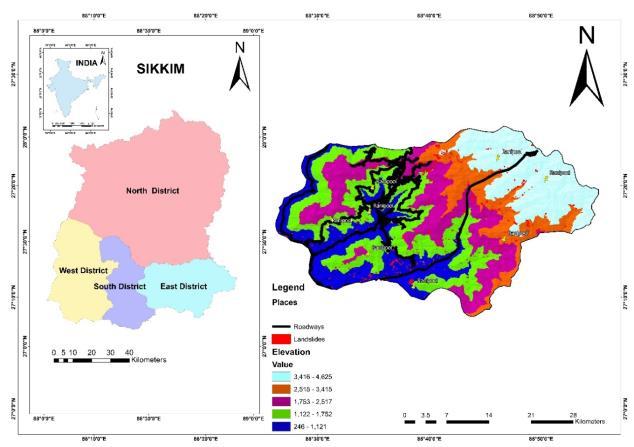
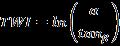
The study area geographically lies in the NE Himalayas of India,whichcoversanareaof964squarekilometerswitha populationof0.16millionsituated.IntheEastDistrict,679 squarekilometers,or71.17percentofthedistrict'stotalland area(964squarekilometers),arecoveredbyforests.Ofthe overall geographic area, very dense forest takes up 162 squarekm,denseforesttakesup396squarekm,andopen foresttakesup121squarekm.Hill,valley,andslopearethe three main physiographic units. Teesta, Rangpo Chhu, and Dik Chhu are the three main drainage systems in the East District.Elevationrangefrom246mto4625m(Fig.1).Mean average temperatures ranges between 22℃ to 36℃ in summer,while minus 04℃ to 07℃ in winter, withannual precipitationof100–900mm(Source:IMDdata)(Fig.2).The lithostatic units in the area are Kanchenjunga gneiss, Darjeeling gneiss, Chungthang schists and gneiss, Lingtse granitegneiss,andtheDalinggroupofrocks,whichincludes phyllite,slates,quartzites,andschistofPre-Cambrianage,are the five geological units found in the district (Source : GSI Report, 2020) . Alluvium quaternary deposits periodically formalongstreamsand rivers.Numerousfractures,faults, joints,folds,andotherstructuralanomalieshaveformedin therocksfoundinthedistrictasaresultofvariousstructural disturbances. Geological formations in the area show prominentlineamentsthatrunintheN-S,E-W,NE-SW,ENEWSW,andNW-SEdirections.
International Research Journal of Engineering and Technology (IRJET) e-ISSN: 2395-0056
Volume: 11 Issue: 05 | May 2024 www.irjet.net p-ISSN: 2395-0072
-2:AnnualPrecipitationofthestudyarea(Source: IMD,2020).
3.1.
Thedatasourcesusedtocreatethelandslipinventoryand LCFs are shown in Table 01. Using LISS IV Sensor (Resourcesat Satellite) Images, Google Earth Images, Toposheetsandfieldinvestigationsbasedonthecriterionof loss of vegetation and disruptions in forest canopy, the landslides in the research region were interpreted and mapped. Using supervised classification in Exelis ENVI version5.3,a land-use/land-covermap wascreatedusing LISSIVsatelliteimages.
The National Remote Sensing Centre (NRSC) providedthetemporalimagesofLISSIV(5.8mresolution) with a cloud cover of 2.10%. To extract the topographic variablesfortheresearchregion,a25mresolution,digital elevationmodel(DEM)basedonCartoDEM wasemployed. Todeterminethelithologicalandtectonicpropertiesofthe region,geologicalmapsobtainedfromtheGeologicalSurvey of India (GSI) were used. Using a handheld Global PositioningSystem(GPS)andGLONASSreceiverwithafield surveyprecisionof5meters(m),thelandslipinventorywas cross-verified.
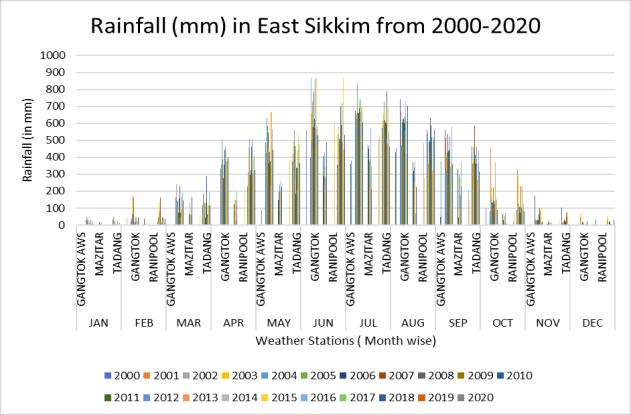
In the field, landslides' physical qualities and featuressuchaslengthandslopeanglearemeasuredusing laser distance. ArcGIS 10.8 (Esri Inc.) was used to map, digitize,andanalyzethedatathatwascollectedfromvarious sources.Fig.3depictsthemethodologicalflowchartusedto accomplishthestudy'spredeterminedgoal.
Fig -3:Schematicdiagramshowingthelandslide susceptibilitymapdevelopment
Theuseofasustainablelandslipinventoryrequiresprecise, high-quality data from a geospatial record in conjunction with a reconnaissance survey based on fieldwork (Fig. 5 a,b,c,d,e,f,g&h). A crucial step in comprehending and analyzing the comparison between a landslip and the governing variables that determine landslip susceptibility andhazardmappingistheidentificationanddevelopmentof landslip inventory[25,13]. By mapping with on-site visits, remotesensingmethods,andexaminingtemporalsatellite pictures,thetemporallandslideswereupdated.
Inordertointerpretandupdatethelandslideinventoriesin thestudyarea,remotesensingdatafromGoogleEarthand RESOURCESATsatelliteimageriesfrom2010,2015and2020 were used. These data are very useful in identifying those landslidespresentinthehillyormountainousareasthatare notaccessiblethroughthefieldsurvey.Forthepurposeof recognizing mass migration, the destruction of natural vegetationisemployedasafundamentalcriterion.
Following landslide detection using RESOURCESAT, temporallandslideinventoryofseveralyearswerecreated, encompassing 151 landslides that covered 9.939 km2 respectively(Fig.4a&b).TocreatetheIVMmodels,samples fromthe2010,2015,and2020inventoriesoflandslidesand non-landslides were used. Each landslip inventory is randomlysplitintotwogroups(trainingandtesting)based onthepercentageofsamples,witharatioof70%:30%.
Each year's inventory contains 70% samples of landslides andnon-landslidesthatareusedastrainingsamples,while theremaining30%aresamplesthatareusedfortesting.This methodyieldsthebestresultssincethenon-landslidingarea ischosenonalow-angledslopeareawherethelikelihoodof landslidingisextremelylow.Afterpreparingthedatasets, LSMswerecreatedusingtheweightedoverlaytoolpackin ArcGIS10.8.
Volume: 11 Issue: 05 | May 2024 www.irjet.net
Table -1: List
Field visits,Bhukosh,GSI
(IMD),Gangtok
Geologicalmapfrom GeologicalSurveyof India(GSI)
NationalBureauofSoil SurveyandLandUse Planning(NBSSLUP)

International Research Journal of Engineering and Technology (IRJET) e-ISSN: 2395-0056
Volume: 11 Issue: 05 | May 2024 www.irjet.net p-ISSN: 2395-0072
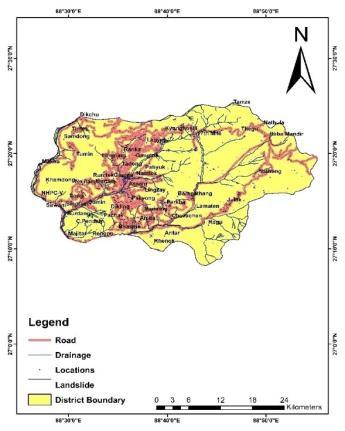
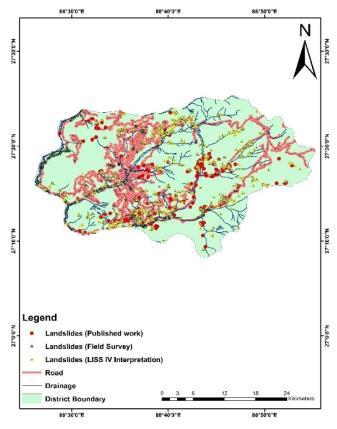
Fig -4:Mapshowing(a)LandslidePolygonInventory& (b)LandslideTriggerpoints
3.3.
Numerous LCFs, such as topographical, geological, environmental,andanthropogenicfactors,interacttoaffect slopefailure[15,19].Thelikelihoodofamassmovementwas assessedbythelinkbetweenlandslipactivityandinfluencing factors.TherearefifteenLCFsinthisstudy,includingNDVI, landuse/land cover, slope gradient, aspect, elevation, curvature, profile curvature, plan curvature, Rainfall, Drainagedensity,TWI,andlithology{Figs.6(a-o)}.
3.3.1.
Theslopegradientisthemainreasonforlandslides[63].It affects the stress distribution in the slope, the weathering layer, and the run off from the slope's surface(Fig.6b).Thereasonwhysteepslopescollapsemore frequently than moderate slopes may be attributed to restrictionpressures[28]Accordingto[51],theslopearea was derived from a DEM with a 2.5 m resolution and categorizedintosevenclasses:0-15,15-20,20-30,30-40, Above>40.
3.3.2.Aspect
Duetotheslope'saspect(Fig.6m),whichcausesmeltingof the snow and water infiltration, increased freezing and thawing,andmassmovement,theaspectisakeyinfluencing element. In a certain area, landslides usually occur in a particulardirection[54].UsingArcGIS10.8,theaspectwas reclassifiedintoeightclassesafterbeinggeneratedfromthe DEM.
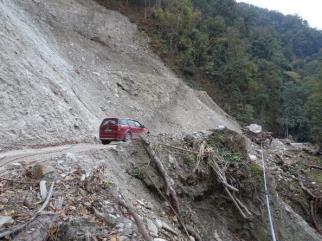
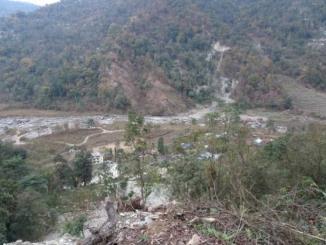
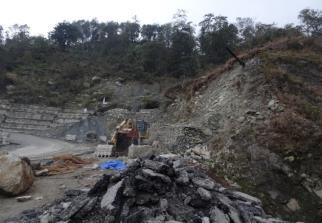
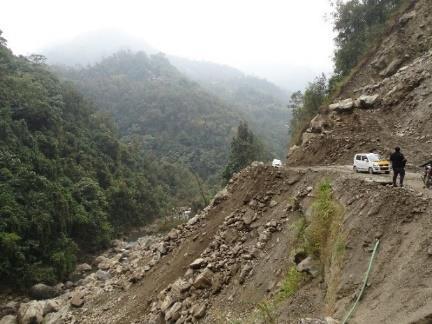
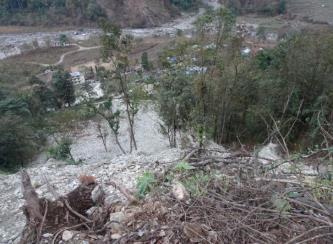
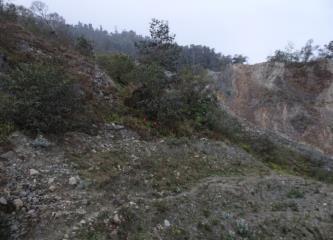
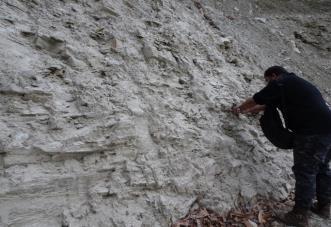
Fig -5:Photographsduringfieldinvestigation(a)Affected housesduetoPacheySlide(b)debrisflowatQuKhola Slide(c)TeentaalSlide(d)Devastedvegetation(e) VulnerablesettlementsintheValley(f)KitGolaiSlide (g)Vulnerableroadconstruction(h)Fragilelithology.
3.3.3.Elevation
The elevation (Fig. 6a) plays a significant role in the geographical distribution of landslides used for landslide susceptibilitystudies[17,36]Elevationhasamajorimpacton slope failure and has a considerable impact on regional features[22].Theresearcharea'selevationvariesfrom246 mto4625m,andanelevationmapwascreatedusingDEM andthereclassificationtoolinArcGIS10.8.
International Research Journal of Engineering and Technology (IRJET) e-ISSN: 2395-0056
Volume: 11 Issue: 05 | May 2024 www.irjet.net p-ISSN: 2395-0072
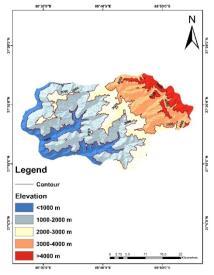
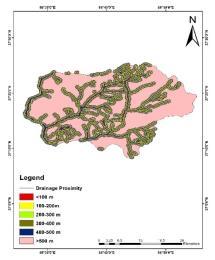
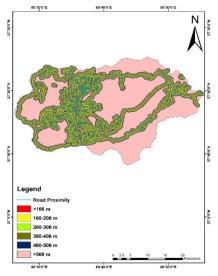
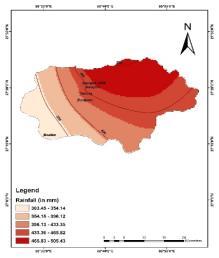
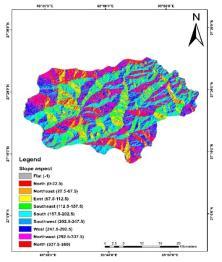
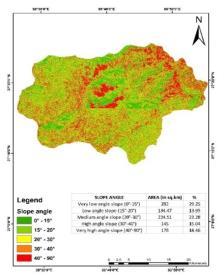
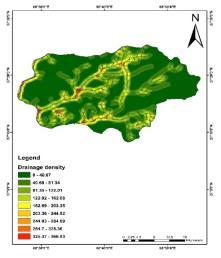
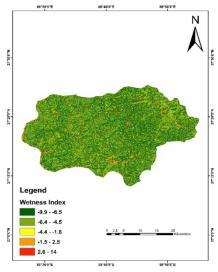
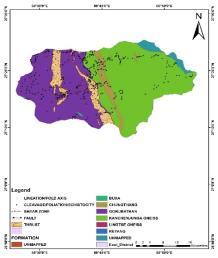
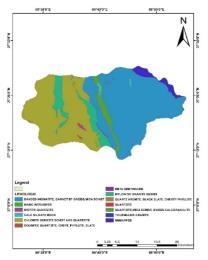
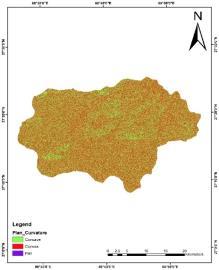
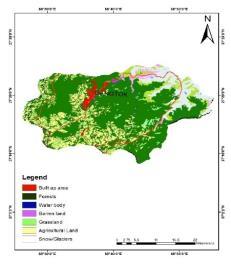
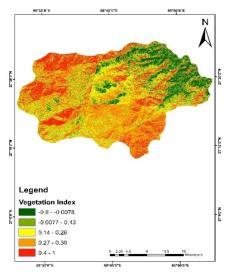
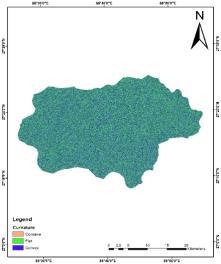
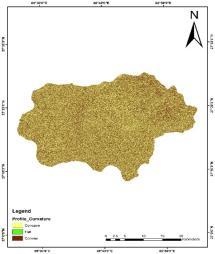
Fig -6:Mapshowing(a)Elevation (b)Slopeangle (c)Plan curvature(d)DrainageProximity (e)Drainagedensity (f)Landuse/Landcover (g)RoadProximity(h)TWI (i)NDVI (j)Rainfall (k)Seismotectonic(l)Curvature (m)Slope aspect (n)Lithology (o)Profilecurvature
3.3.4.Curvature
Theslope'scurvatureisanotherwaytoexpresstheslope's geometry, and it plays a crucial role in the occurrence of landslides[43](Fig.6l).Maggioni,[40]statesthatcurveswith negativevaluesareconcaveandthosewithpositivevalues areconvex.Theslopesurface'scurvesandcurvaturevalue bothriseatthesametime.
3.3.5.Plancurvature
Plancurvature,oftenreferredtoasthecurvatureoftheslope surfaceinahorizontalsurfaceorthelineofelevationona topographical map (Fig. 6c), is what determines how the water will move in its flowing trajectory. Positive values implythatthecell'ssidesurfacesareconvex,whilstnegative values imply that the side surfaces are concave. A surface withazerovalue,ontheotherhand,isregardedaslinearor flat.
3.3.6.
Profilecurvatureisdescribedashavingahighslopeanglein thedirectionoftheslopesurface(Fig.6o).Thetrajectoryof waterisalsoinfluencedbytheprofilecurvature[48,66]The surface of the cell is assumed to be convex upwards by a negative number andconcave by a positive number.If the valueis0,thesurfaceisflat.Theaccelerationorslowdownof flowthroughasurfaceisinfluencedbyprofilecurvature.
3.3.7.Topographicwetnessanalysis(TWI)
TheTWIisasignificantcontributortothemassmovement's causes. The TWI identified the region of accumulation of waterflow,whichiscommonlyconnectedtosaturatedland, bothintermittentlyandpermanently(Fig.6h).Thehydrology andrastercalculatortoolinArcGIS10.8wereusedtocreatea DEMwithaspatialresolutionof2.5m[29]
3.3.8.Lithology
Thelocallithology(Fig.6n)hasasignificantimpactonthe likelihoodofmassmovement.Lithologyisregardedasawellknown criterion that significantly influences the physical characteristicsofsurfaceandsubsurfacematerialsandplays a significant role in the slope failure process [35]. The majority of slope failures occurred in weak, unstable, or brittle lithological units. The variance in slope surface instability is also influenced by the differences between differentlithologicalunits[1]
3.3.9.Distancetofaults
Whenthefaultsareactive,theyhaveasignificantimpacton thedistributionofmassmovement(Fig.6k).Themajorityof slope collapses are impacted by the proximity to faults caused by rock and surface structure cracking [7] ArcGIS softwarewasusedtocalculatethedistancefromthefaults usingthebuffertool.
3.3.10.NDVI
According to [52], NDVI is a significant environmental influencingelement(Fig.6i).Theplantdensityontheslope surface is measured using the NDVI. It is widely acknowledgedthattheadditionofgrassesandrootsplaysa significantpartinthestrengthofthesoil.AnNDVImapwas produced using multispectral Resourcesat satellite data to showthelocationanddensityofsurfacevegetation.
3.3.11.Rainfall
The rainfall map of East district is prepared using rainfall data fromIndia Meteorological Department(IMD)website having resolution of 4km×4Km. The rainfall data of last
International Research Journal of Engineering and Technology (IRJET) e-ISSN: 2395-0056
Volume: 11 Issue: 05 | May 2024 www.irjet.net p-ISSN: 2395-0072
twentyyearssince2000to2020isdownloadedformonsoon months(MaytoSeptember)andaveraged[53].Thethematic layerofrainfallispreparedusingaverageddatawiththehelp oftheinterpolationmethodofIDWinArcGIS(Fig.6j).
3.3.12.Drainagedensity
The density of drainage is a significant signal of the linear scale of the element in stream eroding topography and is specifiedasthetotalstreamlengthofallordersanddrainage areasandmayindicatethechannelspacingcloseness[18]; [49].Drainagedensityiscriticalasitleadstomasswasting andslopefailure.Thedrainagedensityinthestudyareais divided into nine classes up to 335 km2. In the ArcGIS software drainage density map with the help of data from CartosatDEMisprepared(Fig.6e)
3.3.13.Landuse/Landcover
Environmentally regulated elements are thought to play a significantroleinthelikelihoodoflandslides.Anothercrucial environmental regulated influencing factor of the landslip thatavoidssurfacesoildeteriorationisthearea'sLU/LC(Fig. 6f).Landcoverisakeydeterminingfactorforslopefailure sincethemassmovementisbasedonthekindofland.The landuse/landcovermodelwascalculatedusingResourcesat imageswith2%cloudcover.ExilesENVIsoftwarewasused tocategorizethepictureintoseverallandusegroups(suchas forest,barren,grassland,waterbodies,andurbanland)after performingsupervisedclassificationwithanaccuracyof85.1 percent
3.3.14.Distancefromdrainage
Distancetodrainage(Fig.6d)isdeterminedasasignificant influencing parameter in the slope failure because the proximitytoawaterbodyinaregionincreasesthelikelihood ofaslopefailurebyincreasingfluidporepressureandslope toeerosion[20,50].Duetotheruggedtopography,whichwas extractedusingCartosatDEMandthenreclassifiedinArcGIS 10.8, the research area includes a substantial drainage network.
3.3.15.Distancefromroads
Anthropogenicinfluencesarethosethatarebroughtonby humanaction,suchasroadconstruction,miningorremoving vegetation.Oneofthekeyconsiderationsisthedistancefrom theroad(Fig.6g),sincemostlandslidesoccurowingtothe influenceoftheroadnetwork,whichhasasimilareffectto the closeness of drainage in steep terrain [64]. The roads weredigitalizedusingGoogleEarthandtopographicalmaps. Theroadnetworkwasdividedintomanybuffers,whichwere subsequentlyreclassifiedusingthereclassifytoolinArcGIS 10.8.
The information value model is a statistical approach to predict an event based on the parameter relation and the event.Thisisanapproachfocusedonthefrequencyofthe landslideoccurrenceintheLandslideCausingSpatialFactor distribution across the study area[11,10] It is an indirect statisticalmethodandcanbeusedtodeterminethespatial relationbetweenthelikelihoodoflandslideoccurrenceand theconditioningfactors[21].Thelikelihoodoflandslidesis determinedinthismodelbythefactorinformationvalue[39] The efficiency of this model depends on the variables betweenthelandslideconditioningfactorsandthelandslide distribution[61]. In order to determine the weights of the predictor, the ratio of landslide density in each class of a causalfactortolandslidedensityinthetotalareashouldbe calculated[14].Theweightmeasurementequationisgiven below:
LandslideDensitywithinafactorclass
LandslideDensitywithinthestudyarea
=ln ����(����)/��������(����) ��������(����)/��������(����)
where,Wt=Weightofafactorclass;ln=naturallogarithm; Npix(Si) = Number of pixels of landslide within class i; Npix(Ni)=Numberofpixelsofclassi;ΣNpix(Si)=Numberof pixelsoflandslidewithinthewholestudyarea;ΣNpix(Ni)= Numberofpixelsofthewholestudyarea.
Thenaturallogarithmisusedtogivenegativeweightswhen thelandslidedensityislessthanaverage,andwhenitismore than average positive weights are assigned. The positive weight(Wt)isthedirectconnectionbetweenlandslideand landslide predictor factor and the existence of landslide predictors.Foreachclassofcausativevariables,theweight valuewascalculatedbytheaboveequation.Aweightedvalue wasaddedforthelandslidesusceptibilityindex(LSI)ofeach pixeltoproduceamapforlandslidesusceptibility.
LSI=
WhereASPwtistheweightofaspect,SLPwtistheweightof slope,CURwtistheweightofcurvature,DNDwtistheweight ofdrainagedensity,LGYwtistheweightoflithology,LULwtis theweightoflanduseandlandcover,NDVwtistheweightof NDVI,ELVwtistheweightofelevationLNDwtistheweightof lineamentdensity,GMPwtistheweightofgeomorphology and SLTwt is the weight of soil type. The negative and positive weighted values represent the interaction of an irrelevantandsignificantelementwithanoccurrenceofthe landslide[12].The landslide-susceptibility map is subsequentlycombinedwiththelandslidetrainingandthe testingraster.DividingLSIintothreeareasbaseduponits steepness, which include a high susceptibility zone, a moderatesusceptibilityzoneandalowsusceptibilityzone, intensityoflandslidesusceptibilityismeasured.(Table2)
International Research Journal of Engineering and Technology (IRJET) e-ISSN: 2395-0056
Volume: 11 Issue: 05 | May 2024 www.irjet.net p-ISSN: 2395-0072
Table -2: WeightagetableofcausativefactorsoflandslideandcorrespondingIVWt.
International Research Journal of Engineering and Technology (IRJET) e-ISSN:
Volume: 11 Issue: 05 | May 2024 www.irjet.net
International Research Journal of Engineering and Technology (IRJET)
Volume: 11 Issue: 05 | May 2024 www.irjet.net
4. Results and discussion
4.1.Landslidesusceptibilitymodels
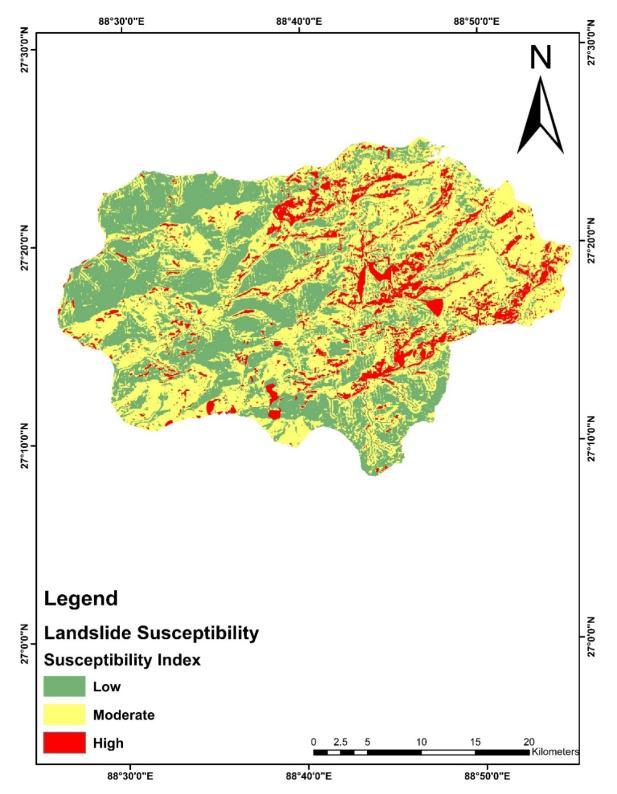
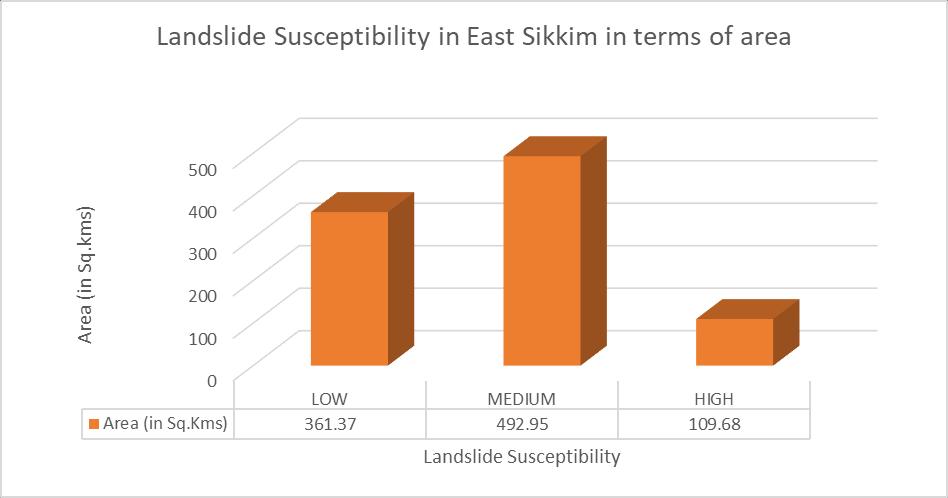
UtilizingvaluesassignedtotheLCFs,andlandslideinventory of several years (2010, 2015, and 2020) the susceptibility modelsfortheresearchregionwascreatedusingArcGIS10.8 and unique, extremely accurate advanced statistical techniques. The resulting LSMs depict the likelihood of landslides in a "low to high" range, with low denoting a region that is safe from mass movement activity and high denoting a likelihood that landslides would occur (Fig. 7). LSMiscalculatedusingtheInformationValuewt.coefficients andcorrespondingclasses andlandslidevariationofLCFs. Eachdatasetidentifiesregionsthatarevulnerabletomass movementactivitiesinalittletosomewhatvariedmanner. Additionally, the LSM is divided into three zones (Low, Moderate, High) to help identifyareas that may be at high risk of experiencing landslides. Figure 7 displays the IVMLSM. To determine, the highest likelihood of a landslip occurrence is along a fault, LSMs classified as high susceptibility zones. The majority of the area's roadways havemoderatetohighgradesandarelocatedbetween1000 and1500metersabovesealevel.Theareaoccupiedbythese sensitive zones on basis of landslide inventory of various years is depicted in Fig. 7. The slope gradient and area's lithology, such as fragile phyllite and schists, are effective LCFsamongallotherLCFsforlandslipactivityintheyears 2010, 2015, and 2020. This is demonstrated by the Information Value weight coefficient. According to the updated, the LR susceptibility model predicts a very high susceptiblezoneof109.68km2,Moderatesusceptiblezoneof 492.95km2 andlowsusceptiblezoneof361.37km2 outof total964km2 oftheresearchregion(Fig.8,9&Table.03).
International Research Journal of Engineering and Technology (IRJET) e-ISSN: 2395-0056
Volume: 11 Issue: 05 | May 2024 www.irjet.net p-ISSN: 2395-0072
LSMofEastDistrictindicatesthat37.49%ofthetotaldistrict area is classified into low landslide susceptibility, while 51.14%areahavemoderatelandslidesusceptibility.11.38% ofthetotaldistrict’sareahavehighlandslidesusceptibility (Table 03). East District is found to have high landslide susceptibility which is confirmed by field visits and secondarysources.Theoutputlandslidesusceptibilitymapof Study area (Fig.7) based on Information Value method is classifiedintothreesusceptiblecategoriesasLow,Medium, High.Percentageareaineachclassiscalculated.(Table03)
Table -3: ClassificationoflandslidesusceptibilityofEast district,Sikkim
theremotesensing(RS)andgeographicinformationsystem (GIS)environment.Thethematiclayersforthesamehasbeen prepared which is further used to prepare the Landslide Susceptibility Map of the study area. For the validation of LSM, it is compared with landslide inventory map. It is observed that eastern part of the district is classified into highandveryhighlandslidesusceptibilityclasswhichisin agreement with the landslide inventory map. Landslide inventorymapalsosuggeststhatmajorityofthelandslides areobservedintheeasternpartofthedistrict.
TheanalysisofIVMsusceptibilitymodelindicatethatthe regionissusceptibletolandslipactivityisgrowinginavery highsusceptiblezoneoverthevariousyears’worthofdata. Our findings are consistent with Costanzo et al.'s [15] assertion that topographic conditions have a substantial impactontheoccurrenceoflandslides.Ourfindingssupport those Riaz et al.[51], Pham et al.[52], Ikram et al.[35], and Ahmedetal[2],thatlithologicalunitsandslopegradientare themostsignificantLCFs.
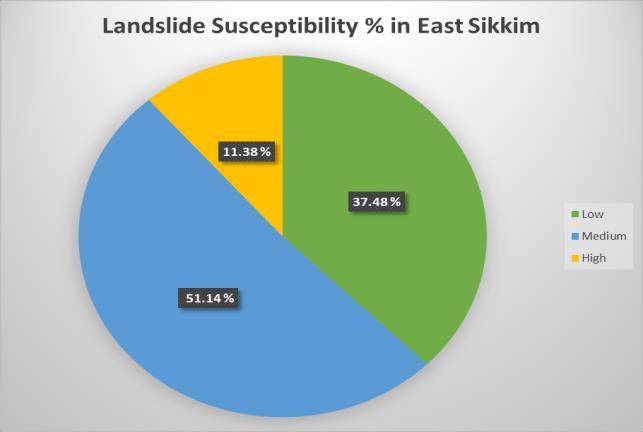
-8:LandslideSusceptibilitypercentagevariationinthe researchregion
Usingtheadvancedstatisticalmodel i.e.InformationValue Model(IVM)itisdiscoveredthatthemostsignificantLCFs are Elevation, distance to drainage, NDVI, curvature, and rainfall.Thesefindingsprovedthatthesignificanceofmajor LCFsvariesdependingonthegeographyandmodelsused. Forthecurrentstudyfifteenlandslideconditioningfactors, i.e.,slopeaspect,slopegradient,elevation,Lithology,landuse and land cover (LULC), rainfall, Curvature, Plan curvature, Profile curvature, normalized difference vegetation index (NDVI), Geology, Road Proximity, Drainage Proximity Drainagedensity,andtotalwetnessindexwereanalyzedin
2024, IRJET | Impact Factor value: 8.226 |
-9:
This study used temporal landslide inventories for the District East Sikkim in the NE Himalayas of India to apply advancedstatisticaltechniquetodeterminethesusceptibility zonesoflandslidesandestimatethelikelihoodoflandslide activity.TheEastSikkimdistricthasexperiencedsignificant economiclossesasaresultofthelandslipactivity,including damage to communities, infrastructure, and roadways. To createIVM-LSManddeterminethecausesoflandslidesinthe area, the study used spatiotemporal landslide inventories (2010, 2015, and 2020) with fifteen causative elements, including topographic, geological, environmental, and anthropogenicvariables.TheLSMshowedthattherainfall, slopeandlithological(i.e.,fragilePhyllite,Schists)controlin the proximity of faults considerably regulate the landslip activitiesintheresearchregion.ThemosttrustworthyIVMbased LSM study datasets from the years 2010, 2015, and 2020showedthattheareahasaveryhighlysensitivezone that is continually expanding. It was determined that IVM models are workable by the validation using statistical measuresandinagreementwiththelandslideinventoriesof various years. The findings also imply that IVM-LSMs are more trustworthy and authentic. It is recommended that advancestatisticalmodelsbeusedasthepreferredmodels for predicting landslides in the study region. This study establishes that since the region is highly susceptible in nature,soastopredict,theupdatedLSMModellinghastobe donetoevaluatetheeffectivenessLSMinthisparticulararea. Inourpresentstudylandslidesusceptiblezonationmapping isdone.Almostallthelandslideshavebeenreportedinthe rainy season. The study shows that land use/land cover, rainfall,slope,drainagedensity,structureandlithologyplay animportantroleinlandslidetriggering.Therankingofthe
International Research Journal of Engineering and Technology (IRJET) e-ISSN: 2395-0056
Volume: 11 Issue: 05 | May 2024 www.irjet.net p-ISSN: 2395-0072
conditioningfactorsbasedonthepresentanalysisandthe landslide hazard index is highest for rainfall followed by structures,lithology,slope,LU/LCanddrainagedensity.The total studyarea is divided into three susceptible zones i.e. low, medium and high susceptible zones comprising of 37.49%, 51.14%and 11.38% and361.37km2, 492.95km2 and109.68km2 inEastdistrict(Fig.8&9).
Themethodologydescribedhereforlandslidesusceptible mapping includes generating thematic information layers, developing an appropriate numerical rating system, integrating spatial data and validating outcomes. It is analyzed that GIS application is extremely helpful for the generation of thematic information and their spatial data analysis, involving complex tasks. The numerical rating system enables to enhance performance assessment and optimization.Sincethecontributingvariablestothelandslide differ from region to region, however this rating may not apply to other areas of the Himalayas. To create temporal landslide inventory for recursive landslide hazard assessment,historicallandslidedatafromavarietyofsources canbeused.Finally,theknowledgefromthisstudy'sfindings willhelpurbanplanners,disastermanagementauthorities, and other decision-makers choose safe building sites and identify regions that are prone to landslides. In order to preventinfrastructuredevelopmentinlandsliprisklocations, morepracticewithlandslipriskassessmentstudiesmightbe conductedtobuildriskmaps.
Acknowledgements
The author(s) are very thankful to GBPNIHE for financial support through GBPNIHESD project sanction letter No.: GBPI/IERP/19-20/13 dated 31st March 2020 and Dean, USEM,GuruGobindSinghIndraprasthaUniversity,NewDelhi forprovidingthefacilityincarryingoutthestudy.
References
1. Aditian, A., Kubota, T., & Shinohara, Y. (2018). Comparison of GIS-based landslide susceptibility models usingfrequencyratio,logisticregression,andartificialneural network in a tertiary region of Ambon, Indonesia. Geomorphology,318,101-111.
2. Ahmed,K.S.,Basharat,M.,Riaz,M.T.,Sarfraz,Y.,& Shahzad,A.(2021).Geotechnicalinvestigationandlandslide susceptibility assessment along the Neelum road: a case study from Lesser Himalayas, Pakistan. Arabian Journal of Geosciences,14(11),1019.
3. AYDIN,A.,EKER,R.,&FUCHS,H.(2017).LidarData Analysis With Digital Image Correlation (Dic) In Obtaining Landslide Displacement Fields: A Case Of Gschliefgraben Landslide-Austria. The Online Journal of Science and Technology-October,7(4).
4. Basharat,M.,Riaz,M.T.,Jan,M.Q.,Xu,C.,&Riaz,S. (2021).Areviewoflandslidesrelatedtothe2005Kashmir Earthquake: implication and future challenges. Natural Hazards,108,1-30.
5. Basharat,M.,Riaz,M.T.,Jan,M.Q.,Xu,C.,&Riaz,S. (2021).Areviewoflandslidesrelatedtothe2005Kashmir
Earthquake: implication and future challenges. Natural Hazards,108,1-30.
6. Basharat, M., Shah, H. R., & Hameed, N. (2016). Landslide susceptibility mapping using GIS and weighted overlaymethod:acasestudyfromNWHimalayas,Pakistan. ArabianJournalofGeosciences,9,1-19.
7. Basharat, M., Rohn, J., Baig, M. S., & Khan, M. R. (2014). Spatial distribution analysis of mass movements triggeredbythe2005KashmirearthquakeintheNortheast HimalayasofPakistan.Geomorphology,206,203-214.
8. Basharat, M., Rohn, J., Baig, M. S., Khan, M. R., & Schleier,M.(2014).Largescalemassmovementstriggeredby theKashmirearthquake2005,Pakistan.JournalofMountain Science,11,19-30.
9. Basharat,M.(2012).Thedistribution,characteristics andbehaviourofmassmovementstriggeredbytheKashmir Earthquake 2005, NW Himalaya, Pakistan (Doctoral dissertation, Friedrich-Alexander-Universität ErlangenNürnberg(FAU)).
10. Banerjee, P., Ghose, M. K., & Pradhan, R. (2018). Analytic hierarchy processand informationvalue methodbased landslide susceptibility mapping and vehicle vulnerability assessment along a highway in Sikkim Himalaya.ArabianJournalofGeosciences,11,1-18.
11. Cao,Y.,Yin,K.,Alexander,D.E.,&Zhou,C.(2016). Using an extreme learning machine to predict the displacementofstep-likelandslidesinrelationtocontrolling factors.Landslides,13,725-736.
12. Chen, W., & Li, Y. (2020). GIS-based evaluation of landslide susceptibility using hybrid computational intelligencemodels.Catena,195,104777.
13. Chen,W.,Xie,X.,Wang,J.,Pradhan,B.,Hong,H.,Bui, D.T.,...&Ma,J.(2017).Acomparativestudyoflogisticmodel tree, random forest, and classification and regression tree models for spatial prediction of landslide susceptibility. Catena,151,147-160.
14. Chen,W.,Li,X.,Wang,Y.,Chen,G.,&Liu,S.(2014). Forested landslide detection using LiDAR data and the randomforestalgorithm:AcasestudyoftheThreeGorges, China.Remotesensingofenvironment,152,291-301.
15. Costanzo, D., Rotigliano, E., Irigaray, C., JiménezPerálvarez, J. D., & Chacón, J. (2012). Factors selection in landslidesusceptibilitymodellingonlargescalefollowingthe gis matrix method: application to the river Beiro basin (Spain).NaturalHazardsandEarthSystemSciences,12(2), 327-340.
16. Dahal,R.K.,Hasegawa,S.,Nonomura,A.,Yamanaka, M.,Dhakal,S.,&Paudyal,P.(2008).Predictivemodellingof rainfall-inducedlandslidehazardintheLesserHimalayaof Nepalbasedonweights-of-evidence.Geomorphology,102(34),496-510.
17. Dai,F.C.,&Lee,C.F.(2001).Terrain-basedmapping oflandslidesusceptibilityusingageographicalinformation
International Research Journal of Engineering and Technology (IRJET) e-ISSN: 2395-0056
system:acasestudy.CanadianGeotechnicalJournal,38(5), 911-923.
18. Dikshit,K.R.,&Dikshit,J.K.(2014).Relieffeaturesof north-east India. In north-east India: land, people and economy(pp.91-125).Springer,Dordrecht.
19. Dou,J.,Yunus,A.P.,TienBui,D.,Sahana,M.,Chen,C. W., Zhu, Z., ... & Pham, B. T. (2019). Evaluating GIS-based multiplestatisticalmodelsanddataminingforearthquake andrainfall-inducedlandslidesusceptibilityusingtheLiDAR DEM.RemoteSensing,11(6),638.
20. Du,G.L.,Zhang,Y.S.,Iqbal,J.,Yang,Z.H.,&Yao,X. (2017).Landslidesusceptibilitymappingusinganintegrated modelofinformationvaluemethodandlogisticregressionin theBailongjiangwatershed,GansuProvince,China.Journalof MountainScience,14,249-268.
21. Du,G.,Zhang,Y.,Yang,Z.,Guo,C.,Yao,X.,&Sun,D. (2019). Landslide susceptibility mapping in the region of eastern Himalayan syntaxis, Tibetan Plateau, China: a comparison between analytical hierarchy process informationvalueandlogisticregression-informationvalue methods. Bulletin of Engineering Geology and the Environment,78,4201-4215.
22. Ercanoglu,M.U.R.A.T.,Gokceoglu,C.A.N.D.A.N., Th,W.,&VanAsch,J.(2004).Landslidesusceptibilityzoning north of Yenice (NW Turkey) by multivariate statistical techniques.NaturalHazards,32(1),1.
23. Farooq,S.,&Akram,M.S.(2021).COMPARISONOF DATA-DRIVENLANDSLIDESUSCEPTIBILITYASSESSMENT USING WEIGHT OF EVIDENCE, INFORMATION VALUE, FREQUENCY RATIO AND CERTAINTY FACTOR METHODS. ActaGeodynamicaetGeromaterialia,18(3),301-318.
24. Froude, M. J., & Petley, D. N. (2018). Global fatal landslideoccurrencefrom2004to2016.NaturalHazardsand EarthSystemSciences,18(8),2161-2181.
25. Galli,M.,Ardizzone,F.,Cardinali,M.,Guzzetti,F.,& Reichenbach,P.(2008).Comparinglandslideinventorymaps. Geomorphology,94(3-4),268-289.
26. Girma, F., Raghuvanshi, T. K., Ayenew, T., & Hailemariam, T. (2015). Landslide hazard zonation in Ada Berga District, Central Ethiopia–a GIS based statistical approach.JGeom,9(i),25-38.
27. Gorum,T.,Fan,X.,vanWesten,C.J.,Huang,R.Q.,Xu, Q., Tang, C., & Wang, G. (2011). Distribution pattern of earthquake-inducedlandslidestriggeredbythe12May2008 Wenchuanearthquake.Geomorphology,133(3-4),152-167.
28. Gorum, T., & Carranza, E. J. M. (2015). Control of style-of-faultingonspatialpatternofearthquake-triggered landslides. International journal of environmental science andtechnology,12,3189-3212.
29. Gruber, S., & Peckham, S. (2009). Land-surface parametersandobjectsinhydrology.Developmentsinsoil science,33,171-194.
30. Guo, C., Montgomery, D. R., Zhang, Y., Wang, K., & Yang, Z. (2015). Quantitative assessment of landslide susceptibility along the Xianshuihe fault zone, Tibetan Plateau,China.Geomorphology,248,93-110.
31. Guzzetti, F. (2002, October). Landslide hazard assessmentandriskevaluation:Limitsandprospectives.In Proceedings of the 4th EGS Plinius Conference, Mallorca, Spain(pp.2-4).
32. Guzzetti,F.,Mondini,A.C.,Cardinali,M.,Fiorucci,F., Santangelo, M., & Chang, K. T. (2012). Landslide inventory maps:Newtoolsforanoldproblem.Earth-ScienceReviews, 112(1-2),42-66.
33. Hamza, T., &Raghuvanshi,T. K.(2017).GISbased landslidehazardevaluationandzonation–AcasefromJeldu District, Central Ethiopia. Journal of King Saud UniversityScience,29(2),151-165.
34. Hewitt,K.,&Mehta,M.(2012).Rethinkingriskand disasters in mountain areas. Journal of Alpine Research| Revuedegéographiealpine,(100-1).
35. Ikram,N.,Basharat,M.,Ali,A.,Usmani,N.A.,Gardezi, S.A.H.,Hussain,M.L.,&Riaz,M.T.(2022).Comparisonof landslidesusceptibilitymodelsandtheirrobustnessanalysis: a case study from the NW Himalayas, Pakistan. Geocarto International,37(25),9204-9241.
36. Kamp,U.,Growley,B.J.,Khattak,G.A.,&Owen,L.A. (2008). GIS-based landslide susceptibility mapping for the 2005Kashmirearthquakeregion.Geomorphology,101(4), 631-642.
37. Kumar, K. V., Martha, T. R., & Roy, P. S. (2006). Mapping damage in the Jammu and Kashmir caused by 8 October2005Mw7.3earthquakefromtheCartosat–1and Resourcesat–1 imagery. International Journal of Remote Sensing,27(20),4449-4459.
38. Kirschbaum,D.,Stanley,T.,&Zhou,Y.(2015).Spatial and temporal analysis of a global landslide catalog. Geomorphology,249,4-15.
39. Luo,X.,Lin,F.,Zhu,S.,Yu,M.,Zhang,Z.,Meng,L.,& Peng, J. (2019). Mine landslide susceptibility assessment using IVM, ANN and SVM models considering the contributionofaffectingfactors.PLoSOne,14(4),e0215134.
40. Maggioni,M.,&Gruber,U.(2003).Theinfluenceof topographicparametersonavalanchereleasedimensionand frequency.ColdRegionsScienceandTechnology,37(3),407419.
41. Martha,T.R.,Kerle,N.,Jetten,V.,vanWesten,C.J.,& Kumar, K. V. (2010). Characterising spectral, spatial and morphometric properties of landslides for semi-automatic detection using object-oriented methods. Geomorphology, 116(1-2),24-36.
42. Merghadi, A., Yunus, A. P., Dou, J., Whiteley, J., ThaiPham, B., Bui, D. T., ... & Abderrahmane, B. (2020). Machine learning methods for landslide susceptibility studies:Acomparativeoverviewofalgorithmperformance. Earth-ScienceReviews,207,103225.
Volume: 11 Issue: 05 | May 2024 www.irjet.net p-ISSN: 2395-0072 © 2024, IRJET | Impact Factor value: 8.226 | ISO 9001:2008
| Page954
International Research Journal of Engineering and Technology (IRJET) e-ISSN: 2395-0056
Volume: 11 Issue: 05 | May 2024 www.irjet.net p-ISSN: 2395-0072
43. Nefeslioglu,H.A.,Gokceoglu,C.,&Sonmez,H.(2008). Anassessmentontheuseoflogisticregressionandartificial neural networks with different samplingstrategies for the preparation of landslide susceptibility maps. Engineering Geology,97(3-4),171-191.
44. Owen, L. A., Kamp, U., Khattak, G. A., Harp, E. L., Keefer,D.K.,&Bauer,M.A.(2008).Landslidestriggeredby the 8 October 2005 Kashmir earthquake. Geomorphology, 94(1-2),1-9.
45. Petley, D., Dunning, S., Rosser, N., & Kausar, A. B. (2006). Incipient landslides in the Jhelum Valley, Pakistan followingthe8thOctober2005earthquake.Messagesv.
46. Peiris, N., Rossetto, T., Burton, P., & Mahmood, S. (2006).EEFITmission:October8,2005Kashmirearthquake. Published Report, The institution of structural engineers, London.
47. Polat, A. (2021). An innovative, fast method for landslide susceptibility mapping using GIS-based LSAT toolbox.EnvironmentalEarthSciences,80(6),217.
48. Pourghasemi,H.R.,TeimooriYansari,Z.,Panagos,P., & Pradhan,B. (2018).Analysisand evaluation of landslide susceptibility:areviewonarticlespublishedduring2005–2016 (periods of 2005–2012 and 2013–2016). Arabian JournalofGeosciences,11,1-12.
49. Rawat,M.S.M.&JoshiV.,Sundriyal,Y..(2016).Slope stability analysis in a part of East Sikkim, using Remote Sensing&GIS.51-60.10.1109/NGCT.2016.7877389.
50. Raja, N. B., Çiçek, I., Türkoğlu, N., Aydin, O., & Kawasaki,A.(2017).Landslidesusceptibilitymappingofthe Sera River Basin using logistic regression model. Natural Hazards,85,1323-1346.
51. Riaz,M.T.,Basharat,M.,Hameed,N.,Shafique,M.,& Luo, J. (2018). A data-driven approach to landslidesusceptibility mapping in mountainous terrain: case study from the Northwest Himalayas, Pakistan. Natural Hazards Review,19(4),05018007.
52. Riaz, M. T., Basharat, M., Pham, Q. B., Sarfraz, Y., Shahzad, A., Ahmed, K. S., ... & Waseem, M. H. (2022). Improvement of the predictive performance of landslide mapping models in mountainous terrains using cluster sampling.GeocartoInternational,1-44.
53. Saha,A.,&Saha,S.(2021).Applicationofstatistical probabilisticmethodsinlandslidesusceptibilityassessment in Kurseong and its surrounding area of Darjeeling Himalayan, India: RS-GIS approach. Environment, DevelopmentandSustainability,23,4453-4483.
54. Saadatkhah, N., Kassim, A., & Lee, L. M. (2014). Qualitative and quantitative landslide susceptibility assessments in Hulu Kelang area, Malaysia. EJGE, 19(47), 545-563.
55. Sahin, E. K., Colkesen, I., & Kavzoglu, T. (2020). A comparative assessment of canonical correlation forest, random forest, rotation forest and logistic regression
methods for landslide susceptibility mapping. Geocarto International,35(4),341-363.
56. Sati, S. P., Sharma, S., Sundriyal, Y. P., Rawat, D., & Riyal, M. (2020). Geo-environmental consequences of obstructing the Bhagirathi River, Uttarakhand Himalaya, India.Geomatics,NaturalHazardsandRisk,11(1),887-905.
57. Sato, H. P., Hasegawa, H., Fujiwara, S., Tobita, M., Koarai,M., Une,H.,& Iwahashi, J.(2007).Interpretationof landslide distribution triggered by the 2005 Northern Pakistan earthquake using SPOT 5 imagery. Landslides, 4, 113-122.
58. Sepúlveda, S. A., & Petley, D. N. (2015). Regional trends and controlling factors of fatal landslides in Latin America and the Caribbean. Natural Hazards and Earth SystemScience,15(8),1821-1833.
59. SERIES-E, E. U. L. L. E. T. I. N. (2011). GeoseismologicalReportonSikkimEarthquake.
60. Singh,A.,Pal,S.,Kanungo,D.P.,&Pareek,N.(2017). An overview of recent developments in landslide vulnerabilityassessment-presentationofanewconceptual framework.InWorkshoponWorldLandslideForum,795802.Springer,Cham.
61. Singh,K.,&Kumar,V.(2018).Hazardassessmentof landslide disaster using information value method and analyticalhierarchyprocessinhighlytectonicChambaregion in bosom of Himalaya. Journal of Mountain science, 15(4), 808-824.
62. Svalova, V. B., Zaalishvili, V. B., Ganapathy, G. P., Nikolaev, A. V., & Melkov, D. A. (2019). Landslide risk in mountainareas.GeologyoftheSouthofRussia,2.
63. Vijith,H.,Krishnakumar,K.N.,Pradeep,G.S.,Ninu Krishnan, M. V., & Madhu, G. (2014). Shallow landslide initiation susceptibility mapping by GIS-based weights-ofevidenceanalysisofmulti-classspatialdata-sets:acasestudy from the natural sloping terrain of Western Ghats, India. Georisk:AssessmentandManagementofRiskforEngineered SystemsandGeohazards,8(1),48-62.
64. Yalcin,A.,Reis,S.,Aydinoglu,A.C.,&Yomralioglu,T. (2011). A GIS-based comparative study of frequency ratio, analyticalhierarchyprocess,bivariatestatisticsandlogistics regressionmethodsforlandslidesusceptibilitymappingin Trabzon,NETurkey.Catena,85(3),274-287.
65. Yawen, M. (2011). Regional scale multi-hazard susceptibilityassessment:acasestudyinMtskheta-Mtianeti, Georgia(Master'sthesis,UniversityofTwente).
66. Zhou,C.,Yin,K.,Cao,Y.,Ahmed,B.,Li,Y.,Catani,F.,& Pourghasemi,H.R.(2018).Landslidesusceptibilitymodeling applying machine learning methods: A case study from LongjuintheThreeGorgesReservoirarea,China.Computers &geosciences,112,23-37.