
International Research Journal of Engineering and Technology (IRJET) e-ISSN:2395-0056
Volume: 11 Issue: 04 | Apr 2024 www.irjet.net p-ISSN:2395-0072
International Research Journal of Engineering and Technology (IRJET) e-ISSN:2395-0056
Volume: 11 Issue: 04 | Apr 2024 www.irjet.net p-ISSN:2395-0072
Abhijit Chaudhari1, Darshan Wale2, Sulochana Dorve3 , Pankaj Khachane4
1Technical Lead, TATA Motors
Abstract
Ride and handling are the crucial factors of the suspension system. The behavior of the system is a subjective approach determined by the engineers, professionals, and driving experts. These behavioral parameters need to meet the design considerations to attain the desired ride and handling. On the other hand, the experimental approach requires development in the suspension system, leading to cost-effectiveness, and time consumption, and might not provide an optimum solution for the optimized ride and handlingbehavior.
This paper represents the optimization of the suspension geometry parameters using ADAMS/Car to obtain the desired ride and handling. A front vehicle model based on a B-segment concept vehicle is modeled by using ADAMS/Car. The vehicle front suspension model is simulated using a vertical-parallel movement test on ADAMS/Car. Samesegment vehicles with good rides and handling subjective reviews are considered for benchmarking. The resulting graphs of the benchmark vehicle suspension geometry are obtained by SPMM. Further, these results are correlated with the subjective reviews. The kinematics and compliances (K&C) of simulation are compared with the SPMM data of benchmarked vehicles. The best-fit suspension geometry curve trend for camber, caster, and toe is predicted in line with the benchmarked vehicles by changing hard points, to provide a best-fit correlation with a subjective approach. Comparing both the results, the best-fit ride and handling aregenerated.
Keywords: Suspension system, camber, caster, toe, ride and handling
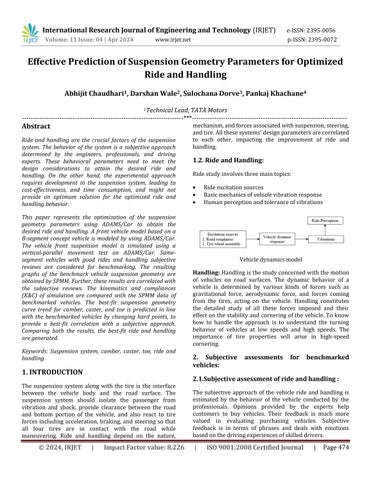
The suspension system along with the tire is the interface between the vehicle body and the road surface. The suspension system should isolate the passenger from vibration and shock, provide clearance between the road and bottom portion of the vehicle, and also react to tire forces including acceleration, braking, and steering so that all four tires are in contact with the road while maneuvering. Ride and handling depend on the nature,
mechanism,andforcesassociatedwithsuspension,steering, andtire.Allthesesystems'designparametersarecorrelated to each other, impacting the improvement of ride and handling.
Ridestudyinvolvesthreemaintopics:
Rideexcitationsources
Basicmechanicsofvehiclevibrationresponse
Humanperceptionandtoleranceofvibrations
Vehicledynamicsmodel
Handling: Handlingisthestudyconcernedwiththemotion of vehicles on road surfaces. The dynamic behavior of a vehicle is determined by various kinds of forces such as gravitational force, aerodynamic force, and forces coming from the tires, acting on the vehicle. Handling constitutes the detailed study of all these forces imposed and their effectonthestabilityandcorneringofthevehicle.Toknow how to handle the approach is to understand the turning behavior of vehicles at low speeds and high speeds. The importance of tire properties will arise in high-speed cornering.
2. Subjective assessments for benchmarked vehicles:
2.1.Subjective assessment of ride and handling :
The subjective approach of the vehicle ride and handling is estimated by the behavior of the vehicle conducted by the professionals. Opinions provided by the experts help customers to buy vehicles. Their feedback is much more valued in evaluating purchasing vehicles. Subjective feedback is in terms of phrases and deals with emotions basedonthedrivingexperiencesofskilleddrivers.
International Research Journal of Engineering and Technology (IRJET) e-ISSN:2395-0056
Volume: 11 Issue: 04 | Apr 2024 www.irjet.net p-ISSN:2395-0072
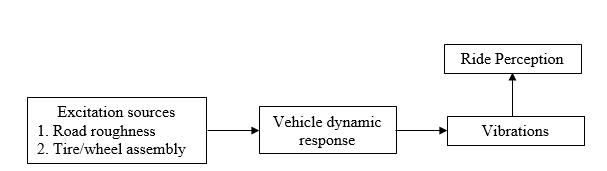
2.2.Benchmarked vehicle's subjective feedback:
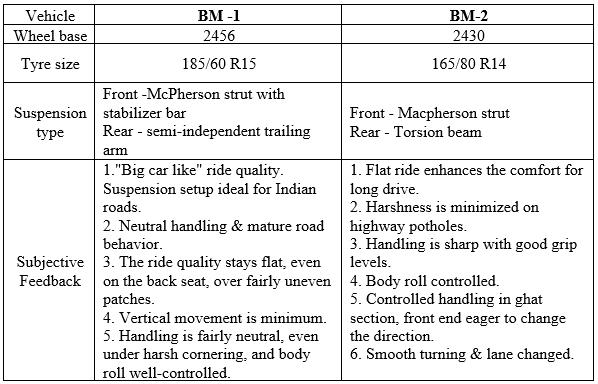
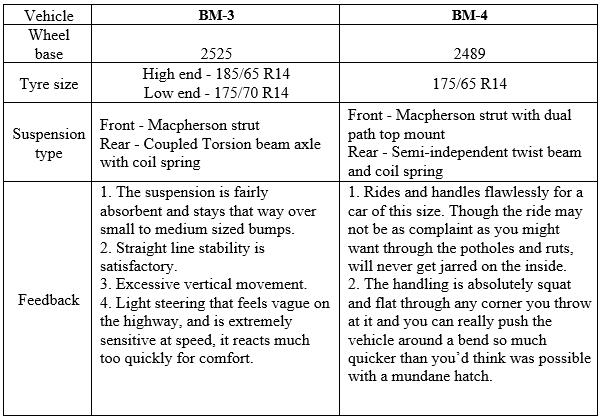
Table 1 : Benchmarked vehicles data
2.3. Suspension geometry parameters and their effects:
Ride rate: Thelargerstaticdeflection(W/Ks)isnecessary for lower undamped natural frequencies. That is why ride rate or suspension stiffness should be less for a good ride. Acomparisonofthe ride rateof benchmarkedvehicles for frontsuspensionisasbelow,
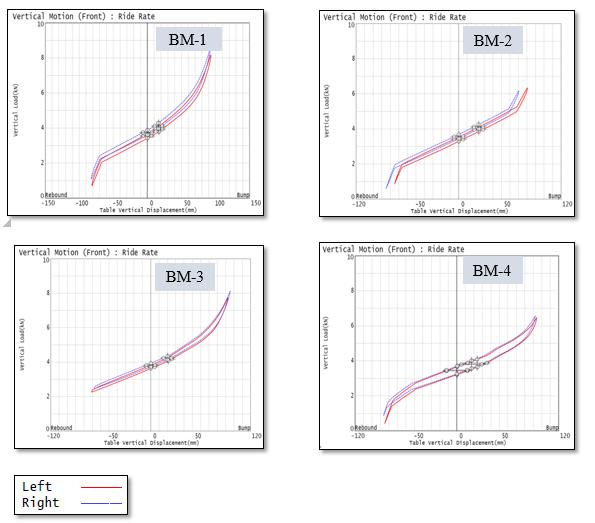
Fig.1. Ride rate graph for benchmarked vehicles
2.3.1. Benchmarked vehicle camber change curve:
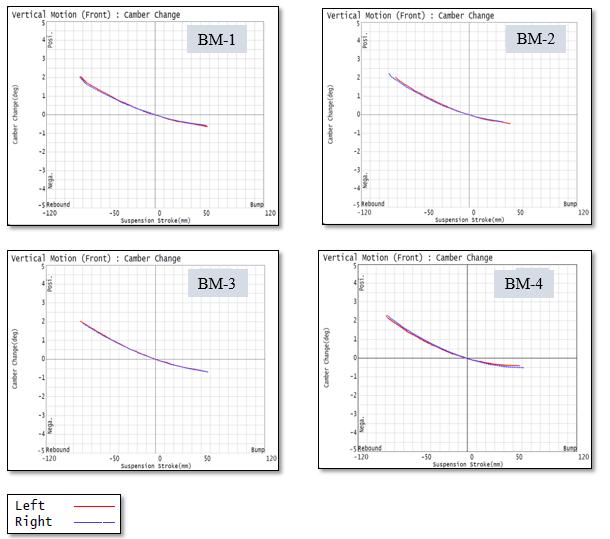
Fig.2. Camber change graph for benchmarked vehicles
International Research Journal of Engineering and Technology (IRJET) e-ISSN:2395-0056
Volume: 11 Issue: 04 | Apr 2024 www.irjet.net p-ISSN:2395-0072
2.3.2. Benchmarked vehicle toe change curve:
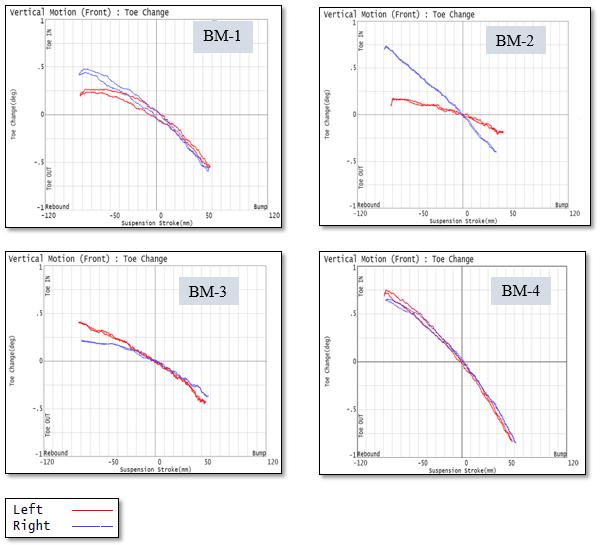
Fig.3. Toe change graph for benchmarked vehicles
2.3.3. Benchmarked vehicle caster change curve:
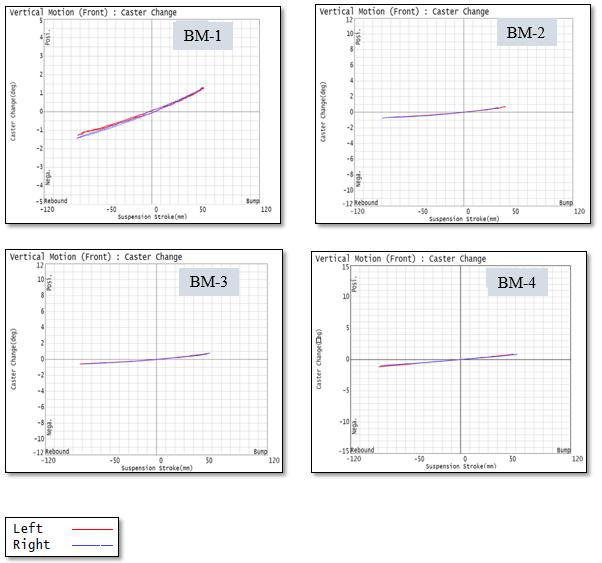
Fig.4. Caster change graph for benchmarked vehicles
3. Front suspension modeling and analysis in ADAMS/Car: To study the behavior of suspension geometry parameters, a multi-body model of a concept vehicle is modeled in ADAMS/CAR. Different sub-systems
of concept vehicles, such as suspension systems, steering systems, and wheels, were built according to the specifications and assembled to carry out the simulations. ThedatausedtobuildthemodelisshowninTable1.
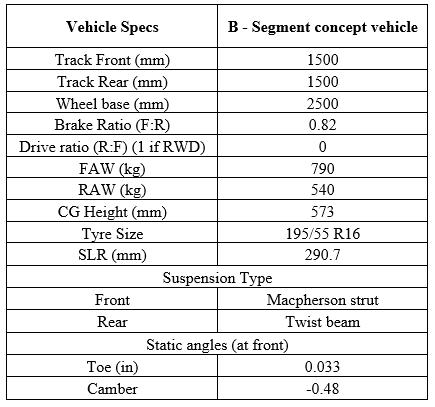
Table 2: B-segment concept vehicle specification
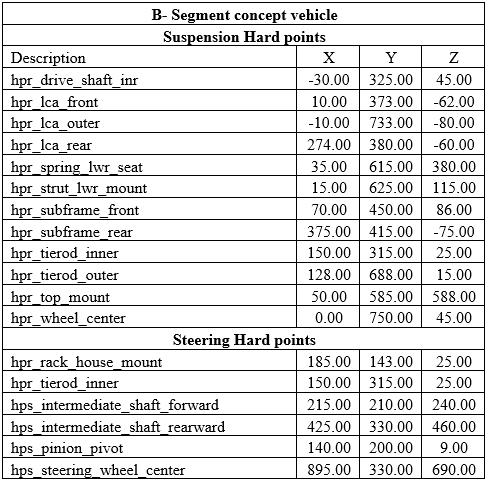
Table 3: B-segment concept vehicle hard points
International Research Journal of Engineering and Technology (IRJET) e-ISSN:2395-0056
Volume: 11 Issue: 04 | Apr 2024 www.irjet.net
3.1 Analysis of front suspension:
The following steps are performed to simulate suspension analysis.
Step 1: Hard points considered in suspension and steering template:
The following hard points are considered for preliminary studyandtomakealayoutofthefrontsuspension.
Step 2: Hard points updated to match with specified hard points:
Suspension hard points:
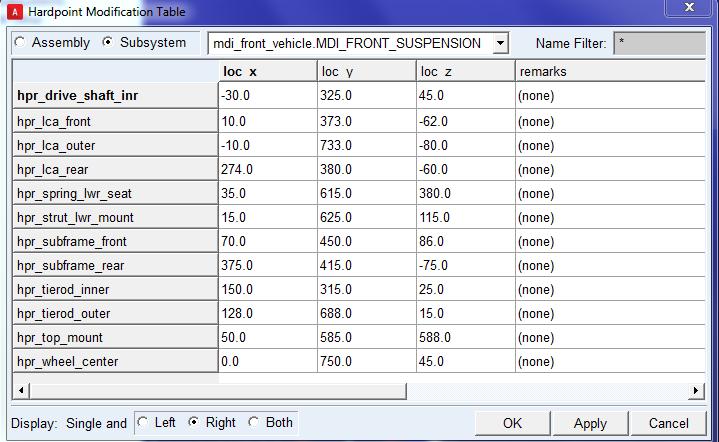
Fig.5: Suspension template and sub-system hard points updated
Steering hard points:
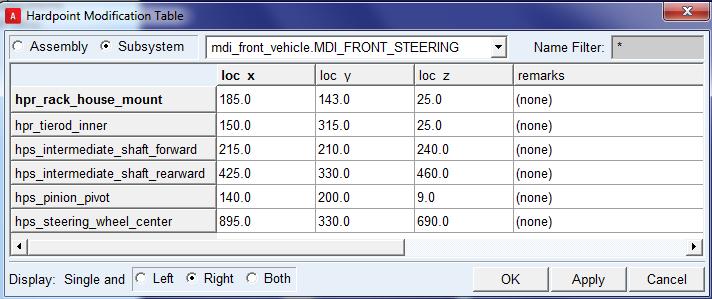
Fig.6: Steering template and sub-system hard points updated
Step 3: Suspension analysis:
Pre-requisites for suspension analysis, setting up the suspensionproperties:
Before performing a suspension analysis, the setup parameters of the vehicle are specified. These parameters
p-ISSN:2395-0072
include the vehicle's wheelbase and sprung mass, whether or not the suspension is front or rear-wheel drive, and the braking ratio. For this analysis, the suspension properties are set as mentioned in the topic discussed earlier. Parameters to indicate front-wheel drive and a brake ratio of82%frontand18%rearareassigned.
Therearetwotypesofsuspensionanalysisperformed:
1. Parallelwheeltravel
2. Rolloroppositewheeltravel
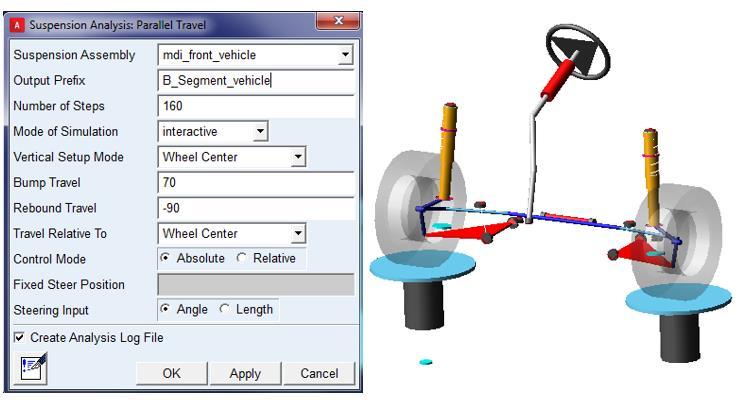
1. Parallel wheel travel :
For parallel wheel travel, both wheels are traveled from rebound to bump by keeping the steering fixed. Required parameters for suspension analysis for parallel wheel travel are filled. Where 70mm bump travel and 90mm rebound travel are provided, note that the rebound travel should be provided with a negative value. Wheel travels are provided relative to the wheel center or contact patch.

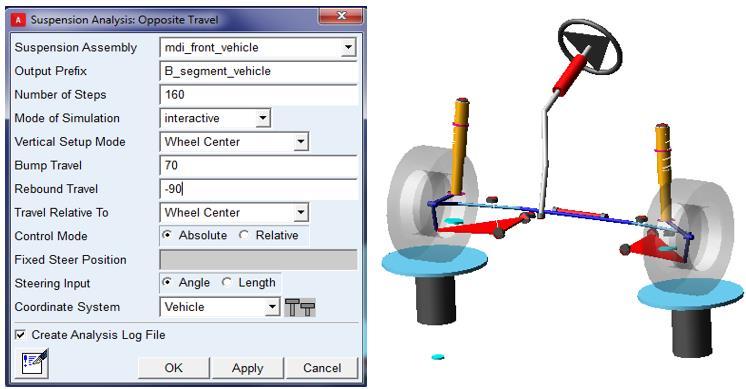
2. Opposite wheel travel:
Along similar lines to the above analysis, an opposite-wheel travel analysis was conducted. In this analysis, when one wheel goes in a bump the other wheel simultaneously goes in rebound. This analysis is performed to simulate the roll behavior ofthevehicle.Thisisopposite-wheeltravel.
International Research Journal of Engineering and Technology (IRJET) e-ISSN:2395-0056
Volume: 11 Issue: 04 | Apr 2024 www.irjet.net

Step 4: Plotting results
After performing analysis results are plotted for suspension geometry parameters with respect to wheel travel to find out the change and nature of parameters at the desired position of the wheel during wheel travel. The best-fit curve for the suspension geometry parameters is obtained by performing above mentioned steps with the change in hard points. In this project, the effective prediction of suspension geometry parameters done by changing hard points is covered. The following iterations areperformedto findoutthebest-fitcurveforsuspension geometryparameters.
Analysis and results for front suspension assembly
With reference to the suspension and steering subsystems from the benchmarked vehicle, modeling of the front vehicle assembly is done. In this section, parallel wheel travel analysis and the results are plotted to find out the best-fitcurveforsuspensiongeometryparameters.
Preliminary analysis, Iteration 1:
In this section, we are using hard points from the basic provided layout and will perform analysis. Results will be plottedtostudythenatureofsuspensiongeometrycurves. Thesuspensiongeometrycurvesarecomparedandstudied with respect to the ideal curve nature and also with the trendsofbenchmarkingvehicles.
Hard points:
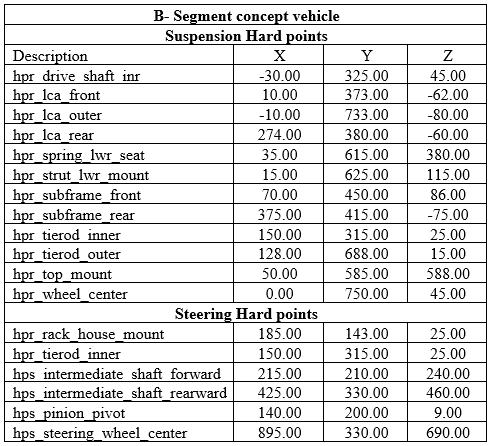
Table 5: Iteration 1 hard points
Analysis performed:
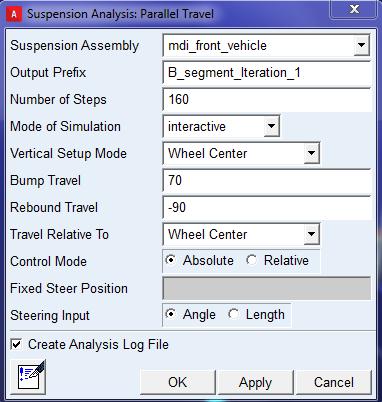
Parallel wheel travel analysis: Iteration1
International Research Journal of Engineering and Technology (IRJET) e-ISSN:2395-0056
Volume: 11 Issue: 04 | Apr 2024 www.irjet.net p-ISSN:2395-0072
Results plotted:
Camber change:
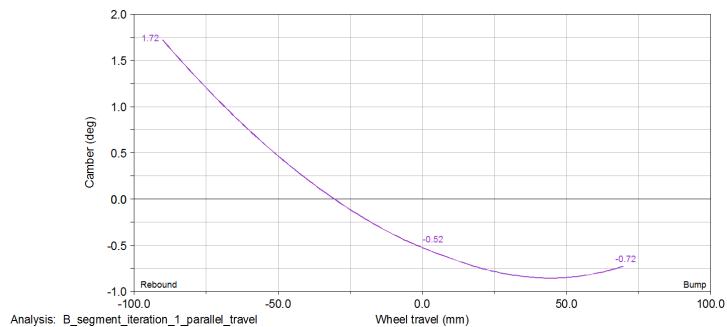

Fig.10: Camber changes with respect to wheel travel for Iteration 1.
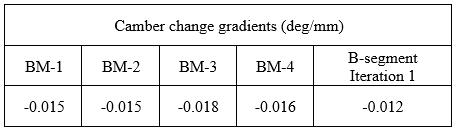
Table 6: Camber change gradient for iteration 1
Thetrendofcamberchangewithrespecttowheeltravelis similar to the ideal curve, but the camber change gradient shows a lesser value. The Camber curve needs to be improved,hencehardpointsneedtobechanged.
Caster change:
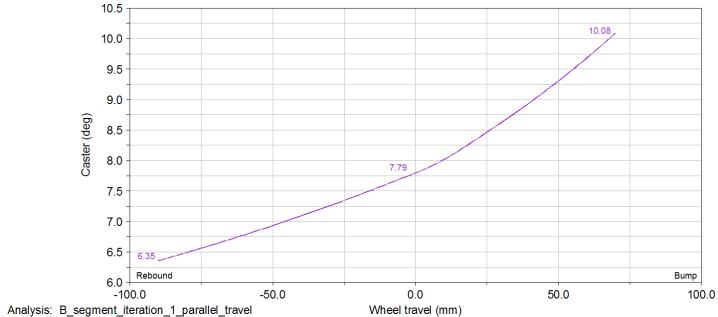

Fig.11: Caster change with respect to wheel travel for Iteration 1.
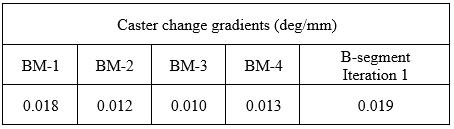
Table 7: Caster change gradient for iteration 1
The trend of caster change with respect to wheel travel is similar to the ideal curve, and also the caster change gradient is in line with the benchmarked vehicles, but the caster has having large value. The caster curve needs to be improved,hencehardpointsneedtobechanged.
Toe change:
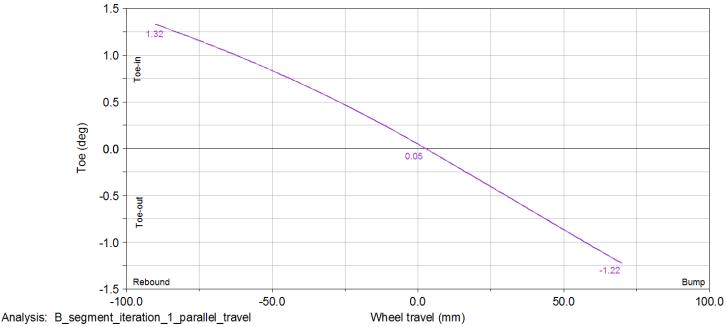
Fig.11: Toe change with respect to wheel travel for Iteration 1.
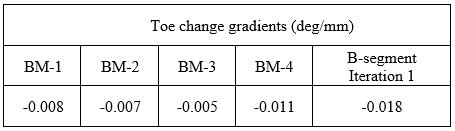
Table 8: Toe change gradient for iteration 1
The trend of the change with respect to wheel travel is similartotheidealcurve,butthetoechangegradientshows a higher value. The toe curve needs to be improved, hence hardpointsneedtobechanged.
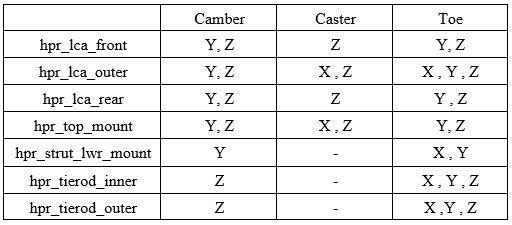
Suspension layout updating with change in hard points:
As per the above results toe change and camber change show a similar trend to that of the ideal curve, but the toe change gradient and camber change gradient are showing higher and lesser values in comparison to benchmarked vehicles respectively. To achieve the best-fit curve trend both curves need to be improved, hence affecting hard points needs to change. The following table shows, hard points and their coordinates affecting the suspension geometryparameters.
Volume: 11 Issue: 04 | Apr 2024 www.irjet.net p-ISSN:2395-0072
In reference to the above discussion, iterations were performedtoenhancethecamber,caster,andtoetrendsof the vehicle. Table 10 shows the change in hard points for iteration1anditeration2respectively.
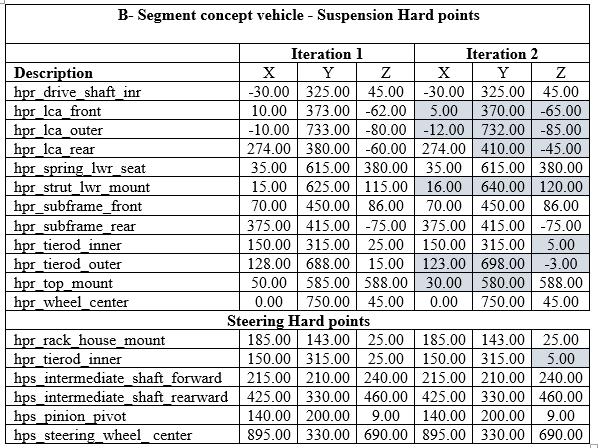
Table 10: Changed hard points
Camber change:
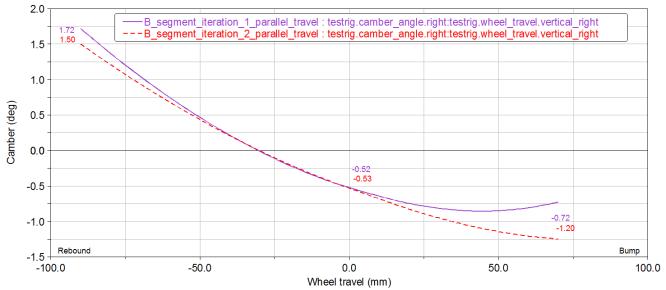

Fig.12: Camber changes with respect to wheel travel: best-fit curve.
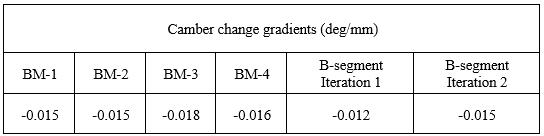
Table 11: Camber change gradient
Fig. 12 represents the camber change curve for all iterations. The trend of camber change with respect to wheel travel for all iterations is similar to the ideal curve. The camber change gradient is improved in iteration 2, comparedtothatofiteration1.Camberchangegradientand trendareachieved bychanging hpr_lca_frontinz(from -62 to-65),hpr_lca_reariny(from380to410),andinz(from60 to -45), hpr_tierod_inner in z (from 25 to 5) and hpr_tierod_outerinz(from 15to-3).Theresultshowsthat the camber change gradient in iteration 2 is in line with a range of benchmark values. This is the optimized camber curveinpackagingprospectaswellasinhandlingprospect.
Caster change:
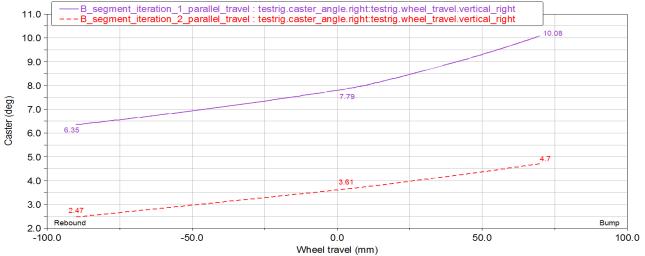

Fig.13: Caster change with respect to wheel travel: bestfit curve.
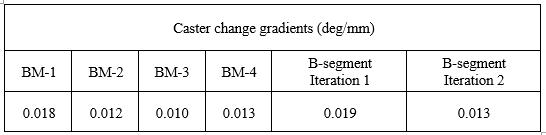
Table 12: Caster change gradient
Fig.13 represents the caster change curve for all iterations. The trend of caster change with respect to wheel travel for alliterationsissimilartotheidealcurve.Thecasterchange gradient in iteration 2 is in line with the benchmarking value range. This change is a result of changing hpr_lca_outer in x (from -10 to -12) and in z (from -80 to85) and hpr_top_mount in x (from 50 to 30).Fig.37 shows that the caster change curve in iteration 2 is shifted to the desired range of caster values and this is the optimized caster curve in the packaging prospect as well as in the handlingprospect. International Research Journal of Engineering and Technology (IRJET) e-ISSN:2395-0056
International Research Journal of Engineering and Technology (IRJET) e-ISSN:2395-0056
Volume: 11 Issue: 04 | Apr 2024 www.irjet.net p-ISSN:2395-0072
Toe change:
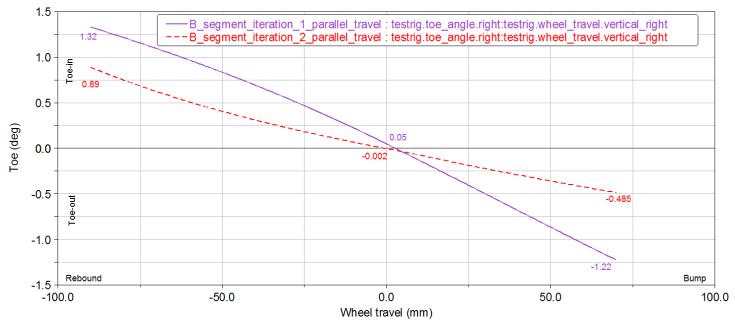

Fig.14: Toe change with respect to wheel travel: best-fit curve.
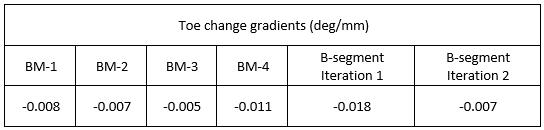
Table 13: Toe change gradient
Fig.14 represents the toe change curve for all iterations. Thetrendofthechangewithrespecttowheeltravelforall iterations is similar to the ideal curve. The toe change gradient is improved in iteration 2, compared to that of iteration 1. Toe change gradient and trend is achieved by changing hpr_tierod_inner in z (from 25 to 5), hpr_tierod_outer in z (from 15 to -3), hpr_lca_front in z (from -62 to -65), hpr_lca_rear in y (from 380 to 410) and inz(from-60to-45).Theresultshowsthatthetoechange gradientiniteration2isinlinewitharangeofbenchmark values.Thisistheoptimizedtoechangecurveinpackaging prospectaswellasinhandlingprospect.
Kinematicanalysiswasperformedonthebasiclayouthard points. The nature of graphs obtained from the results for suspensiongeometryparametershavebeenstudied.These graphs are compared with the benchmarked vehicle curve trends. Itiseasierto predictthevehiclehandling behavior virtuallyattheprimarystageofthehardpointfinalization. The number of iterations performed by ADAMS/Car analysis to finalize the set of hard points. The study of change in hard points in iterations indicates that a slight changeinthevalueofaffectinghardpointsmentionedhave a significant change in toe followed by camber and caster change. The suspension geometry parameters curve achieved in the final iteration are similar to benchmarked vehicles which were selected based on the subjective reviews.
The final iteration of hard points and suspension geometryparameterscurvesare matching withthedesired results and characteristic. Thus, it has been concluded that the suspension geometry parameters curves achieved in Iteration 2 are best-fit curves for the derived hard points set. Setting these hard points and suspension geometry parameters curve trend will give effective results for optimizedrideandhandlingofB-segmentconceptvehicleat thevirtualcondition.
1. A book, Thomas D. Gillespie, “Fundamentals of Vehicle Dynamics”, “Society of Automotive Engineers”,Inc.thirdedition,1997.
2. A book, Prof. Jornsen Reimpell, “The Automotive Chassis: Engineering Principles”, ButterworthHeinemannpublication,SecondEdition,2001.
3. Abook,MauriceOlly,“ChassisDesign:Principleand analysis”, “Society of Automotive Engineers, Inc.”, FirstEdition,2002.
4. A Conference paper, in 11th world congress on structural and multidisciplinary optimization, 7th12th may2015heldatSydney,Australia: “Simulation and Optimization of MPV Suspension System Based on ADAMS”, by Dongchen Qin, Junjie Yang,QiangZhu,PengDu.
5. A conference paper, in 2nd International ConferenceonResearchinScience,Engineeringand Technology (ICRSET’2014), March 21-22, 2014 Dubai (UAE) on “Model Building, Hardpoint Optimization&ExperimentalCorrelationofaSingle Seater EV- Toyota COMS", by Husain Kanchwala, WuNan,andHarutoshiOgai.
6. A journal paper, Nurzaki Ikhsan, Rahizar Ramli, Anuar Alias, “Analysisof kinematic and compliance of passive suspension using ADAMS/Car”, Jurnal Teknologi, eISSN 2180-3722, 75:8 (2015), pp: 5994.
7. A journal paper, S.Pathmasharma, J.K.Suresh, Viswanathan and Subramanian, “Analysis of Passenger Car Suspension System Using Adams”, IJSETR,Vol.2,ISSN:2278-7798,issue5,2013.
8. A journal paper, Chetan S. Jadhav, Jignesh R. Gautam, "Multibody dynamic analysis of the suspension system using ADAMS", IJSRD, Vol.2, Issue03,2014.
International Research Journal of Engineering and Technology (IRJET) e-ISSN:2395-0056
Volume: 11 Issue: 04 | Apr 2024 www.irjet.net p-ISSN:2395-0072
9. A journal paper, Arindam Pal, Sumit Sharma, Abhinav Jain, C.D.Naiju, “ Optimized Suspension DesignofanOff-RoadVehicle",IJES,Vol.2,issue6, pp.57-62,2013.
10. A journal paper, Darshan Vijay Wale, “Modelling and Simulation of Full Vehicle for Analyzing Kinematics and Compliance Characteristics of Independent (Macpherson strut) and SemiIndependent (Twist Beam) suspension system”, IOSR-JMCE,ISSN:2278-1684,PP:16-20.
11. A journal paper,Dhara Vadodaria,Prof. S.C.Jain, Dr.Pushpendra Sharma, "Analysis of a quarter model of McPherson and modified suspension system",IJARSE,Vol.No.3,Issue8,2014.
12. A technical paper, Wolff, Klaus, Hoppermans, Jannis, Kraaijeveld, Rob, “Objective evaluation of subjective driving impressions: F2008-03-019, FEVMotorenTechnikGmbH,Germany.
13. A technical paper on, R. P. Rajvardhan, S. R. Shankapal, S. M. Vijaykumar, “Effect of wheel geometry parameters on vehicle steering”, M.S. Ramaiah School of Advanced Studies, Bangalore 560054.
14. Cristina Elena Popa, "Steering System and Suspension Design for 2005 Formula SAE-A Racer Car", research work submitted to University of Southern Queensland Faculty of Engineering and SurveyinginOct-2005.
15. Miłosz Kowalik, “Full analysis of suspension geometry and chassis performance of Formula Student racing car”, master thesis, Instituto SuperiordeEngenhariadoPorto,2014.
16. Erik Wendeberg, "Using optimization to autocorrelate suspension characteristics to K&C measurements", master thesis, the Chalmers UniversityofTechnology,Sweden,2013.