
International Research Journal of Engineering and Technology (IRJET) e-ISSN: 2395-0056
Volume: 11 Issue: 04 | Apr 2024 www.irjet.net p-ISSN: 2395-0072
International Research Journal of Engineering and Technology (IRJET) e-ISSN: 2395-0056
Volume: 11 Issue: 04 | Apr 2024 www.irjet.net p-ISSN: 2395-0072
Shraddha Sharma1 , Prof. Seema Pal2
1 Dept. of Electrical Engineering, Jabalpur Engineering College, Jabalpur, Madhya Pradesh, India
2Assistant professor, Dept. of Electrical Engineering, Jabalpur Engineering College, Jabalpur, Madhya Pradesh, India
Abstract - Smart meter is an advanced metering infrastructure (AMI) that includes a smart meter, a bidirectional communication network, and a data management system. Using data analytics and machine learningtoevaluatehigh-frequencysmartmeterdatayields important insights into home power consumption trends, as well as improved load forecasting and demand response management implementation. In this study, Principal Component Analysis (PCA) is employed as a dimensionality reduction technique to extract features from a dataset collected from the UMassTrace repository. The K-means unsupervised partitional clustering algorithm uses three distance metrics to cluster reduced data: Euclidean, Manhattan, and Pearson correlation distances. MATLAB programming software is used to do feature computation and clustering. The clustering model is evaluated by obtaining the average silhouette coefficient. Euclidean distance is obtained to perform best with better average silhouettecoefficient,indicatingthatdatapointsinacluster are compact and far apart from other clusters, making distance measurement preferable for clustering consumer loadprofilesforbetterdemandsidemanagement.
Key Words: Smart meters, Dimensionality reduction, PCA, K-means, Manhattan distance, Euclidean distance, Pearson correlation distance, Average silhouette coefficient, Demand response management
Advanced metering infrastructure(AMI) whichcomprises ofsmartmeter,bidirectionalcommunicationnetworkand data managementsystemarebeingincreasinglydeployed in recent years. They have significant role by providing benefitstoendconsumers,networkoperatorsandenergy suppliers. Smart meters offer range of functions such as advance metering, control, data storage and communication technologies .It helps consumers by providing them near real time consumption patterns which help them to manage their energy usage, reduce greenhousegasesemissionandsavemoney[1].Itimproves demandmanagement,networkplanningandoperationby providing accurate demand forecast ,locate outages and shorten supply restoration time, reduce operational and maintenance costs of network and improve asset utilization in distribution[2][3]. Smart meters generate
enormous amount of high frequency data, which exhibits the characteristics of Big data i.e. velocity, volume, variability, variety and value thus, require a robust communication infrastructure for data processing and storage at utility end. This data being highly dimensional in nature, greatly impacts the analysis and deduction process making it less efficient due to curse of dimensionality. This challenge necessitates the use of dimensionalityreductionalgorithmsortechniques.
Dimensionality reduction techniques convert high dimensionaldatatoreduceddimensionwithoutthelossof significantinformation. Thesetechniqueswhenemployed reduces the computational complexity associated with smart meter data, as every data obtained from smart meters are not helpful in drawing useful conclusions[4]. Onceconvertedtolowerdimensionality,thesedatacanbe used by consumers and utility operators to deduce important results and understand energy consumption trends,anomalydetection,energytheftandbetterdemand sidemanagement.
Energy consumption behaviors of individual consumers are used by utility for improving better demand side management. It selects the appropriate number of consumerstoparticipateandpresentprecisedataonpeak energy consumers. Clustering is used to group the load profile of different types of consumers in a distribution network. The main basis of clustering is to group load profile in different clusters with minimum intra-cluster distance or maximum intra-cluster similarity and maximuminter-clusterdistanceorminimuminter-cluster similarity.Thetwobroadcategoriesofclusteringmethods are hierarchical and partitional clustering methods. Hierarchical clustering groups the load profile into different clusters by generating nested partitions [5].In Partitional clustering method each cluster is represented byitscenterwhichsummarizesalltheloadprofilepresent in the cluster. The main focus is to optimize the objective function, whichis the distance betweenthe centerandall theloadprofiles.
In this paper, PCA has been used for dimensionality reduction and k -means partitional clustering method for clustering of different consumer profile. An evaluation index, silhouette coefficient is used to compare the
International Research Journal of Engineering and Technology (IRJET) e-ISSN: 2395-0056
Volume: 11 Issue: 04 | Apr 2024 www.irjet.net p-ISSN: 2395-0072
clustering done using the three different distance measures Euclidean, Pearson correlation and Manhattan distanceforbetterdemandsidemanagement.
A fairly comprehensive comparison and study of several clustering approach is available in[6]. The research [7] demonstrate the need for caution while obtaining data from time series in order to support the statements made in relation to the findings of an empirical assessment. Although[8] [9] [10] have examined clustering, no assessment of the quality of the resulting clusters which has to do with the clustering strategy chosen has been done, the distance measure under investigation, and a study and explanation of the forms of the resulting distinctive load profiles. In[11] , the daily and segmented load profiles are clustered using K-means clustering algorithm to offer a load estimation technique using four metrics for distance –the Pearson, the Euclidean, Manhattan and Canberra correlations are examined.[12] Compared the clustering findings from four different techniques-random forest, KNN, decision tree, and ANN in order to forecast which consumer would be suitable for demand response management based on the analysis of smart meter data. In[13]comparative analysis between kmeans and k -medoids technique is done to identify different energy behavioral groups and apply different pricing rules based on consumption time weekend conditions.Inanotherstudy[14],k-meansalongwithother techniquesusingdifferentdistancemeasuresuchascosine, Euclidean, correlation and Manhattan are used to cluster consumptionpatternsbasedonpeakpositionwhichcanbe identifiedashurtfulmomentsoftheday.
In this section a review on dimensionality reduction techniquesandclusteringalgorithmhasbeendone.
Theprocessoftransforminghighdimensionaldatainto a suitable representation with fewer dimensions isknown as dimensionality reduction. These dimensionality reduction algorithms can be categorized as supervised, unsupervised and semi-supervised. Supervised algorithms involve labeling a training set of known data .a reliable prediction for the data classes is done using this. Algorithms under this category are linear discriminant analysis (LDA)[15], independent component analysis (ICA)[16], and support vector machine (SVM)[17] and kernelprincipalcomponentanalysis(PCA).
Unsupervised techniques use unlabeled data to find structure. unsupervised dimensionality reduction techniques include Singular value
decomposition(SVD),PCA and ICA .Generally ,because labeling data is expensive ,the quantity of labeled data is constrained ,whereas unlabeled data is more readily available. Semi-supervised algorithms include efficient utilizationofbothlabeledandunlabeleddata[18]
PCA is one of the most widely used algorithms and is regardedasthebestlineardimensionreductionmethodas it reduces the mean square error .PCA seek to locate a linear subspace of reduced dimension d from a given datasetofdimensionDsuchthatthedatapointsprimarily lie on it given a collection of data on D-dimension. The principal components (PC), a new coordinate system constructedbydorthogonalvector,makeupthedecreased dimension. The linear combination utilizing the vectors linkedtothehighestvarianceisthefirstPC.ThesecondPC, which is either orthogonal to the first PC or uncorrelated withthesecondhighestvariance,isthelinearcombination of the vectors corresponding to that PC. The same linear formula is used to build other PCs different vectors that represent variations ranging from highest to lowest. Typically,alargenumberofPCsareobtained,butmajority of the variance is explained by the first few PCs and less dominant PCs can be ignored. Hence more energy is concentratedinthelowersubspaces.
The Eigen value decomposition of data covariance matrixisrepresentedby[19]:
E X XT=E λ I (1)
To project the data into lower subspace, the Eigen vector corresponding to the most important Eigen value areusedafterdecompositionasfollows[19]:
XN×dPCA =XN×d ED×d (2)
Cumulativevarianceisgivenby[19]: ( ) Here,D>k (3)
3.2.
K-MeansClustering
An unsupervised learning approach called k-means divides N×D matrix into k clusters. The algorithm’s objective is to reduce the distance between the cluster’s core and all of its data points. This is referred to as “local optimawithinclustersumofsquares”[20].Everydatapoint within a cluster is highly similar as indicated by the pairwise distances between each point and its center. The objectivefunctionisgivenasfollows[21]:
(4)
International Research Journal of Engineering and Technology (IRJET) e-ISSN: 2395-0056
Volume: 11 Issue: 04 | Apr 2024 www.irjet.net p-ISSN: 2395-0072
Ui =vectorthatrepresentstheith user,i=1,2,3…..N
= vector representing the jth cluster center, j = 1, 2, 3……N
DimensionofeachuserUi =[Ui(k),k=1,2,3...D]. Thejth cluster center also has dimension of μj =[μj(k) ,k =1,2,3….D].Typically, the cluster μj for j=1,2,3….k are first inferred,ideallyarandomdatapointsarechosenfromthe dataset .Every centroid μj categorizes the data points Ui such that the distance between data point Ui and all its k centroid is minimum. Euclidean, correlation, city block, hamming and other methods are used to estimate this distance and the center μj is updated to represent the averageofUi containedwithintheclusters.
Inthispaper,thehighdimensionalsmartmeterdataset is reduced to obtain the important and pragmatic informationfromthereduceddimension.Thereduceddata is then used to group the residential consumers based on their consumption patterns for better analysis of load profile.Thesmartmeterdatasetusedinthispaperisfrom UMassTraceRepository [22]. This dataset contains energy consumption for 443 buildings over the same 24 hour period. The sampling rate is 1 sample per minute. In order to guarantee that data are similar, distance assessment is crucial. This is done in order to ascertain whichsystemsdataaresupposedtoberelatedto,whether they are similar or not, and what distance measurements are required in order to compare them. The ability to determine a quantitative score of the degree of similarity or dissimilarity of the data (proximity measure) plays a crucialroleintheclusteringprocess.Therefore,inorderto determinewhichmethodisbest,itisnecessarytocompare some of the commonly used methods, namely Euclidean, Manhattan and Pearson distance with a combination of min-maxnormalization.
EuclideanDistance:Onemethodformeasuringthe distance between two pieces of data in Euclidean space is the Euclidean distance (including fields Euclidean two dimensions, three dimensions, or more). Using the following formula [23] one can assessthedegreeofsimilarity:
D= distance between i and j, I as the cluster data centerjontheotherattribute, k symbolof eachdata, n the amountofdata, xik isthedataintheclustertobek,and yik isthedataontheeachdatato k.
Manhattan (City Block) Distance: The Manhattan (city block) distance is calculates the absolute differencebetweenthecoordinatesoftwoobjects.
The formula used to calculate the distance is as follows-
Pearson correlation distance: this measure is a dissimilarity measure rather than an actual distance metric. It is derived from the Pearson correlationcoefficientasfollows[24]:
Pearsondistance=1-r (8) r= ( )( ) √ ( )
r=correlationcoefficient
Meanofthevaluesofthexvariable
Meanofthevaluesoftheyvariable
ClusteranalysisTechnique–processofgroupingdatais done through general stages of the k-means clustering algorithm which includes normalization of data. In this paper, the data has been normalized using min-max normalizationtechnique.
AccordingtoMin-MaxNormalization
Normalizeddata(X')= ( ) ( ) ( ) (10)
X'isthenormalizeddata,xisthedatapercolumnmin (a) and max (a) are the minimum and maximum value of data per column. In k-means the number of clusters and each cluster is assigned a centroid (cluster center) randomly.Clustersareassignedtodata,basedondistance calculation between the data and the centroid of each cluster; here we have used Euclidean, Manhattan and Pearsoncorrelationdistanceasdistancemetric.Everytime when a data is assigned to a cluster, the centroid of the cluster is again updated and the same clustering process goes ontill,thecentroidisnot changinganymore orsame set of data are obtained in clustering process or max iterationhavereached.
As a means of criteria to estimate the performance of each distance metric, average silhouette coefficient is calculated.SilhouetteCoefficientcanbecalculatedthrough followingequation: ( ) ( ) ( ) ( ( ) ( )) (11)
S(i)isnormalizedsilhouettecoefficient
b(i)istheaveragedistanceofthedatainoneclusterto allthedatapointsinotherclusters
a(i)istheaveragedistanceofthedatainaclustertoall theotherdatapointsinthesamecluster
International Research Journal of Engineering and Technology (IRJET) e-ISSN: 2395-0056
Volume: 11 Issue: 04 | Apr 2024 www.irjet.net p-ISSN: 2395-0072
The value of silhouette coefficient varies from -1 to 1, with -1 representing wrong clustering, 0 representing the same clustering i.e. no variation in clustering even if different distance measures are used and 1 representing thebestclustering.
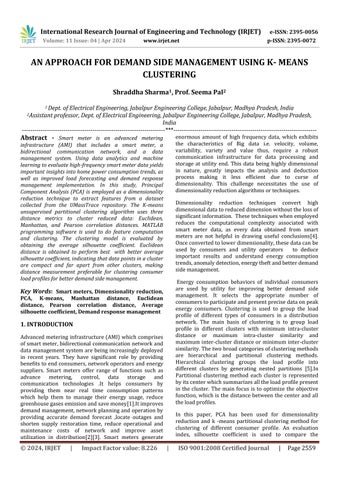
Theapproachinthispaperentailsdecreasingthesmart meter dataset and extracting useful information from the reduced dimensions. The paper focuses on reducing the dimensionality of smart meter data obtained from the UMassTrace Repository. This data set tracks the energy consumption in 443 buildings over a 24-hour period .The sampling rate is 1 sample per minute. Figure 1 shows the energyconsumptionplotofarandomuser.
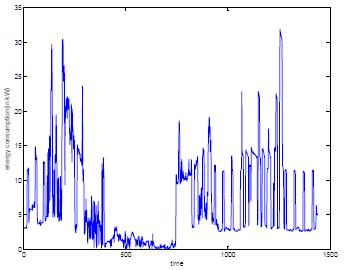
Fig-1: Energyconsumptionusageofarandomconsumer
The principal components range from 11400 to 1400 based on the Eigen vectors arranged in decreasing order. ThetestanalyzesenergyusagedatausingMATLAB.Figure 2displaysthecumulativevarianceobtainedusingPCA.The firstPCpreserves93.6689%ofthevariance.AtaPCof350, 100% of the variance remains unchanged .This analysis suggests that a reduced dataset of matrix with 443 rows and350columnsissufficientfordemandsidemanagement applications to give pricing information to individual consumers. This reduces the redundancy prior to clustering to gather important information. It is observed that PCA performs better in terms of accuracy and precisionasthedimensionalityreductionsizeincreases.
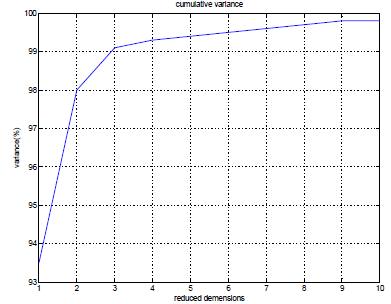
Fig-2: Cumulativevarianceofreduceddimensions
K –means technique is used for the clustering of consumer feature set, since clustering approaches use distance to calculate cluster sets, so high value characteristics are given higher weightage .To circumvent this,thedataisstandardizedusingmin-maxnormalization techniques .Figure 3 and Figure 4 shows the plot of data beforeandafternormalizationof52consumersamples.
Fig-3: Scatterplotofdatapointsbeforenormalization
Fig-4: Scatterplotofdatapointsaftermin-max normalization
International Research Journal of Engineering and Technology (IRJET) e-ISSN: 2395-0056
Volume: 11 Issue: 04 | Apr 2024 www.irjet.net p-ISSN: 2395-0072
Clustering is performed for k=7 using Euclidean, Manhattan and Pearson correlation distances. It is observed that same consumer profile is assigned to different cluster when the distance measure used for clustering is changed. To find out which distance measure results in better clustering of the consumer profile, an evaluation index, average silhouette coefficient is calculatedusingdistancemeasuresshownintablebelow-
Table-1:Averagesilhouettecoefficientcalculation
Itcanbeobservedfromthetablethatthereisincrease in the silhouette coefficients of the respective distance metrics after the normalization of data. Hence, results in better clustering. Also, the effect of outliers is decreased whendata isnormalizedwhichincreasestheperformance of PCA and clustering process and improved results are obtained. Figure 5, Figure 6 and Figure 7 represent the averagesilhouettecoefficientsfork=7usingEuclideanand Manhattan distance and Pearson correlation distance as distancemetricrespectively.
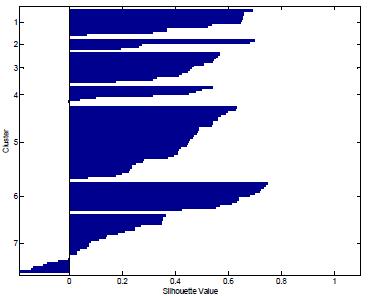
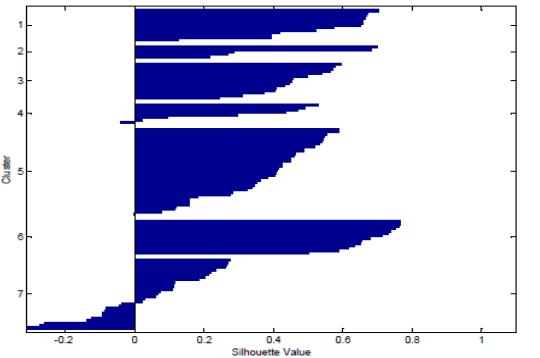
The calculation of average silhouette coefficient for all therespectivedistancemeasuresdepictsanincreaseinthe average silhouette coefficient after the normalization of datarepresentingimprovedclustering.Higherthevalueof silhouette coefficient, higher is the intra-cluster similarity and inter-cluster dissimilarity. It can be inferred from the tablethatEuclideandistanceshowsthehighestincreasein the silhouette coefficient 0.3539 to 0.3760 while for Pearson correlation distance it increases from 0.3057 to 0.3546 and Manhattan showing the least average silhouettecoefficientvaluefrom0.2163to0.2422.
International Research Journal of Engineering and Technology (IRJET) e-ISSN: 2395-0056
Volume: 11 Issue: 04 | Apr 2024 www.irjet.net p-ISSN: 2395-0072
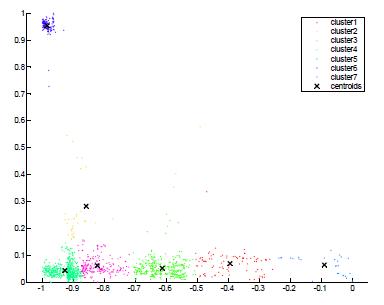
Fig-8: K-meansclusteringusingEuclideandistance
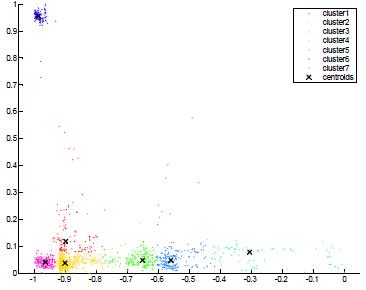
Fig-9: K-meansclusteringusingManhattandistance
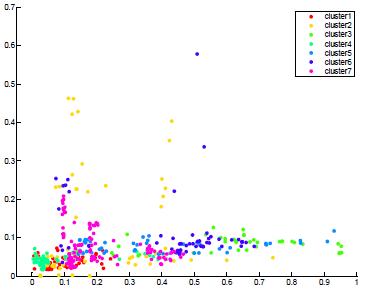
Fig-10: K-meansclusteringusingPearsoncorrelation distance
To calculate the accuracy of the clustering the root mean square error is calculated using the silhouette coefficient obtained before and after normalization using bothdistancemetric.RMSEandaccuracyisfoundouttobe 0.0624 and 93.75% for Euclidean, 0.15 and 85.47% for Pearson correlation and 0.119 and 82.02% for Manhattan distancerespectively.
Table -2:Rootmeansquareerrorcalculation
Distance
The available gap between demand and supply is expanding due to the increase of electrical equipment, resulting in an electricity deficit during peak hours. Demandsidemanagementtechniquesboostthepossibility to capitalize on consumption fluctuation, lowering peak power demand. Shifting loads from peak to off-peak or turning off partial loads during peak hours can be problematicforsomecustomers;however,leveragingtheir consumption patterns through clustering results in more flexible DSM techniques. In this study, we used PCA as a dimensionality reduction technique to reduce the dimensions of a smart meter dataset from UMassTraceRepository from 1440 to 350 while retaining allkeyinformationandthemaximumvarianceofthedata. The reduced dataset is clustered using k-means clustering (k=7),withManhattan,Euclidean,andPearsoncorrelation distances used as distance metrics. However, clustering with the Manhattan distance as a distance metric enables robust clustering, particularly when data has a high dimensionality and the impact of outliers or extreme values must be minimized. The average silhouette coefficient serves as the clustering validation index. The Euclidean distance produces an average silhouette coefficient of 0.3760, an RMSE of 0.0624, and an accuracy of 93.75%, indicating that clustering using the Euclidean distanceasdistancemetricresultsinbettercategorization of consumers based on the similarity of their typical electricity consumption behavior, better temporal feature extraction, and pattern identification of household consumption.Basedonthesefindings,powersupplierscan better understand their power consumers and target potential customers for effective and adaptable demand sidemanagementmeasures
[1]“Smart meter, amart data smart growth - Google Search.”
[2]N.Jenkins,C.Long,andJ.Wu,“Anoverviewofthesmart gridinGreatBritain.Engineering,1(4),413-421.”2015.
International Research Journal of Engineering and Technology (IRJET) e-ISSN: 2395-0056
Volume: 11 Issue: 04 | Apr 2024 www.irjet.net p-ISSN: 2395-0072
[3]“Operating Britain’s secure smart meter network | SmartDCC.”
[4]I. K. Fodor, “A survey of dimension reduction techniques,” Lawrence Livermore National Lab. (LLNL), Livermore,CA(UnitedStates),2002.
[5]R. Mena, M. Hennebel, Y.-F. Li, and E. Zio, “Selfadaptable hierarchical clustering analysis and differential evolution for optimal integration of renewable distributed generation,” Appl.Energy,vol.133,pp.388–402,Nov.2014, doi:10.1016/j.apenergy.2014.07.086.
[6]F. Iglesias and W. Kastner, “Analysis of similarity measures in times series clustering for the discovery of building energy patterns,” Energies, vol. 6, no. 2, pp. 579–597,2013.
[7]E. Keogh and S. Kasetty, “On the need for time series data mining benchmarks: a survey and empirical demonstration,” in Proceedings of the eighth ACM SIGKDD international conference on Knowledge discovery and data mining, Edmonton Alberta Canada: ACM, Jul. 2002, pp. 102–111.doi:10.1145/775047.775062.
[8]S.Ramos,V.Figueiredo,F.Rodrigues,R.Pinheiro,andZ. Vale, “Knowledge extraction from medium voltage load diagramstosupportthedefinitionofelectricaltariffs,” Eng. Intell.Syst.Electr.Eng. Commun. vol.15,no.3,pp.143–149, 2007.
[9]R.-F.Chang and C.-N. Lu, “Load profiling and its applications in power market,” in 2003 IEEE Power Engineering Society General Meeting (IEEE Cat. No. 03CH37491),IEEE,2003,pp.974–978.
[10] R. Fatima, D. Jorge, and F. Vera, “A comparative analysis of clustering algorithms applied to load profiling [C],” in The Third International Conference on Machine Learning and Data Mining in Pattern Recognition, Leipzig, Germany,2003,pp.73–85.
[11] A. Al-Wakeel, J. Wu, and N. Jenkins, “k -means based load estimation of domestic smart meter measurements,” Appl. Energy, vol. 194, pp. 333–342, May 2017,doi:10.1016/j.apenergy.2016.06.046.
[12]M. Martinez-Pabon, T. Eveleigh, and B. Tanju, “Smart meter data analytics for optimal customer selection in demandresponseprograms,” EnergyProcedia,vol.107,pp. 49–59,2017.
[13]G. Shamim and M. Rihan, “Novel technique for feature computation and clustering of smart meter data,” in 2019 International Conference on Electrical, Electronics and ComputerEngineering(UPCON),IEEE,2019,pp.1–5.
[14]H.-Â. Cao, C. Beckel, and T. Staake, “Are domestic load profiles stable over time? An attempt to identify target
households for demand side management campaigns,” in IECON 2013-39th annual conference of the IEEE industrial electronicssociety,IEEE,2013,pp.4733–4738.
[15] E. I. G. Nassara, E. Grall-Maës, and M. Kharouf, “Linear discriminant analysis for large-scale data: Application on text and image data,” in 2016 15th IEEE International Conference on Machine Learning and Applications(ICMLA),IEEE,2016,pp.961–964.
[16] I. Koch and K. Naito, “Dimension selection for feature selection and dimension reduction with principal andindependentcomponentanalysis,” NeuralComput.,vol. 19,no.2,pp.513–545,2007.
[17] J. H. Ang, E. J. Teoh, C. H. Tan, K. C. Goh, and K. C. Tan, “Dimension reduction using evolutionary Support Vector Machines,” in 2008 IEEE Congress on Evolutionary Computation (IEEE World Congress on Computational Intelligence),HongKong,China:IEEE,Jun.2008,pp.3634–3641.doi:10.1109/CEC.2008.4631290.
[18] Z. Yu et al., “Incremental Semi-Supervised Clustering Ensemble for High Dimensional Data Clustering,” IEEETrans. Knowl. Data Eng.,vol.28,no.3,pp. 701–714,Mar.2016,doi:10.1109/TKDE.2015.2499200.
[19] A. Aleshinloye, A. Bais, and I. Al-Anbagi, “Performance analysis of dimensionality reduction techniques for demand side management,” in 2017 IEEE Electrical Power and Energy Conference (EPEC), Saskatoon, SK: IEEE, Oct. 2017, pp. 1–6. doi: 10.1109/EPEC.2017.8286232
[20] J. A. Hartigan andM.A. Wong, “AlgorithmAS 136: A k-means clusteringalgorithm,” J. R. Stat. Soc. Ser. C Appl. Stat.,vol.28,no.1,pp.100–108,1979.
[21] D. Hand, H. Mannila, and P. Smyth, “Principles of datamining.MassachusettsInstituteofTechnology,”2001.
[22] “Smart - UMass Trace Repository.” Available: https://traces.cs.umass.edu/index.php/Smart/Smart
[23] H.AntonandC.Rorres, Elementary linear algebra: applicationsversion.JohnWiley&Sons,2013.
[24] J.Benesty,J.Chen,Y.Huang,andI.Cohen,“Pearson Correlation Coefficient,” in Noise Reduction in Speech Processing, vol. 2, in Springer Topics in Signal Processing, vol. 2. , Berlin, Heidelberg: Springer Berlin Heidelberg, 2009,pp.1–4.doi:10.1007/978-3-642-00296-0_5.
2024, IRJET | Impact Factor value: 8.226 | ISO 9001:2008