
International Research Journal of Engineering and Technology (IRJET) e-ISSN:2395-0056
Volume: 11 Issue: 04 | Apr 2024 www.irjet.net p-ISSN:2395-0072
International Research Journal of Engineering and Technology (IRJET) e-ISSN:2395-0056
Volume: 11 Issue: 04 | Apr 2024 www.irjet.net p-ISSN:2395-0072
N.Deepika(Asstprof)
DepartmentofCSEKakatiya InstituteofTechnology& ScienceWarangal,India
DeekshithaChitti
DepartmentofCSEKakatiya InstituteofTechnology& ScienceWarangal,India
ThanishkaBoora
DepartmentofCSE KakatiyaInstituteof Technology&Science Warangal,India
Abstract A major worldwide health issue, chronic kidney disease (CKD) requires precise prediction models for early detection and treatment. In order to predict CKD, this study investigatestheefficacyofanumberofmlapproaches,such as Random Forest (RF), Support Vector Machines (SVM),kNearestNeighbors(k-NN),andGatedRecurrentUnits(GRU). In addition, the SHapley Additive exPlanations (SHAP) feature reduction technique is used to improve the interpretability of themodelandpinpointimportantpredictors.
The temporal dependency-capturing GRU model is compared to RF, SVM, and k-NN, and critical variables influencing each model's prediction of CKD are identified and prioritizedusingSHAPanalysis.Thecomparativeperformance of these algorithms in terms of sensitivity, specificity,accuracy, is demonstrated by the results, which offer insightful information for the creation of CKD prediction models that are comprehensible and accurate, with potential usesinearlydetectionandbetterpatientoutcomes.
Keywords Random Forest (RF), Chronic Kidney Disease(CKD),SupportVectorMachines(SVM),GatedRecurrent Units (GRU), k-Nearest Neighbors (k-NN), SHapley Additive exPlanations(SHAP)
Amajorglobalhealthissuethataffectsmillionsofpeople and provides enormous problems to healthcare systems is chronic kidney disease[1], or CKD.You may encounter a numberofhealthissuesasaresultofCKD.[2,3,4]Inorderto carryoutpromptinterventionsandindividualizedtreatment programs, early detection and precise prediction of CKD progression are essential. Machine learning models have become extremely efficient tools for predictive analytics in the medical industry in recent years [5]. Leveraging largescale numeric datasets, these models can uncover complex relationshipswithin thedata andcontributeto moreprecise prognostic outcomes. In this context, our study focuses on
SunayanaDeepthiShamanthula
DepartmentofCSEKakatiya InstituteofTechnology& ScienceWarangal,India
PavanTejaReddyPingili
DepartmentofCSEKakatiyaInstitute ofTechnology&Science Warangal,India
advancing Chronuc kidney disease (CKD) [6] prediction methodologies through the effective integration of diverse machine learning models, namely Gated Recurrent Unit (GRU)[7] Random Forest (RF)[8], Logistic Regression (LR)[9,10] andSupport Vector Machine (SVM)[9]. The goal is to use the distinct characteristics of each model to increase prediction accuracy and to improve interpretability by utilizing the SHapley Additive exPlanations(SHAP)featurereductionmethod.
The utilization of a robust dataset plays a important role in the success of predictive modeling for CKD. Our studyunderscoresthesignificanceofacomprehensiveand well-curated numeric dataset, enriched with diverse patient attributes and clinical parameters. By harnessing the wealth of information encapsulated in these datasets, our models aim to discern intricate patterns and relationships,allowingforamorenuancedunderstandingof CKD progression factors. Furthermore, we explore the potential of the Gated Recurrent Unit (GRU) [7] to capture temporal dependencies, Random Forest (RF)[8] for handling non-linear relationships, Support Vector Machine (SVM)[9]fordiscerningcomplexdecision boundaries,and Logistic Regression (LR) [9,10] for its simplicity and interpretability. The amalgamation of these models is facilitated by the SHAP feature reduction method, enhancingboththeaccuracyandinterpretabilityoftheCKD predictionmodels.
In our pursuit of accurate and interpretable CKD prediction, the [11,12,13,14,15,16] SHapley Additive exPlanations(SHAP)featurereductionmethodtakescenter stage.Byquantifyingtheeffectofsingleattributesonmodel predictions, SHAP provides valuable insights into the drivingfactorsbehind[1]CKDprogression.Thismethodnot only enhances the transparency of our models but also empowers healthcare practitioners to make informed
International Research Journal of Engineering and Technology (IRJET) e-ISSN:2395-0056
decisions based on the identified influential features. As we delve into the intricacies of CKD prediction using GRU, RF, SVM, and LR models, the incorporation of SHAP[11,12,13,14,15,16] acts as a important tool for unlocking the black box of machine learning, fostering trust inpredictivemodels,andultimatelypavingthewayformore effectiveandpersonalizedhealthcareinterventions.
A. Motivation
Themotivationstemsfromthetransformativepotential
of leveraging machine learning approaches for CKD prediction.[1] CKD, a widespread health challenge, necessitates proactive strategies for early detection and intervention. Traditional diagnostic methods often fall short in capturing the intricacies of CKD progression, driven by multifaceted factors. Our goal is to change the managementofCKDbyutilizingmachinelearningtogive clinicianstheabilitytoexaminelargedatasets.[17],unveil subtle patterns, and deliver personalized predictions. This approach aligns with the evolving landscape of precision medicine, aiming to enhance healthcare efficiency, improve patient outcomes, and address the complexchallengesassociatedwithCKD.
B. Objectives
-Create advanced machine learning models using a comprehensive dataset to predict outcomes in Chronic KidneyDisease (CKD).This involvesleveraging historical datatoenhancetheprecisionofCKDpredictions.
-Support healthcare professionals and doctors in makingaccuratepredictionwithadvancedmodels.
-Attain a high level of precision in predicting CKD progression, incorporating advanced modeling techniquesandinterpretabilitymethods.
-This includes refining predictions to deepen the understandingofinfluentialfactorsinCKDdevelopment.
For senior citizens A thorough summary of the several machine learning methods to predict CKD is given in the literaturereview.
Through the application of several machine learning approaches, the field of chronic kidney disease (CKD) prediction has made notable advancements. Scholarshave investigated a wide range of algorithms, from more sophisticated techniques like ensemble methods and neural networks to more conventional strategies like
Volume: 11 Issue: 04 | Apr 2024 www.irjet.net p-ISSN:2395-0072 © 2024, IRJET | Impact Factor value: 8.226 |
logistic regression, decision trees, and support vector machines.Predictivemodelsareshapedbylargedatasetsthat include patient demographics, clinical histories, and laboratory results. Important features that are included in these datasets are creatinine levels and estimated glomerularfiltration rate(eGFR).Theuseofalgorithmslike Random Forest, Support Vector Machines (SVM), and Decision Trees in CKD prediction is not without restrictions, nevertheless, even with their success.
Although Random Forest's ensemble complexity increases robustness, interpretability is compromised. Moreover, these algorithms' high computational complexity might result in lengthy training periods, which presents a practical challenge for real-world applications. Overfitting is another issue that comes up, especiallywithsmalldatasets, and imputation is a method of handling missing data that can lead to compromised forecastaccuracy.
Three outfit measures and a total of six classifiers were merged in the directions provided by Polat et al. [18].ThePolatetal.[18] writersApriorianalysisand the k-meansalgorithmwerebothusedtoinvestigatedifferent treatmentoptionsforchronicrenalillness.Furthermore,a testfor diagnosingchronic kidney disease wasdeveloped by utilizing Naive Bayes (NB), SVM, k-nearest neighbors (KNN)anddecisiontrees(DT)calculations.
Inordertoidentifyrenal diseases,Boukenze,B.etal. [19] suggested using ML techniques. They evaluated different performance indicators to determine prediction accuracy using methods including decision trees, artificial neural networks (ANN), support vector machines (SVM), and k-nearest neighbors (KNN). With an accuracy rate of 63%withdecisiontreemodel.
A methodology utilizing KNN, Naive Bayes (NB), and decision tree classifiers was presented by Panwong et al. [20]. Furthermore, they used the wrapper technique to reduce features. By using the decision tree method, they were able to get an impressive maximum accuracy rateof 85%.
Using a large amount of CKD data, Vasquez-Morales and colleagues [21] created a neural network classifier that showedanamazing95%predictionaccuracy.
Meanwhile,Makinoetal.[22]usedpatientdiagnoses and treatment information compiled from textual sources topredictthediabetickidneydisease.
International Research Journal of Engineering and Technology (IRJET) e-ISSN:2395-0056
Volume: 11 Issue: 04 | Apr 2024 www.irjet.net
Renetal.[23]proposedadiagnosticpredictionmodelfor chronic kidney disease (CKD) using information of electronichealthrecords(EHRs).Toaidindiagnosis,their neural network-structured model processed numerical andlinguisticdatafromEHRs.
Similartothis,MaF.etal.[24]createdadeepneural networkmodeltoidentifychronickidneydisease.Intheir comparative analysis, the provided model outperformed ANNandSVMintermsofaccuracy.
Z. Segal et al. [25] created XGBoost, especially for kidney disease early detection. In comparison to models such as random forest, CatBoost, and regularization regression,theyperformedbetteronallcriteria.
Khamparia et al. [26] reported a deep learning system that used a stacked autoencoder model to extract attributes from multimedia data in order to identify chronic kidney disease (CKD) early on. Their research, which was published in Nature Communications, demonstratedoutstandingaccuracyinpredictingthe final classusingaSoftMaxclassifier.Remarkably,theirproposed model performed better tailored for the specific dataset, outperformingconventionalclassificationtechniquesbased on an analysis of the UC Irvine Machine Learning Repository(UCI)CKDdataset[27].
EbiaredohMienye Sarah et al. [28] used Softmax regression with an improved sparse autoencoder (SAE) to create a strong predictive model for CKD. The model's effectiveness was enhanced by the use of weight penalization to produce sparsity in autoencoders, as previously described. Testing scenarios were guaranteed to yield remarkable performance thanks to the customized Softmax regression model tuned for classification tasks. The researchers reported that the proposed model demonstratedanamazing98% precision on the CKD dataset. Their method outperformed other approaches interms of overall performance, proving its superiority in CKDprediction.
In order to improve diagnostic accuracy, Chen et al.[29] developedaalgorithmdesignedtodiagnoseHepatitisCvirus infection by combining an SVM classifier with the Fisher discriminating analysis approach. Their thorough comparison of the hybrid approach's performance with current methodologies proved its superiority. The combination of method outperformed all other strategies studied, with the greatest classification with 96.77% accuracy.
p-ISSN:2395-0072
Finding the ideal number of trees in a Random Forest to reduce overfitting tendencies is one example of the delicate balances that must be achieved in order to addresstheseissues.Furthermore,thesemodels'intrinsic black-boxnatureaddscomplexity,whichmakesitdifficult tounderstandtheunderlying decision-makingprocesses. Therefore, approaches to improve interpretability without compromising predictive accuracy are being developed.
Notwithstanding the encouraging outcomes, these research have shown many drawbacks, including interpretability, computational complexity, overfitting vulnerability, and management of missing data. Table 1 provides a detailed overview of these constraints, highlighting areas in which additional research and developmentarerequired.
However, despite the promising results, limitations such as interpretability, computational intensity, susceptibility to overfitting, and handling of missing data havebeenidentifiedacrossthesestudies.
Gated reccurent unit (GRU) , a deep learning model, havedemonstratedremarkableefficacyinprocessingand classifying data.. This robust approach enhances the accuracy of action prediction tasks, making GRU valuable toolsintherealmofdataanalysisandclassification.
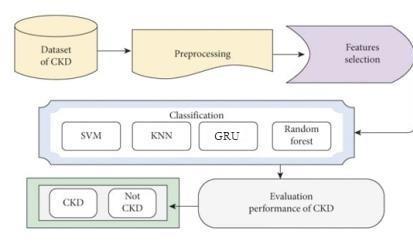
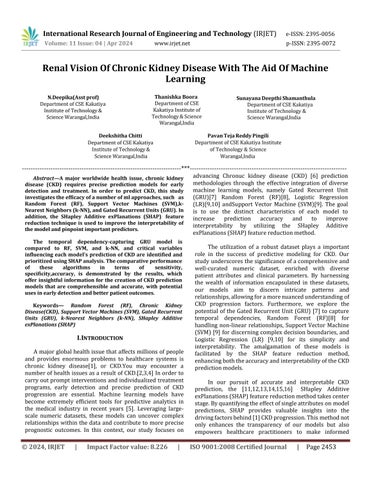
Fig.1.Flowdiagramoftheimplementationmodel
Step 1: Dataset Selection: To get started, select a datasetof602entriesand26attributes.Thiswillserveas thebasisformachinelearning.
Step 2: Processing Data Utilize mean imputation to handle null values and empty attributes, resulting in a clean, complete dataset that is prepared for machine usage.
International Research Journal of Engineering and Technology (IRJET) e-ISSN:2395-0056
Volume: 11 Issue: 04 | Apr 2024 www.irjet.net
Step 3: Choosing Features Optimize computational efficiency by carefully choosing pertinent attributes and choosing the dataset to removeunnecessarydata.
Step 4: Algorithmic Training: Apply the fine- tuned dataset to an algorithm for classifying data. Let the algorithm go through a training phase to prepare it for testingandprediction.
Step 5: Predictions and Testing Give the program sample data inputs and assign it the goal of classifying kidneys as healthy or diseased. Investigate several algorithms and select the one that best exhibits the harmonybetweenforecastaccuracyandefficiency.
B. Dataset
400patientsfromtheRCIreposistoryareincludedin the dataset. CKD dataset was provided by the repository[17].Thedatasethas24characteristics. divided into11number features and13category features, such as "ckd" and "notckd" for classification[17]. Among the characteristics are blood urea, random blood glucose, hemoglobin, packed cell volume,red and white blood cell counts, diabetes mellitus, hypertension, coronary artery disease, hunger, pedal edoema, and anemia. Age, blood pressure, pus cells, pus cell clusters, bacteria, and random bloodglucoselevelsareothercontributors.Inadiagnostic class,therearetwovalues:ckdandnotckd.
C. Models
In In the realm of data prediction , SVM, Random forest, KNN and GRU models serve as powerful tools, leveragingtheirdistinctarchitecturestocapture temporal dependencies. Here's an overview of their fundamental components.
In order for the SVM method to determine which classesthetestdatabelongsinitfirstdrawsalinedividing the dataset into those classes. The boundary or decision line is referred to as a hyperplane. The algorithm is applicable to both linear and nonlinear types. When a datasetisseparableandconsistsoftwoclasses,linearSVM isutilised.
A nonlinear support vector machine (SVM), which transformstheoriginal coordinate regionintoa separable space,isusedwhenthedatasetisnotseparable.Theremay be more than one hyperplane; the optimal one is determined by maximising the margin between data points.Asupportvectordatasetistheonethatisclosestto thehyperplane
p-ISSN:2395-0072
Inordertoenhancemodelperformanceandresolve a challenging issue, the random forest technique combines many classifiers in accordance with the ensemble learning concept. According to the algorithm's name, it is an algorithmthatusesafewdecisiontreesondatasetsubsets, and it takes an average to enhance predictions. random forest algorithm uses predictions from every decision tree in place of only one, and it uses the majority vote to determine which forecast best predicts the outcome in the end.
The KNN algorithm groups new test points into the similar class among the different classes according to similarities between previously stored and newly
collected data points (training points).The distance between the training points and new point and the that have been saved is computed using the Euclidean distance, and the new data is classified using the value of k. The class with the highest number of neighbors receives a new point. The closest neighbor in the features vector was found using the Euclidean Distance Function (Di).
Gated recurrent units (GRUs) are particularly good at identifying temporal dependencies in sequential data. Memory Cells: GRUs have memory cells that can identify long-term dependencies by updating and retaining informationselectively.
Hidden States: The learnt information is encoded in the hidden states of GRUs, which are essential for comprehendingthesequentialnatureofdata.
All models follow a common predictive process: taking preprocessedckd data as input and outputting predictions. Training involves adjusting model parameters through backpropagation using labeled EEG data. The models can adapt to different motor imagery tasks by modifying the output layer accordingly.
International Research Journal of Engineering and Technology (IRJET) e-ISSN:2395-0056
Volume: 11 Issue: 04 | Apr 2024 www.irjet.net p-ISSN:2395-0072
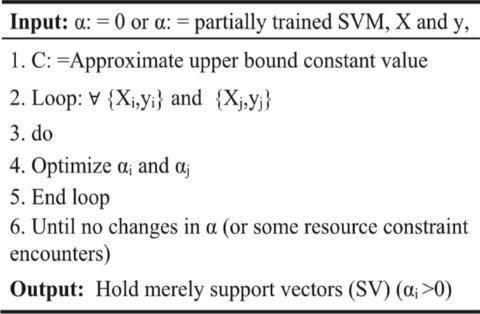
Fig.2.PseudocodeofSVM
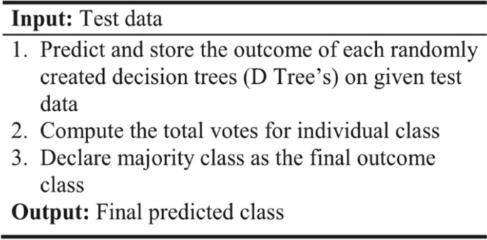
Fig.3.PseudocodeofRandomForest
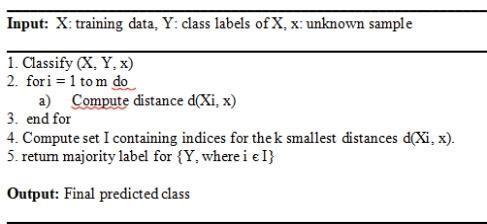
Fig.4.PseudocodeofLR
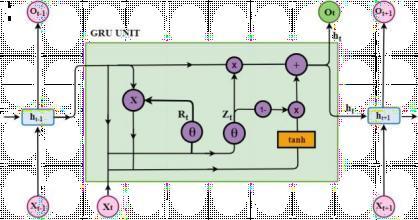
Fig.5.ArchitectureofGRUModel
A. Framework
Training,validation,andtestingsetscomprisethe preprocessed dataset used in our CKD prediction system, whichusesSVM,RF,LR,andGRUmodels.Transferlearning is not used in the model evaluation process, which is dependent on accuracy measures. In real-world clinical deployment, procedures for continuing monitoring and improvement are put in place to guarantee continued efficacy.
B. Objective
PurposefulIyordertoenhanceearlyidentification and risk assessment for those at risk of Chronic Kidney Disease (CKD), the project focuses on creating a machine learning-based prediction system for the condition. With the help of ML algorithms, this system seeks to evaluate pertinent clinical data and produce precise forecasts aboutthebeginningorcourseofCKD.
C. ComparativeEvaluation
The rigorous accuracy comparison meticulously examinedtheperformanceofkeymodels,focusingonthe SVM,RF,LR and GRU architectures tailored for predicting diseasebasedonCKDdata.
The in-depth comparative evaluation affirmed the prowess of the SVM,RF,LR and GRU models in predicting disease from CKD data. SVM, tune kernel type and regularizationparameters;forRF,optimizethenumberof trees and maximum depth; for LR, adjust regularization strength and solver; for GRU, customize the architecture to sequential CKD data. These models collectively contribute to the accuracy and efficacy of the prediction system, each offering unique strengths in tackling the complexitiesof Ckddisease.
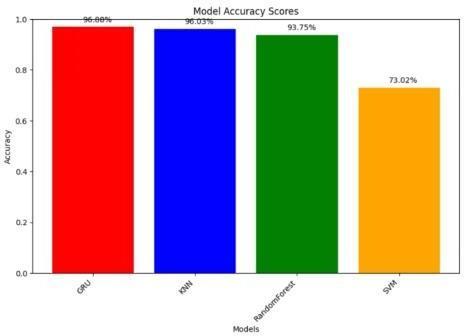
Fig.6.Comparisonofaccuraciesofvariouspre-trainedmodels
International Research Journal of Engineering and Technology (IRJET) e-ISSN:2395-0056
Volume: 11 Issue: 04 | Apr 2024 www.irjet.net
Step1:
Compile and preprocess the CKD dataset, incorporating essential features and labels. Implement standardized preprocessing steps, including cleaning, normalization, and stratification into test, validation, and trainingsets.
Step2:
SelectSVM,RF,LR,andGRUasthepredictivemodels. ForSVM,tunekerneltypeandregularizationparameters; forRF,optimizethenumberoftreesandmaximumdepth; forLR,adjustregularizationstrengthandsolver;forGRU, customizethearchitecturetosequentialCKDdata.
Step3:
Train each model using the training set, adjusting hyperparameters iteratively based on performance metrics obtained from the validation set. Fine-tune parameters to achieve optimal predictive accuracy for eachmodel.
Step4:
Analyze the SVM, RF, LR, and GRU models' performance using measures like F1-score, recall, accuracy, and precision on the specific test set. To determine which model is best for CKD prediction, compareandevaluatethedata.
Step5:
Use simulations to evaluate the applicability of the findings to real-world settings involving CKD prediction. UsepatientdatatopredicttheexistenceofCKD usingthe SVM, RF, LR, and GRU models. Stress the effectiveness of these models in differentiating between those with and withoutCKD.
Step6:
Evaluate the performance of the models in comparison, taking into account aspects such as interpretability, computational efficiency, and accuracy. Based on the particular needs and limitations of the application,choosethebestmodelforCKDprediction.
p-ISSN:2395-0072
The performance metrics for ckd prediction utilizingrf,svm,lr,andgrumodelswereassessedusing accuracy, precision, recall, f1-score, confusion matrix, andothercommonmetrics. model generalization was evaluated using training and testing sets, and model accuracy was evaluated by comparing predictions withthegroundtruthckdstatus.theconfusionmatrix provided a comprehensive breakdown of true positive, false positive, true negative, and false negative predictions, hence illuminating the model's performanceacrossdifferentclasses
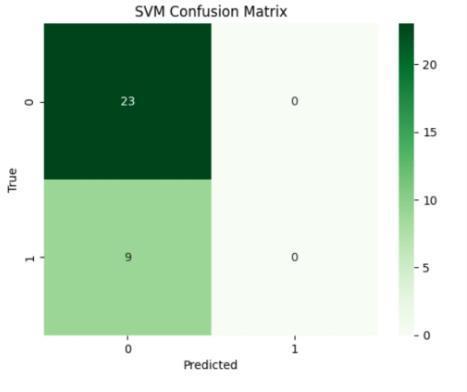
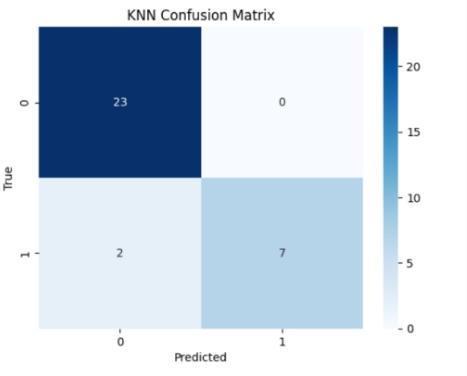
Fig.7.2.ConfusionMatrixofSVMmodel
International Research Journal of Engineering and Technology (IRJET) e-ISSN:2395-0056
Volume: 11 Issue: 04 | Apr 2024 www.irjet.net p-ISSN:2395-0072
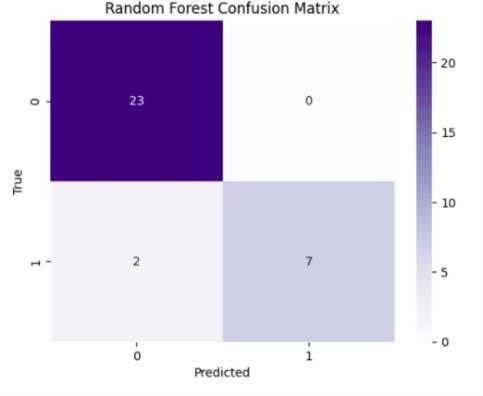
Fig.7.3.ConfusionMatrixofRFmodel
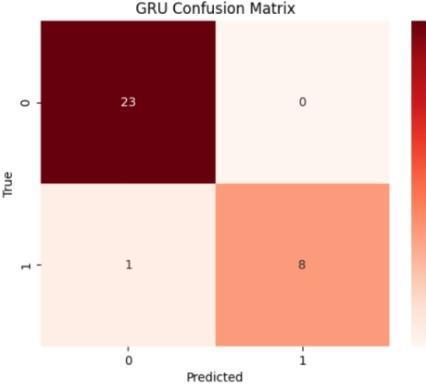
Fig.7.4.ConfusionMatrixofGRUmodel
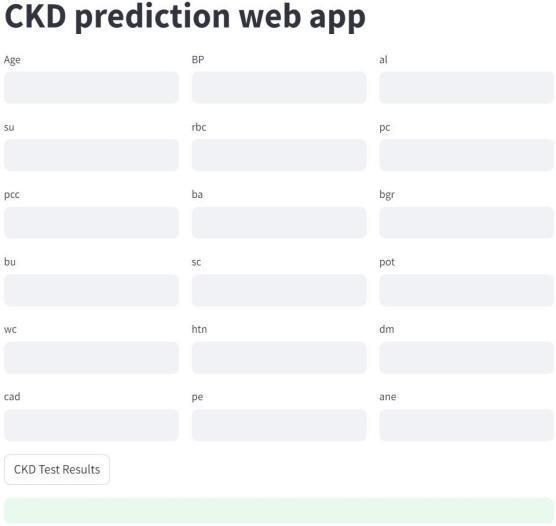
Fig.7.5.UserInterface
The study points to directions for further investigation, especially with regard to enhancing the renal vision powers of CKD identification with the use of the current numerical dataset. Even if the combination of Support Vector Machine (SVM),Random Forest (RF), Logistic Regression (LR) and Gated Recurrent Unit (GRU) has proven effective, the existing dataset framework still hasroom for development. Investigating advanced model architectures, such as enhanced neural network structures or ensemble techniques tailored to numeric datasets, could unveil additional patterns and relationships, thereby augmenting the accuracy of CKD predictions.
Additionally, future research endeavors should continue to emphasize the interpretability of the models within the confines of the numeric dataset. Exploring novel feature reduction methods or visualization techniques specifically tailored to numeric data could simplify the complex predictions, making them more accessible for healthcare practitioners. Collaborative efforts with domain experts and a focus on domainspecific knowledge would be crucial in enhancing the relevance and applicability of the models to the numeric datasetinreal-worldclinicalsettings.
Theproposeddirectionsforthefutureshow that the current numerical dataset can be used to continue innovation and progress in the context of CKD prediction. Through the investigation of sophisticated model architectures, utilization of temporal elements,and improvement of interpretability, scholars might furthermore unearth the revelations concealed within the numerical data, hence aiding in the creationofpredictivemodels for CKD detection that are more precise anduseful.
[1] Charleonnan A., Fufaung T., Niyomwong T., Chokchueypattanakit W., Suwannawach S., Ninchawee N. 2016 Management and Innovation Technology International Conference (MITicon) IEEE; 2016. Predictive analytics for chronic kidney disease usingmachinelearningtechniques.pp. MIT–80.
[2] Wouters,O.J.,O’Donoghue,D.J.,Ritchie,J.,Kanavos,P. G. & Narva, A. S. Early chronic kidney disease: Diagnosis, managementandmodelsofcare.Nat.Rev. Nephrol.11,491– 502(2015).
International Research Journal of Engineering and Technology (IRJET) e-ISSN:2395-0056
Volume: 11 Issue: 04 | Apr 2024 www.irjet.net p-ISSN:2395-0072
[3] Kalantar-Zadeh,K., Jafar, T. H.,Nitsch,D.,Neuen,B. L. & Perkovic, V. Chronic kidney disease. Lancet 398, 786–802 (2021).
[4] ERA-EDTA Council & ERACODA Working Group. Chronic kidney diseaseisa key riskfactor for severe COVID-19:Acall toactionbytheERA-EDTA.Nephrol. Dial.Transplant.36, 87–94(2021).
[5] Zhao, J.; Zhang, Y.; Qiu, J.; Zhang, X.; Wei, F.; Feng, J.; Chen, C.; Zhang, K.; Feng, S.; Wang, Y.; et al. An Early Prediction Model for Chronic Kidney Disease. Sci. Rep.2022, 17,1–9.
[6] J Pathol Inform. 2023; 14: 100189. Published online 2023Jan12.doi:10.1016/j.jpi.2023.100189
[7] Alsuhibany,S.A.;Abdel-Khalek,S.;Algarni,A.;Fayomi, A.; Gupta, D.; Kumar, V.; Mansour, R.F. Ensemble of Deep Learning Based Clinical Decision Support System for Chronic Kidney Disease Diagnosis in Medical Internet of Things Environment. Comput. Intell.Neurosci.2021, 2021.
[8] Salekin A, Stankovic J. Detection of Chronic Kidney Disease and Selecting Important Predictive Attributes. In: Proc. - 2016 IEEE Int. Conf. Healthc. Informatics,ICHI2016,pp.262–270, 2016.
[9] Charleonnan A, Fufaung T, Niyomwong T, Chokchueypattanakit W, Suwannawach S, Ninchawee N. Predictive analytics for chronic kidney disease using machine learning techniques. Manag Innov TechnolIntConfMITiCON. 2016;80–83:2017.
[10] JerlinRubini,L.&Perumal,E.Efficientclassificationof chronickidney disease byusingmulti-kernel support vector machine and fruit fly optimization algorithm. Int.J.Imaging Syst.Technol.30,660–673(2020).
[11] Gupta, R., Koli, N., Mahor, N. & Tejashri, N. Performance analysis of machine learning classifier for predicting chronic kidney disease. In 2020InternationalConferenceforEmerging Technology (INCET) 1–4 https://doi.org/10.1109/INCET49848.2020.9154147 (2020).
[12] Adadi,A. &Berrada, M.Peekinginsidethe black-box: A survey on explainable artificial intelligence (XAI). IEEE Access6,52138–52160(2018).
[13] Hara, S. & Hayashi, K. Making Tree Ensembles Interpretable. Preprint at http://arxiv.org/abs/1606.05390(2016).
[14] Ribeiro, M. T., Singh, S. &Guestrin, C. ‘Why should i trust you?’: Explaining the predictions of any classifier. In Proceedings of the 22nd ACM SIGKDD International ConferenceonKnowledgeDiscoveryand Data Mining 1135– 1144 https://doi.org/10.1145/2939672.2939778 (Association forComputingMachinery,2016).
[15] Lundberg, S. M. & Lee, S.-I. A unified approach to interpreting modelpredictions.In AdvancesinNeural Information ProcessingSystems vol.30,(2017).
[16] Simonyan, K., Vedaldi, A. & Zisserman, A. DeepInside Convolutional Networks: Visualising Image Classification Models and Saliency Maps. https://doi.org/10.48550/arXiv.1312.6034(2014).
[17] AlsuhibanySA,etal.Ensembleofdeeplearningbased clinical decision support system for chronic kidney disease diagnosis inmedical internet of things environment.ComputIntellNeurosci.2021;3:2021.
[18] Polat H., Danaei Mehr H., Cetin A. Diagnosis of chronic kidney disease based on support vector machine by feature selection methods. J Med Syst. 2017;41:1–11.
[19] Boukenze, B.; Haqiq, A.; Mousannif, H. Predicting Chronic Kidney Failure Disease Using Data Mining Techniques.In AdvancesinUbiquitousNetworking; El-Azouzi,R., Menasche,D.S.,Sabir,E.,DePellegrini, F., Benjillali, M., Eds.; Springer: New York, NY, USA,2018;Volume2,pp. 701–712
[20] Panwong, P.; Iam-On, N. Predicting transitional interval of kidney disease stages 3 to 5 using data mining method. In Proceedingsof the 2016 Second Asian Conference on Defence Technology (ACDT), Chiang Mai, Thailand, 21–23 January 2016; pp. 145–150.
[21] Vasquez-Morales, G.R.; Martinez-Monterrubio, S.M.; Moreno-Ger, P.; Recio-Garcia, J.A. Explainable Prediction of Chronic RenalDisease in the Colombian Population Using Neural Networks and Case-Based Reasoning. IEEE Access2019,7, 152900–152910
International Research Journal of Engineering and Technology (IRJET) e-ISSN:2395-0056
Volume: 11 Issue: 04 | Apr 2024 www.irjet.net p-ISSN:2395-0072
[22] Makino, M.; Yoshimoto, R.; Ono, M.; Itoko, T.; Katsuki, T.; Koseki, A.; Kudo, M.; Haida, K.; Kuroda, J.; Yanagiya, R.; et al.Artificial intelligence predicts theprogressionofdiabetic kidneydiseaseusingbig datamachinelearning.Sci. Rep.2019,9,11862.
[23] Ren, Y.; Fei, H.; Liang, X.; Ji, D.; Cheng, M. A hybrid neural network model for predicting kidney disease in hypertension patientsbased on electronichealthrecords.BMCMed.Inf. Decis.Mak. 2019,19,131–138.
[24] Ma, F.; Sun, T.; Liu, L.; Jing, H. Detection and diagnosis of chronic kidney disease using deep learning-based heterogeneousmodified artificial neural network. Future Gener. Comput. Syst. 2020,111,17–26.
[25] Segal,Z.;Kalifa,D.;Radinsky,K.;Ehrenberg,B.;Elad, G.; Maor, G.; Lewis, M.; Tibi, M.; Korn, L.; Koren, G. Machine learningalgorithm for early detection of end-stage renal disease. BMC Nephrol. 2020,21, 518.
[26] Khamparia, A.; Saini, G.; Pandey, B.; Tiwari, S.; Gupta, D.; Khanna, A. KDSAE: Chronic kidney diseaseclassification withmultimediadatalearning using deep stacked autoencoder network. Multimed.ToolsAppl.2020,79,35425–35440.
[27] Dua, D.; Graff, C. UCI Machine Learning Repository. 2019. Available online: http://archive.ics.uci.edu/ml (accessed on 6December2021)
[28] Ebiaredoh-Mienye, S.A.; Esenogho, E.; Swart, T.G. Integrating Enhanced Sparse Autoencoder-Based Artificial Neural NetworkTechnique and Softmax Regression for Medical Diagnosis. Electronics 2020,9,1963.
[29] Chen,G.;Ding,C.;Li,Y.;Hu,X.;Li,X.;Ren,L.;Ding,X.; Tian, P.; Xue, W. Prediction of Chronic Kidney Disease Using AdaptiveHybridized Deep Convolutional Neural Network on the Internet of Medical Things Platform. IEEE Access2020,8, 100497–100508