
International Research Journal of Engineering and Technology (IRJET) e-ISSN:2395-0056
Volume: 11 Issue: 04 | Apr 2024 www.irjet.net p-ISSN:2395-0072
International Research Journal of Engineering and Technology (IRJET) e-ISSN:2395-0056
Volume: 11 Issue: 04 | Apr 2024 www.irjet.net p-ISSN:2395-0072
Antara Dessai1, Prof. Siddhi Naik2
1Student, Department of Information Technology and Engineering, Goa College of Engineering, Farmagudi, Goa, India
2Assistant Professor, Department of Information Technology and Engineering, Goa College of Engineering, Farmagudi, Goa, India ***
Abstract - Social Network Analysis (SNA) with a focus on unraveling the intricate patterns of online information diffusion. This study focuses on Social Network Analysis (SNA) techniques to gain insights into how information propagates through social network by means of data analysis of information shared on network by Visualizing the graph, measuring Degree Centrality, Betweenness Centrality, Closeness Centrality, Clustering Effects, Bridges,Assortativity,NetworkCommunities andPlotWordCloud, BarChartRepresentationforSentimentAnalysis.
The study employs a multidisciplinary approach, combining elements data science, and social network to provide a comprehensive understanding of online information diffusion. Utilizing real-world datasets from prominent social media platforms, we analyze the interactions, connections, and behavioralpatternsofusersinvolvedinthedisseminationprocess.
Key Words:- Social Network Analysis,Influence Maximization, Sentiment Analysis
1.INTRODUCTION
SocialNetwork Analysis(SNA) isa powerful methodused to study the relationships and interactions among individuals, groups, or organizations within a social system. It provides a valuable framework for understanding the structure, dynamics, and patterns of socialnetworks.
Social Network Analysis stands as a pivotal tool in unraveling the intricate dynamics of online information diffusion patterns, providing a nuanced lens through which researchers can comprehend the complexities inherentinthedigitaldisseminationofinformation.Inthe realm of project reports, a comprehensive overview of SNA's application in understanding online information diffusionisimperativeforunlockingkeyinsights.
SNA delves into the intricate web of relationships within social networks, enabling the identification of influential nodes and pathways that govern the flow of information. Thisanalyticalapproachfacilitatesagranularexamination of the factors influencing the speed, reach, and impact of information dissemination, shedding light on the underlying structures that shape online communication. Through the analysis of connections between nodes, SNA
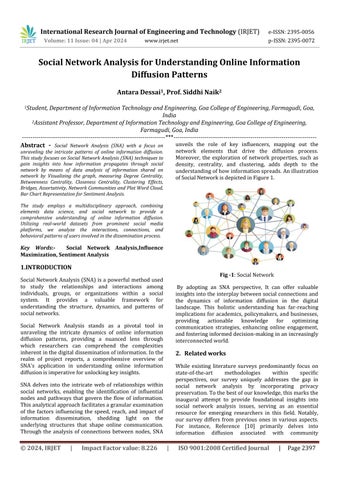
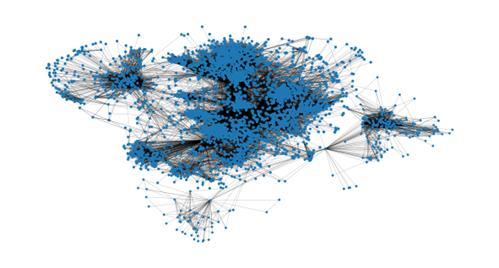
unveils the role of key influencers, mapping out the network elements that drive the diffusion process. Moreover, the exploration of network properties, such as density, centrality, and clustering, adds depth to the understandingofhowinformationspreads.Anillustration ofSocialNetworkisdepictedinFigure1.
By adopting an SNA perspective, It can offer valuable insightsintotheinterplaybetweensocialconnectionsand the dynamics of information diffusion in the digital landscape. This holistic understanding has far-reaching implications for academics, policymakers, and businesses, providing actionable knowledge for optimizing communication strategies, enhancing online engagement, andfosteringinformeddecision-makinginanincreasingly interconnectedworld.
While existing literature surveys predominantly focus on state-of-the-art methodologies within specific perspectives, our survey uniquely addresses the gap in social network analysis by incorporating privacy preservation.Tothebestofourknowledge,thismarksthe inaugural attempt to provide foundational insights into social network analysis issues, serving as an essential resource for emerging researchers in this field. Notably, our survey differs from previous ones in various aspects. For instance, Reference [10] primarily delves into information diffusion associated with community
International Research Journal of Engineering and Technology (IRJET) e-ISSN:2395-0056
Volume: 11 Issue: 04 | Apr 2024 www.irjet.net p-ISSN:2395-0072
detection, concentrating solely on community detection algorithmswithinaninformationdiffusioncontext.Recent studies, including [6, 8, 15, 17], have explored the influence maximization problem, offering insights into problem-solving approaches, performance evaluations, and theoretical approximation guarantees. Our work, therefore, stands out by providing a comprehensive and foundationaloverviewofsocialnetworkanalysis,bridging criticalknowledgegapsintheliterature.
1.Data Collection
Data Source is based on data collected from facebookand twitter. Both of them have a board specifically for informationdiffusiontopicdiscussion.
facebook_combined Dataset- Facebook network is undirected and has no weights because one user can become friends with another user just once. Each node represents an anonymized facebook user that belongs to oneofthosetenfriendslists.Eachedgecorrespondstothe friendship of two facebook users that belong to this network. In other words, two users must become friends on facebook in order for them to be connected in the particularnetwork.
TwitterSentimentsDataset-ATwitterSentimentsDataset typically consists of labeled data where each entry represents a tweet along with information about its sentiment. The objective of this task is to detect hate speech in tweets. ID is field usually contains a unique identifierforeachtweet.Itisanumericaloralphanumeric codeassignedtodifferentiateonetweetfromanother.The ID serves as a reference point and helps in tracking and organizing the dataset.Label field indicates the sentiment associated with the tweet. Where label '1' denotes the tweetisracist/sexistandlabel'0'denotesthetweetisnot racist/sexistandTweetfieldcontainstheactualtextofthe tweet.
The properties and measures outlined in this discussion serve as valuable tools for analyzing and quantifying various tasks within social networks. Researchers and analysts can leverage these measures to scrutinize network structures, pinpoint influential users, predict missing links, conduct behavioral analyses of product adoption, and more. The application of these measures enables the characterization of networks in a comprehensivemanner.
A Facebook network is undirected and has no weights because one user can become friends with another user
just once. Each node represents an anonymized facebook user that belongs to one of those ten friends lists. Each edge corresponds to the friendship of two facebook users that belong to this network. In other words, two users must become friends on facebook in order for them to be connectedintheparticularnetwork.
Degree Centrality: Easily computed by assessing the number of connections a node has, higher degree nodes are considered more central. However, in dense graphs, the assumption that the highest degree node has the best reachability may not always hold true. In such cases, a chain of lower degree nodes can be beneficial for maximizinginfluencespread.
Betweenness Centrality: This measure evaluates a node's importanceinallshortestpathsbetweenpairsofnodesin thenetwork,computingthefractionofthesepathsanode is present in. It is particularly suited for applications involvinginformationdiffusion.
Closeness Centrality: Defined as a node's proximity to the rest of the network, closeness centrality is calculated as the average of the shortest distances between a node and other nodes. A node with a lower closeness score is considered more central, indicating better connectivity to most nodes in the network. This centrality measure is useful for influence maximization, as a node's influence is confinedtoitslocalregion.
International Research Journal of Engineering and Technology (IRJET) e-ISSN:2395-0056
Volume: 11 Issue: 04 | Apr 2024 www.irjet.net p-ISSN:2395-0072
The Clustering Effect: is a measure that reflects a node's tendency to form coalitions within a social network, determined by the total number of triplets present. A higher clustering coefficient indicates dense interconnectionsamongnodesinthenetwork.Essentially, it is the average of neighborhood densities for all nodes, illustratingtheextenttowhichnodesareembeddedinthe network.Inotherwords,anetworkwithtightlyconnected nodes will exhibit a higher clustering coefficient, highlighting the cohesive nature of the relationships within the network. This measure provides valuable insightsinto the structural cohesion andinterdependence ofnodesinthesocialnetwork.
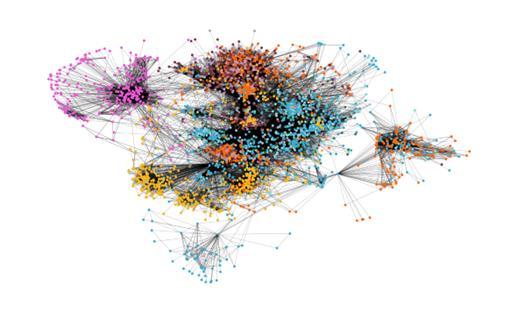
Plays a crucial roleinthe dissemination ofinformation as itestablishesconnectionsamongnodeswithsimilarideas. The spread of information tends to be slower when the consensus is reached within a community. Members of a community receive confirmation that a majority supports aparticularidea,boostingtheirconfidenceinpropagating the information. Determining the key node facilitates faster message propagation through the network. The densityofacommunityservesasanindicatorofhowwellconnected its members are, shedding light on the overall cohesionwithinthecommunity.
Understand the emotional tone associated with the spreadofinformation.Positiveornegativesentimentscan significantly influence the diffusion patterns. Sentiment analysis plays a crucial role in understanding information diffusion within social networks. It involves the use of natural language processing and machine learning techniques to determine the sentiment or emotional tone expressedintextualdata.
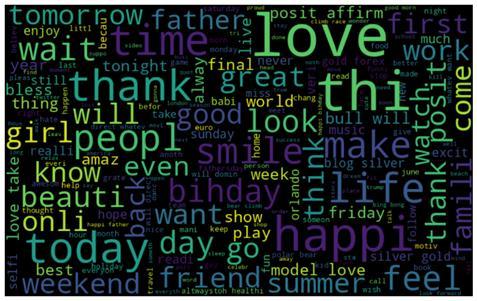
Fig -4:The80mostfrequenttokensinthedatabaseasa wordcloud. Those tweetcontainshatespeechifithasa racistorsexistsentimentassociatedwithit.So,thetaskis toclassifyracistorsexisttweetsfromothertweets.
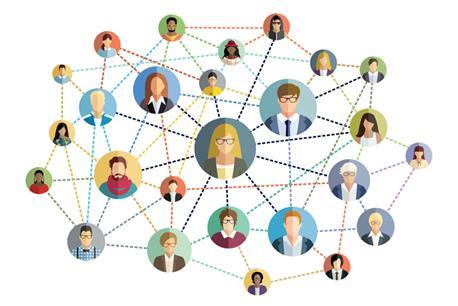
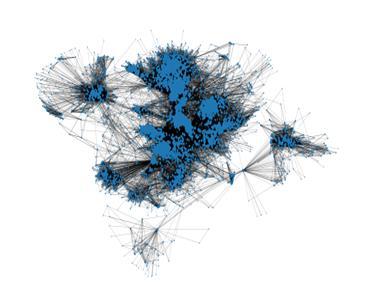
Social Network Analysis stands as a valuable and multidimensional tool for unraveling the intricate dynamics of online information diffusion patterns. Visualization serves as a powerful tool for unraveling the complex network patterns, enabling a more intuitive comprehension of the relationships and clusters within the data. Centrality measures, including degree centrality and betweenness centrality highlight the pivotal nodes andindividualsthat playcrucial rolesin information flow andnetworkcohesion.Identifyingthesecentralnodesaids in understanding key influencers and potential points of controlorinfluencewithinthenetwork.
Clustering effects reveal the presence of communities within the facebook network. Analyzing bridges and assortativity provides further depth by exposing connections between different clusters and uncovering patterns of similar or different among nodes. Network communities, identified through community detection algorithms help to identify existence of groups with shared interests. Sentiment analysis, when applied to the content shared within the network, enriches our understanding by guessing the sentiment prevalent amongusers.
International Research Journal of Engineering and Technology (IRJET) e-ISSN:2395-0056
Volume: 11 Issue: 04 | Apr 2024 www.irjet.net p-ISSN:2395-0072
[1] Shanshan Feng , Kaiqi Zhao , Lanting Fang , Kaiyu Feng, Wei Wei , Xutao Li , and Ling Shao . “H-Diffu: Hyperbolic Representations for Information Diffusion Prediction”. IEEE TRANSACTIONS ON KNOWLEDGE AND DATA ENGINEERING, VOL. 35, NO. 9, SEPTEMBER2023.
[2] BhawnaSaxena,VikasSaxena.“InfluenceMaximization in Social Networks using Hurst exponent based Diffusion Model”.IEEE 10th International Conference on Cloud Computing, Data Science & Engineering ,2020.
[3] Liangtian Wan , Xiaona Li , Jin Xu , Lu Sun , Xianpeng Wang,andKaihuiLiu.“ApplicationofGraphLearning WithMultivariateRelationalRepresentationMatrixin Vehicular Social Networks”. IEEE TRANSACTIONS ON INTELLIGENT TRANSPORTATION SYSTEMS, VOL. 24, NO.3,MARCH2023.
[4] A.Susi,Dr.V.Akila,Dr.V.Govindasamy.“ANALYSISOF INFORMATION DIFFUSION IN SOCIAL NETWORKS BASED ON GRAPH REPRESENTATION”. IEEE 23 International Conference on Networking and Communications(ICNWC),2023.
[5] Hui Li, Hui Li, Sourav S Bhowmick. “CHASSIS: Conformity Meets Online Information Diffusion”. In Proceedings of the 2020 ACM SIGMOD International Conference on Management of Data (SIGMOD’20), JUNE2020.
[6] Shiori Furukawa, Sho Tsugawa.“Limitations of Link Deletion for Suppressing Real Information Diffusion on Social Media”. 2021 IEEE/ACM International Conference on Advances in Social Networks Analysis andMining,NOVEMBER2021.
[7] B. Liu, Opinions, Sentiment, and Emotion in Text. SentimentAnalysis:Mining Opinions,Sentiments,and Emotions,CambridgeUniversityPress,2015.
[8] J. Jansen, M. Zhang, K. Sobel, and A. Chowdury, “Twitterpower:Tweetsaselectronicwordofmouth,” JASIST,vol.60,pp.2169–2188,112009.
[9] K. Curran, K. O’Hara, and S. O’Brien, “The role of twitterintheworldofbusiness,”IJBDCN,vol.7,pp.1–15,072011.
[10] G. Ranco, D. Aleksovski, G. Caldarelli, M. Grcar, and I. Mozetiˇc, “Theˇeffects oftwittersentiment on stock pricereturns,”PloSone,vol.10,p.e0138441,092015.
[11] X.Chen,Y.Cho,andS.Y.Jang,“Crimepredictionusing twitter sentiment and weather,” in 2015 Systems and
Information Engineering Design Symposium, pp. 63–68,2015.
[12] B. R. Prathap and K. Ramesha, “Twitter sentiment for analysing different types of crimes,” in 2018 International Conference on Communication, Computing and Internet of Things (IC3IoT), pp. 483–488,2018.
[13] Nicolas Claidière and Andrew Whiten. 2012. Integrating the study of conformity and culture in humans and nonhuman animals. Psycholog ical bulletin138,1(2012),126.
[14] WilliamDCrano.1970.Effectsofsex,responseorder, andexpertiseinconformity:Adispositionalapproach. Sociometry(1970),239–252.
[15] Morton Deutsch and Harold B Gerard. 1955. A study ofnormativeandinformationalsocialinfluencesupon individual judgment. The journal of abnormal and socialpsychology51,3(1955),629.
[16] Kuntal Dey, Ritvik Shrivastava, and Saroj Kaushik. 2017. Twitter Stance Detection - A Subjectivity and Sentiment Polarity Inspired Two Phase Approach. In 2017 IEEE International Conference on Data Mining Workshops,ICDM Workshops2017,NewOrleans,LA, USA,November18-21,2017.365–372.
[17] Sainyam Galhotra, Akhil Arora, and Shourya Roy. 2016. Holistic Influence Maximization: Combining ScalabilityandEfficiencywithOpinion-AwareModels. InProceedingsofthe2016InternationalConfer ence on Management of Data, SIGMOD Conference 2016, San Francisco, CA, USA, June 26 - July 01, 2016. 743–758.
[18] Jacob K Goeree, Thomas R Palfrey, Brian W Rogers, and Richard D McKelvey. 2007. Self-correcting information cascades. The Review of Economic Studies74,3(2007),733–762.
[19] Alan G Hawkes. 1971. Spectra of some self-exciting andmutuallyexciting point processes.Biometrika 58, 1(1971),83–90
[20] Adrien Guille, Hakim Hacid, Cécile Favre, and Djamel A.Zighed. 2013.Informationdiffusion inonlinesocial networks:asurvey.SIGMODRecord42,2(2013),17–28
© 2024, IRJET | Impact Factor value: 8.226 | ISO 9001:2008 Certified Journal | Page2400