
International Research Journal of Engineering and Technology (IRJET) e-ISSN: 2395-0056
Volume: 11 Issue: 04 | Apr 2024 www.irjet.net p-ISSN: 2395-0072
International Research Journal of Engineering and Technology (IRJET) e-ISSN: 2395-0056
Volume: 11 Issue: 04 | Apr 2024 www.irjet.net p-ISSN: 2395-0072
Kushal Khivansara1 , Rushikesh Aher2 , Mahesh Swami3 , Dr.Prashant Awsarmal4
123 B.Tech Civil Engineer Engineering Department, Maharashtra Institute of Technology, Aurangabad- 431005 (Maharashtra)
4Head of Department, Civil Engineering Department, Maharashtra Institute of Technology, Aurangabad- 431005 (Maharashtra)
Abstract - A This project consist of collecting data related to solid waste management of Aurangabad city and “ROUTE OPTIMIZATION MUNCIPAL SOLID WASTE COLLECTION (WARD 109, AURANGABAD)”.Aurangabad is famous tourist city of the Maharashtra state. The problems associated with solid waste management in the city of Aurangabad require immediate attention and action. At the surface the reasons for improper solid waste management include growing population and city. Optimization of the routing system for collection and transport of solid waste thus constitutes an important component for productive solid waste management system. This study applied GIS and GPS technologies to map municipal solid waste collection system and identify optimum route for solid waste collection in the study area. A geographic information system (GIS) is a structure for gathering, managing, and analyzing data. It analyzes spatial location and organizes layers of information into visualizations using maps this study deals with optimization of routes for municipal waste collection using GIS network. Optimized route for solid waste collections are evaluated for different standards such as less fuel, shortest travel path, and minimum collection time for collection and best practices for future survey throughout thecity.
Index Terms: Geographic information system, Global positioning system, Minimum collection time, Municipal solid waste collection, Optimum route, Shortest travel path,Solidwastemanagement.
Waste management (or waste disposal) are the activities and actions required to manage waste from its inception toitsfinaldisposal.Thisincludesthecollection,transport, treatmentanddisposalofwaste,togetherwithmonitoring and regulation of the waste management process. Solid waste collection is a major section in the process of solid wastemanagement(SWM)anditisestimatedtoconsume uptotwothirdofentireSWMbudget
Solid Waste Management in all Municipalities and Corporations. several problems are experienced in solid wastemanagementthatinclude:
I. Inadequatewastecollection.
II. Poorroutingsystems.
III. Accumulation of garbage on streets, on open spacesandoncompounds.
IV. Lackofwastetreatmentanddisposalsites.
V. Highoperationalcostsandpoorcostrecoveryfor solidwastemanagement.
VI. InappropriateInformationManagementSystem.
AurangabadcityisoneofthemajorindustrialAurangabad city is one of the major industrial Waluj, Pandharpur and Paithan MIDC area. Due to urbanization and increase in population solid waste is major source of environmental pollution. Solid waste disposal poses a greater problem becauseitleadstolandpollutionifopenlydumped,water pollutionifdumpedinlowlandsandairpollutionifburnt. Aurangabad city is facing serious environmental degradation and public-health risk due uncollected disposal of waste on streets and other public areas, clogged drainage system by indiscriminately dumped wastes and by contamination of water resources near uncontrolled dumping sites. This project gives the brief idea of the current waste- generation, characteristics and management scenario in Aurangabad City, along with the associatedenvironmentalimpacts
Table -1: GeneralinformationaboutAurangabadcity
Aurangabad, Maharashtra
Latitude, Longitude 19.8762°N, 75.3433°E Total household 237559
Area 138.5Sq.Km NoofWards 115
TotalPopulation 1175116 NoofZones 09
International Research Journal of Engineering and Technology (IRJET) e-ISSN: 2395-0056
Volume: 11 Issue: 04 | Apr 2024 www.irjet.net p-ISSN: 2395-0072
1. The current Collection System of Aurangabad city wasstudiedanditwasasfollows:
• DoortoDoorcollection
• Wet/Drysegregation
2. The Study of Existing Routes was obtained with the helpofGPSEssentialandGeotracker.
• CurrentRoutesofvehiclescollectingwaste.
• DistanceAndTimeRelationship.
3. ThestudyofPresentTransportSystemincitywasas follows:
• RearLoaderVehicle
• SecondaryTransport(Compactors)
4. Togettheknowledgeofwastetreatmentprocessthe study of existing Treatment Plant was done in different part of city and which are in following areas:
a) Chikalthana Treatment Plant (This plant was in working condition with capacity of waste treating a 150MT)
b) Padegaon,KanchanwadiandHarsulTreatmentplant (Thesealltreatmentplantisunderconstruction)
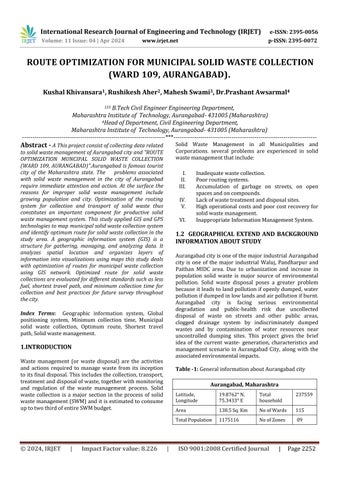
To optimize collection routes and to determine current collectionefficiencyitwasnecessarytostudytheexisting collection routes .This current collection route was identifiedwiththehelpofGPSessentialandGeotracker.
Figure - 1:ExistingRouteMapbyUsingGIS.

VehicleNo:
MH-20-659
VehicleNo:
MH-20-823
VehicleNo:
MH-20-832
Orange WardNo:109
Green WardNo:109
Blue WardNo:109
In this method, the number of individual loads is counted,andthewastecharacteristicsareestimated (typeofwaste,Estimatedvolume)
Weightisestimated,or,ifscalesareavailable,weight data are also recorded Unit generation rates are determinedusingthefielddata.
Residential area = 2000 homes, average of 3 people perhome
Observations at the scales (transfer station) per week:total=31751.615kg(5ton/day).
Unit Rate = (1)
=5.4kg/capita/week
=0..77kg/capita/day
Hence, according to calculations of Load count analysis it was obtained that the waste generated in our ward Per personwas0.77kg/capita/day
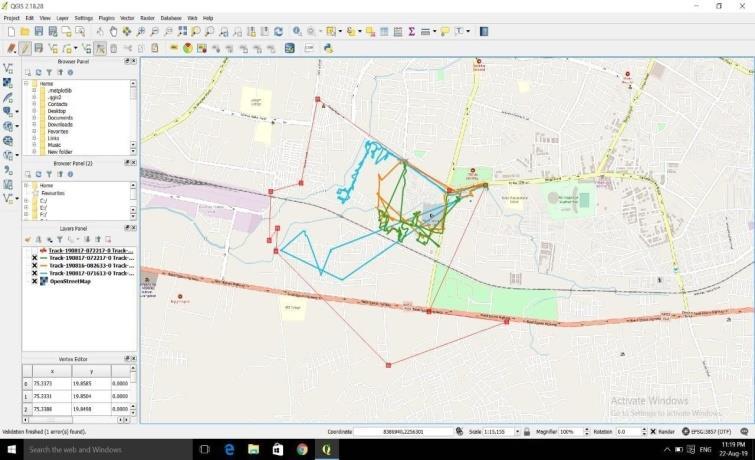
2.3 REPRESENTATION OF LOAD COUNT ANALYSIS ON GIS
Figure - 2:Areasofwardaccordingtotheweightofwaste collectiononGIS.
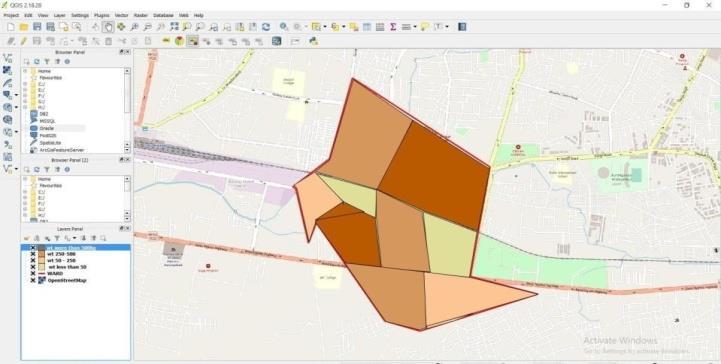
Table -3: Weight ofWasteGenerationinWard109
International Research Journal of Engineering and Technology (IRJET) e-ISSN: 2395-0056
Volume: 11 Issue: 04 | Apr 2024 www.irjet.net p-ISSN: 2395-0072
Forhauledcontainersystems:
Thcs = (Phcs + s + h) (2)
Where,
Thcs=timingofeachroundtrip,hr/trip
Phcs=pick-uptimepertrip,hr/trip
S=atsitetime(landfill,transferstation)pertrip,hr/trip
h=timepertrip,hr/triphaul
Using field data for various types of collection vehicles, haul time can be approximated by a straight-line relationship:
h= (a + bx)
Where:
a,b=empiricalconstants.
x=averageround-triphauldistance,miles.
so, time for eachround-tripbecomes:
Thcs= (Phcs + s + (a +bx)) (3)
Inourcase:
a) Phcs=2hr/trip,
b) S=1hour
c) Haulconstant:a=0.016hr/trip,b=0.018hr/trip,
d) x=48miles
Hence, timing for each round of trip was found to be 3.06hr/trip which was helpful for finding number of trips perday.
Nd = (H(1 – W) – (t1– t2) ) ÷ (Thcs) (4)
Where,
Nd =numberofroundtripsperday
H=lengthofaworkday,hours/day
W = off-route factor (lunch, pit-stops, etc),expressed as a fraction
t 1 =timetodrivefromgaragetofirstpickup,hours
t 2 =timetodrivefromlastpickuptogarage,hours
Thcs=timeforoneroundtrip,hr/trip
Thisallowsustoestimatethenumberofpickups,tripsand vehicles that are required for a community collection system.
Inourcase:
a) H=8hrs/day, b) W=15%=0.15, c) t1=3hr,
d) t 2=0.4hr,
e) Thcs=3.06
Hence, Number of trips per day was found to be 2 trips/day.
1. Determining time available for pick‐up per trip (Pscs)
Pscs = (H(1-W)-(t1+t2)-(s+a+bx)))/Nd -------(5)
2. Determining Pick-up time per location (tp):
2-person=1.35collector-min/location(fromfield observations=0.675*2)
3. Determining Number of pick-up locations completed per trip (Np):
Np = Pscs × ( n ÷ (tp) ) (6)
Where,
Pscs=Pickuptimeavailablepertrip
tp =Pickup time per pickup location, collectormin/location
n=numberofcollectors
Hence,Numberofpick-uplocationscompletedper tripwasobtainedas204Locations/trip.
According to all the calculations and rules of Environmental Protection Agency (EPA) a new optimized routewasdesignedusingQGISsoftwareasshowninfigno 3 which shows now most of the area in ward is getting cover and hence efficiency of waste collection is been increased.
International Research Journal of Engineering and Technology (IRJET) e-ISSN: 2395-0056
Volume: 11 Issue: 04 | Apr 2024 www.irjet.net p-ISSN: 2395-0072
1. The current collection routes are not efficient to collectwasteofwholewardinaparticularday.
2. The numbers of vehicles are not sufficient for collectionofwaste.
3. It was observed those crews were not wearing safetyequipmentssuchasgloves,mask,shoesetc.
4. It was also observed maintenance, repairing, washing of collection vehicle was not properly done.
5. On Chikalthana, Waste Treatment Plantthere was notanyfiresafetyarrangement.
4. CONCLUSIONS
Totalamountofmoneyspentforcollection,transportation anddisposalofsolidwaste,approximately50to70percent is spent on the collection phase. This fact is important as small percentage improvement in the collection operation can effect a significant saving in the overall cost use of QGIS application and our calculations in Aurangabad city hasshownreasonableimprovementinlengthoftheroutes andtraveltimeminimization.
The existing locations per trip were 300 and according to optimized routes no. of locations per trip are 408. Hence collectionroutesareoptimizedby26.5%
1. Tchobanaglous, G., Theisen,H. and Vigil, S.(1993) Integrated Solid Waste Management: Engineering Principles and Management Issues. McGraw-Hill, NewYork
2. Central Public Health and Environmental Engineering Organization (CPHEEO), Municipal SolidWasteManagementManual Part-1andpart2, (2016).MinistryofUrbanDevelopment,India. Source:http://cpheeo.nic.in/SolidWasteManagem ent2016.htm
3. Ghose, M.K., Dikshit, A.K., Sharma, S., 2006. A GIS based transportation model for solid waste disposal - a case study on Asansol municipality. WasteManage.26(11)
4. Apaydin O, Gonullu M T. 2008. Emission control with route optimization in solid waste collection process:acasestudy.Sadhana2008;33:2-71.
5. Afroz, R., Hanaki, K., Tudin, R., 2011. Factors affecting waste generation: a study in a waste management program inDhakaCity,Bangladesh. Environ.Monit. Assess.179,509–519.
6. Dene L O'Connor (2013)” Solid Waste Collection Vehicle Route Optimization for the City of Redlands,California”
7. Journal of Environmental protection, vol.10, October2013.