
International Research Journal of Engineering and Technology (IRJET) e-ISSN: 2395-0056
Volume: 11 Issue: 04 | Apr 2024 www.irjet.net p-ISSN: 2395-0072
International Research Journal of Engineering and Technology (IRJET) e-ISSN: 2395-0056
Volume: 11 Issue: 04 | Apr 2024 www.irjet.net p-ISSN: 2395-0072
Chandan Barik, Deepak Kumar Sahu, Rajat Dewangan, Priyanka Devi
B.Tech Student, Dept. Of Information Technology, Govt. Engineering College, Bilaspur, CG., India
B.Tech Student, Dept. Of Information Technology, Govt. Engineering College, Bilaspur, CG., India
B.Tech Student, Dept. Of Information Technology, Govt. Engineering College, Bilaspur, CG., India
Assistant Professor, Dept. Of Information Technology, Govt. Engineering College, Bilaspur, CG., India
Abstract - This study explores the utility of house price prediction in facilitating informed decision-making for both developers and potential buyers. While the House Price Index(HPI)isawidelyemployedtoolforestimatinghousing price fluctuations, the intricate relationship between housingpricesandvariousfactorssuchaslocation,size,and demographics necessitates additional data for accurate individual price predictions. Despite the abundance of research utilizing traditional machine learning methods to forecast housing prices, there is a notable lack of focus on evaluating the performance of individual models and a tendency to overlook more sophisticated, albeit less mainstream,approaches.
The Global House Price Prediction System project aims to enhance efficiency, accuracy, consistency, and risk mitigation in decision-making processes related to house price predictions. Key objectives include streamlining processes, leveraging historical data and machine learning for accuracy, ensuring consistency in decision-making, minimizing lending risks, creating a user-friendly interface, implementing robust security measures, and conducting thoroughtestingandvalidation.
Key Words: Correlation Analysis, Mitigation, Regression, Scalability,SupervisedLearning,Outliers,PriceIndex.
Typically, the House Price Index captures the aggregated fluctuationsinresidentialpropertyvalues.Toenhancethe ease of house hunting for families, we have refined the process by soliciting specific criteria such as desired square footage, number of bedrooms, and bathrooms. Employing preloaded datasets and innovative data features, this paper explores practical data preprocessing and inventive feature engineering techniques. Additionally, it introduces a regression technique within machine learning to forecast house prices. The primary advantages of this project lie in addressing the conservative budgeting and market strategies of prospective homebuyers. It aims to streamline operations and enhance efficiency, offering customers a swift and reliablemethodfordetermininghouseprices.Byensuring transparency and fairness, the project seeks to prevent usersfrombeingmisledorexploited.Ultimately,itsgoalis to empower users to search for homes within their
budgetary constraints, facilitating a smoother and more informedhomebuyingprocess.
Real estate markets are subject to intricate webs of economic, social, and environmental forces. Crafting a modelcapableofcomprehensivelycapturingandanalyzing thesedynamicsposesaformidablechallenge.
Globalhousepricedatamayoriginatefromamyriadof sources, each varying in reliability and completeness. Tackling the task of cleaning, preprocessing, and harmonizing data across diverse regions and formats presentsasubstantialhurdle
Housing markets exhibit temporal and spatial fluctuations, with distinct regions experiencing unique trends and cycles. A robust model must adeptly accommodate these variations to furnish precise predictionsacrossheterogeneousgeographicallandscapes
The discernment of pertinent features and their seamlessintegrationintothemodelispivotalforensuring prediction accuracy. Feature engineering plays a pivotal role in transforming raw data into meaningful predictors capableofcapturingunderlyingpatterns.
Crafting a model that not only excels on historical data but also extrapolates effectively to unseen data is paramount. Striking a balance to mitigate overfitting or underfitting, which could lead to erroneous predictions, representsaformidablechallenge
Fostering transparency in the predictive process holds paramount importance, particularly in the realm of real estatewheredecisionscarrysignificantramifications.The
International Research Journal of Engineering and Technology (IRJET) e-ISSN: 2395-0056
Volume: 11 Issue: 04 | Apr 2024 www.irjet.net p-ISSN: 2395-0072
development of an interpretable model capable of elucidating the factors influencing predictions emerges as apivotalendeavor.
Ensuring the model's scalability to accommodate vast swathesofdatafromheterogeneoussourcesisimperative. This scalability not only enhances applicability to global markets but also facilitates adaptability to evolving data landscapesovertime.
2.1 Logistic Regression:-Logistic regression, a cornerstone of supervised learning, excels in classification endeavors, tasked with predicting the likelihood of an instancebelongingtoaspecificclass.Leveragingasigmoid function on the linear regression output, it aptly earns its namedespiteitsclassificationfocus.Theprocessoflogistic regressionmodelinginvolvesseveralkeysteps:
Problem Definition: Begin by identifying the dependent and independent variables, determining whether the problemisbinaryclassification.
DataPreparation:Cleanandpreprocessthedatatoensure it'ssuitableforlogisticregressionanalysis.
Exploratory Data Analysis (EDA): Visualize relationships betweenvariables,detectingoutliersoranomalies.
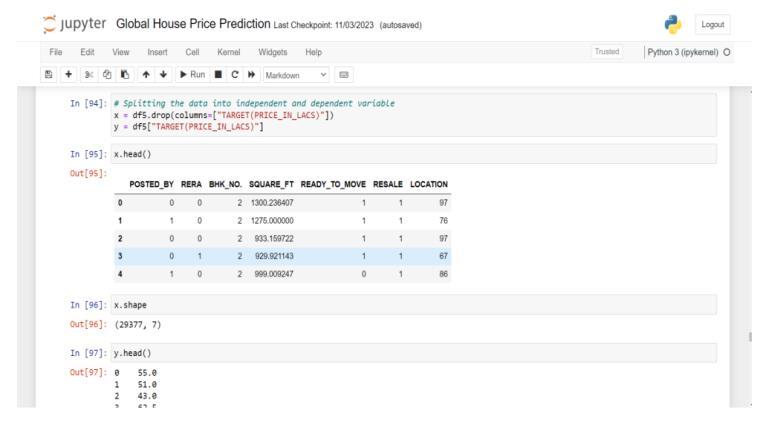
Feature Selection: Choose independent variables with significant relationships to the dependent variable, eliminatingredundantorirrelevantfeatures.
Model Building: Train the logistic regression model onthe selectedvariables,estimatingcoefficients.
Model Evaluation: Assess model performance using metrics like accuracy, precision, recall, F1-score, or AUCROC.
Model Improvement: Fine-tune the model based on evaluation results, adjusting variables, adding new features, or employing regularization to counter overfitting.
ModelDeployment:Deploythelogisticregressionmodelin practical scenarios, making predictions on new data. The accuracyofthismodelis80%.
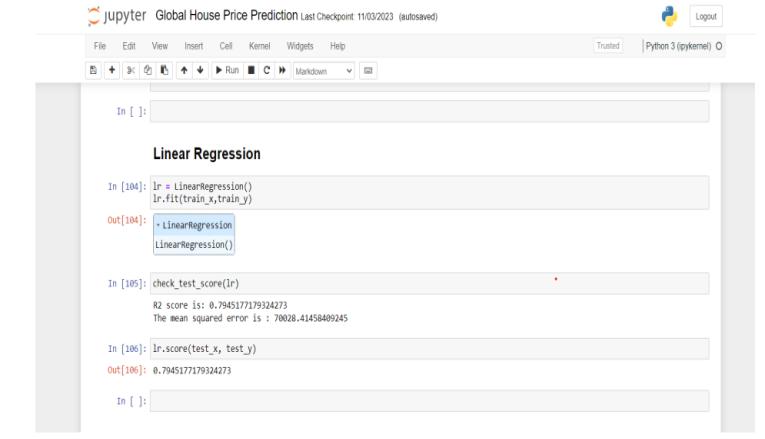
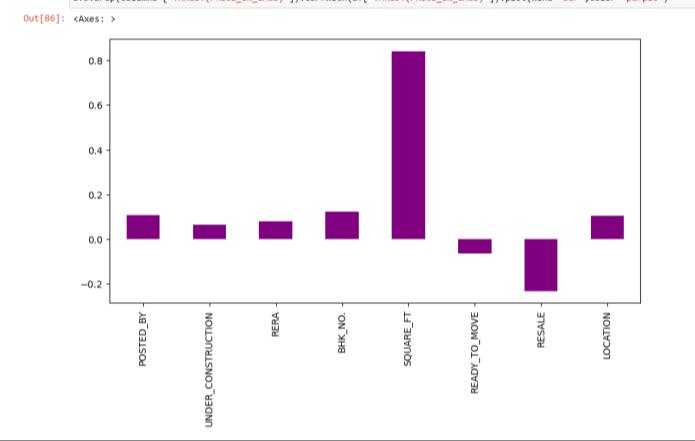
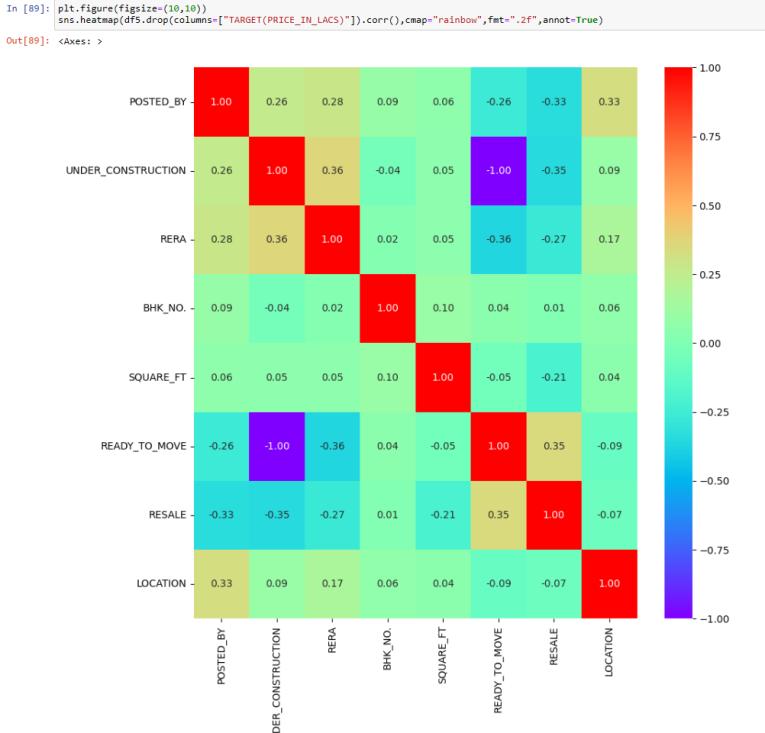
2.2 Correlation Analysis:-Correlation analysis is a statistical technique used to evaluate the strength and direction of the relationship between two quantitative variables. It helps identify whether and how much two variables change together. The correlation coefficient, usuallydenotedby
r,rangesfrom-1to1,where:
r=1:Perfectpositivecorrelation(asonevariableincreases, theotheralsoincreaseslinearly).
r=−1: Perfect negative correlation (as one variable increases,theotherdecreaseslinearly).
r=0: No correlation (the variables do not have a linear relationship).
Correlation analysis is crucial in various fields such as economics, finance, psychology, and epidemiology, among others,tounderstandrelationships between variables and makeinformeddecisions.
International Research Journal of Engineering and Technology (IRJET) e-ISSN: 2395-0056
Volume: 11 Issue: 04 | Apr 2024 www.irjet.net p-ISSN: 2395-0072
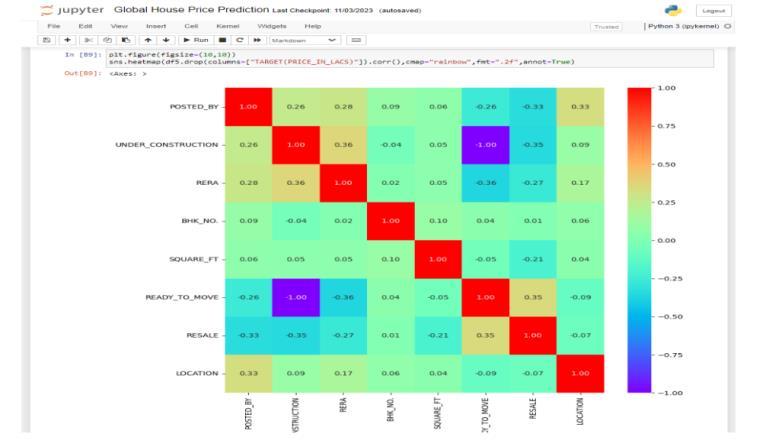
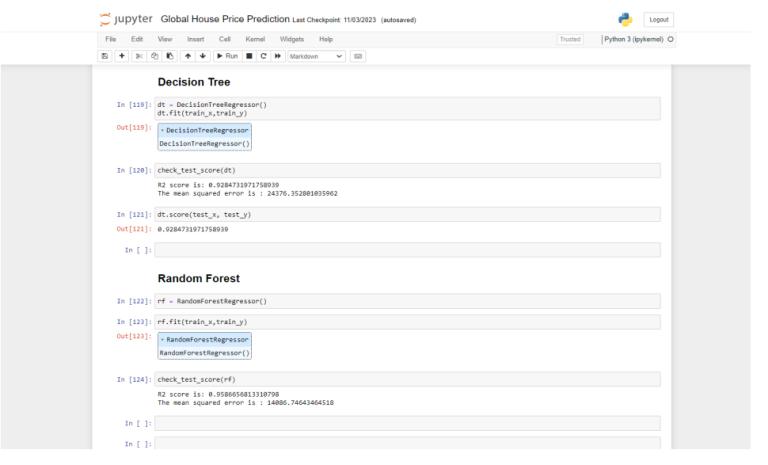
2.3 Random Forest Algorithm:- Random Forest stands as a widely embraced machine learning algorithm within the realm of supervised learning. Its versatility extends to both Classification and Regression tasks in ML. Rooted in the principle of ensemblelearning,it harnessesthe power of multiple classifiers to tackle intricate problems and elevate model performance. The accuracy of this model is 98%.
2.4DecisionTree:- Acornerstoneofsupervisedlearning, the decision tree method proves invaluable for both classification and regression endeavors. Constructing a tree-like structure, it employs internal nodes for attribute tests, branches for outcomes, and terminal nodes for class labels. Through recursive partitioning of training data basedonattributevalues,ititerativelyrefinesitsstructure untilmeetingpredefinedcriterialikemaximumtreedepth or minimum node samples. Analyzing datasets begins at the root node, assessing attribute values against dataset records,andnavigatingbranchesuntilreachingleafnodes. This iterative process continues through subsequent nodes, comparing attributes with sub-node values until arriving at the tree's terminus. The accuracy of this model is93%.
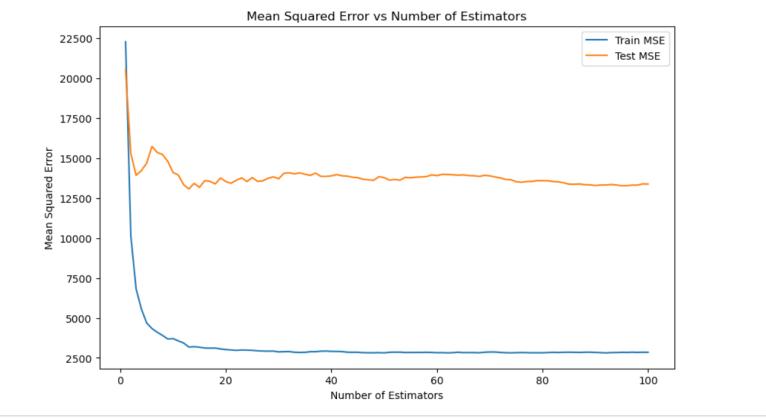
-1: Train&TestData
The training data is used to train the model by feeding it with examples and their corresponding correct outcomes, allowing the model to learn patterns and relationships withinthedata.Thisphaseinvolvesadjustingthemodel's parameters to minimize errors and optimize its performance.
On the other hand, the test data also referred to as the validation or evaluation set, is kept separate from the training data and is used to assess the model's performance on unseen data. By evaluating the model's predictions against the actual outcomes in the test set, researchers can gauge its generalization ability and how wellitperformsonnew,unseendata
"DataVisualization"isthegraphicalrepresentationofdata and information to communicate insights and patterns effectively. It serves as a powerful tool for understanding complex datasets, identifying trends, and making datadriven decisions. data visualization is a multifaceted process that involves understanding the data, selecting appropriate visualization techniques, applying design principles, incorporating interactivity, and storytelling, considering the audience, and leveraging relevant tools and technologies to effectively communicate insights and facilitatedata-drivendecision-making.
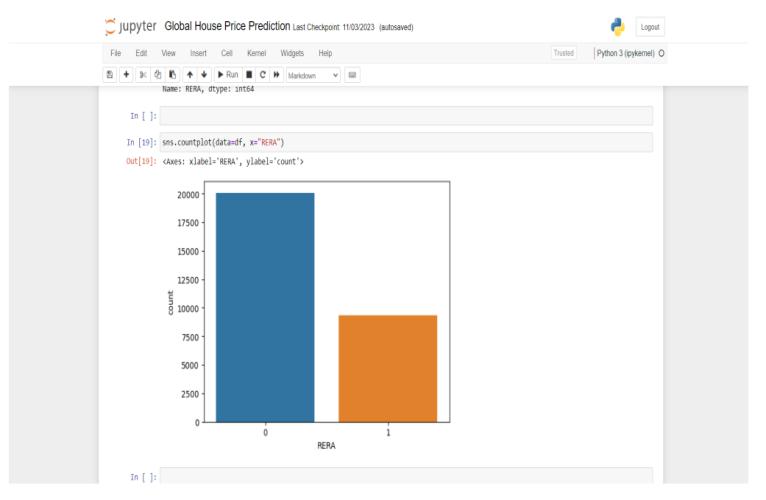
-2:DataVisualization
International Research Journal of Engineering and Technology (IRJET) e-ISSN: 2395-0056
Volume: 11 Issue: 04 | Apr 2024 www.irjet.net p-ISSN: 2395-0072
Model Building Using Gradient Boosting" refers to the process of constructing predictive models using the gradient boosting technique,a powerful machinelearning algorithm known for its effectiveness in various tasks, includingregressionandclassification.
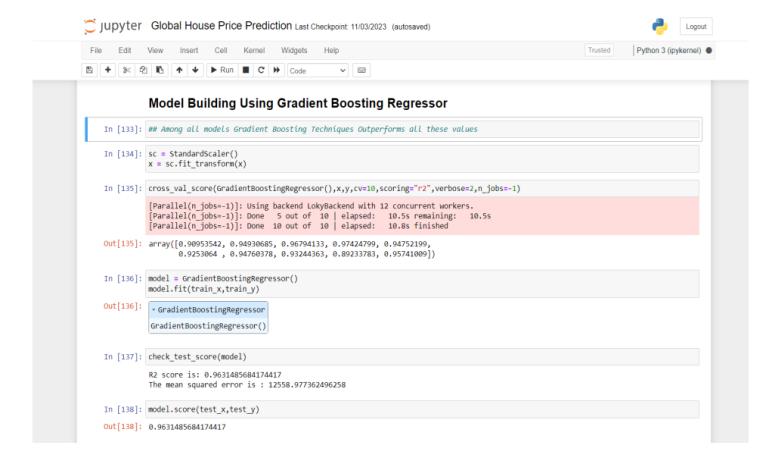
Gradient boosting is an ensemble learning method that works by combining multiple weak learners, typically decision trees, to create a strong predictive model. The process involves sequentially adding new models to correcttheerrorsmadebypreviousones.Eachnewmodel is trained on the residuals (the differences between the predicted and actual values) of the previous models, therebygraduallyreducingtheoverallpredictionerror.
The "web application of house price prediction model" abstractencapsulatesthedevelopmentanddeploymentof an online platform where users can input relevant data about a property, and the application provides a prediction of the property's price based on a machine learningmodel.
DataInputInterface:Thewebapplicationprovidesauserfriendlyinterfacewhereuserscaninputinformationabout the property they are interested in, such as location, size, number of bedrooms, amenities, and other relevant features.
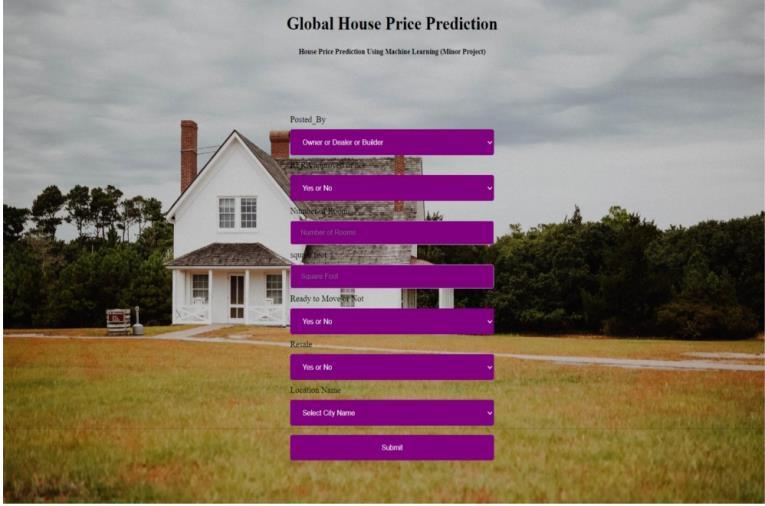
This interface includes dropdown menus, text fields, sliders,orinteractivemapsforselectinglocations.
Integration with Machine Learning Model: Behind the scenes, the web application integrates with a machine learning model trained on historical housing data. This model uses algorithms such as regression or gradient boostingtoanalyzetheinputdataandpredictthepriceof theproperty.
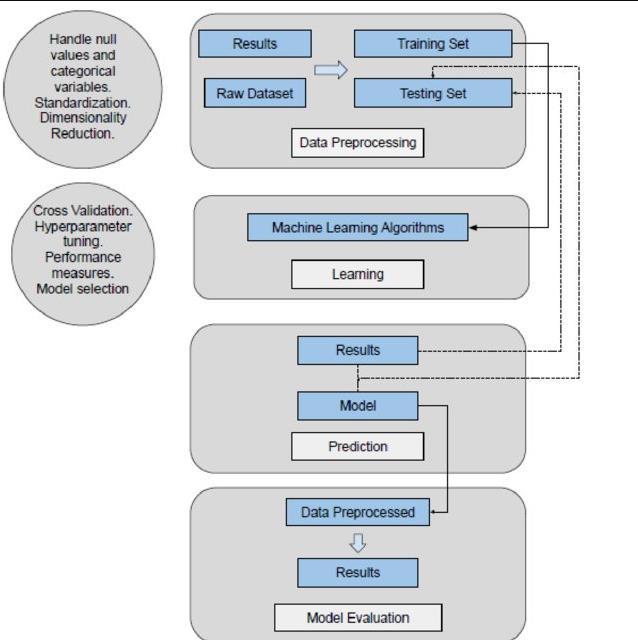
Fig -5:SystemArchitecture
AlgorithmsandTheirPerformances:
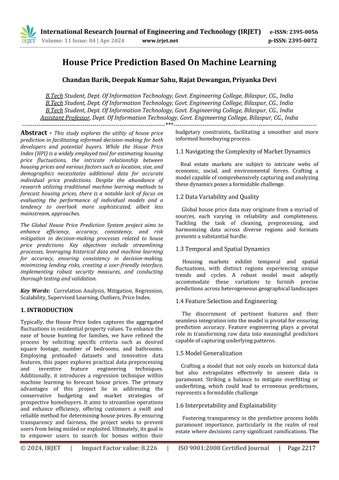
LinearRegression–80% Accuracy
DecisionTree–93%Accuracy
RandomForest–96%Accuracy
International Research Journal of Engineering and Technology (IRJET) e-ISSN: 2395-0056
Volume: 11 Issue: 04 | Apr 2024 www.irjet.net p-ISSN: 2395-0072
A worldwide initiative focused on forecasting housing prices could prove immensely beneficial for individuals, investors, and stakeholders within the real estate sector, offeringvaluableinsightsintopropertyvaluations,market trends,andriskassessment.Nonetheless,theeffectiveness and significance of this endeavor are contingent upon severalcrucialfactors
DataQuality.
● MachineLearningModels.
● User-FriendlyInterface.
● TransparencyandTrust
Overall, these potential developments reflect the evolving nature of the real estate market and advancements in technology,indicatinga promisingfutureforglobal house price prediction projects. These enhancements aim to improve the accuracy, reliability, and usability of prediction models while leveraging new data sources and analytical techniques to address the complexities of the realestatemarket.
[1] House Price Index. Federal Housing Finance Agency. https://www.fhfa.gov/ (accessed September 1, 2019)M. Young, The Technical Writer’s Handbook. MillValley,CA:UniversityScience,1989.
[2] Fan C, Cui Z, Zhong X. House Prices Prediction with Machine Learning Algorithms. Proceedings of the 2018 10th International Conference on Machine Learning and Computing ICMLC 2018. doi:10.1145/3195106.3195133
[3] Phan TD. Housing Price Prediction Using Machine Learning Algorithms: The Case of Melbourne City, Australia. 2018 International Conference on Machine Learning and Data Engineering (ICMLDE) 2018. doi:10.1109/icmlde.2018.00017.
[4] MuJ,WuF,ZhangAHousingValueForecastingBased on Machine Learning Methods Abstract and Applied Analysis,
[5] WolpertDHStackedgeneralizationNeuralNetworks, 5(1992),pp.241-259
[6] https://profile/ValderiLeithardt/publication/343500 604/figure/fig1/AS:921812657520642@159678867 2330/Roadmap-for-applying-Machine-Learningalgorithms-in-predictive-analysis-Raschka-and.png