
International Research Journal of Engineering and Technology (IRJET) e-ISSN: 2395-0056
Volume: 11 Issue: 04 | Apr 2024 www.irjet.net p-ISSN: 2395-0072
International Research Journal of Engineering and Technology (IRJET) e-ISSN: 2395-0056
Volume: 11 Issue: 04 | Apr 2024 www.irjet.net p-ISSN: 2395-0072
Kunal Singh Rawat1 , Dr. D.K. Bhalla2
1B.Tech. Mechanical Engineering (Evening) Scholar, School of Mechanical Engineering, Lingaya’s Vidyapeeth, Faridabad, Haryana, India
2Professor and LEET Coordinator B.Tech., M.Tech., PhD, FIE in Lingaya’s Vidyapeeth, Faridabad, Haryana, India ***
Abstract- The city gas distribution (CGD) industry is impactedbyanumberofvariables,includinginfrastructure, regulation,health,andsafety.Anexploratoryfactoranalysis iscarriedouttocomprehendthisindustry.Withoutarriving at a predefined conclusion model, the Exploratory Factor Analysis (EFA) survey methodically streamlines related proceduresand investigates the potential causativefactor structureofanumberofmeasuredvariables.Todetermine the most important factors impacting the industry, this articledoesafactoranalysisinthreemajorcategories:site workers, technical level, and management level. Sixty surveyswerecreatedtogetinputonfactorsinfluencingthe CGD industry. The survey is conducted via a number of channels, including personal meetings, employee appointments, email, phone calls, and Google Forms. The survey results indicate that the nine elements have an impact on this industry and need specific changes for its development.Fiveoftheseninefactors theinfrastructure component,thepolicyfactor,thepetrolconsumptionfactor, theoverallenergydemandfactor,andtheeconomyfactor werechosenforinvestigation.Fivemainphaseshavebeen taken in the factor analysis process: factor analysis applicability, factor selection, factor loading, factor significance test, and factor loading matrix analysis. The findings of this exploratory factor analysis indicate that factorsotherthanpolicyandpetrolconsumptionthathavea greater impact on the CGD market include infrastructure, overallenergydemand,andtheeconomy.
Keywords: CGD,EFA,Petrolconsumptionfactors,energy demandfactoretc.
2018sawanotableincreaseintheworld'sneedfornatural gas. The annual growth rate of production and demand startedtoaccelerateto4.9percent(179BCM),thefastest pacesince2010,whenconsumptionstartedtorecoverafter the global financial crisis. In 2018, gas constituted about 50%oftheglobalincreaseinprimaryenergydemand(Birol, 2019). It is anticipated that natural gas would be more significantinIndiawhenitcomestopossibleimprovements inairquality(Dudley,2019).TheIndiangovernmentsetits firstnationalgoalforbetteringairqualityin2018,aimingto cut particle emissions by 20–30% by 2024. The Indian Petroleum and Natural Gas Regulatory Board held two roundsofbiddingfor newcitygasdistributionlicencesin 2018–19 in order to achieve this goal. More new licences
thanalloftheonesthatarenowinuseweregranted atotal of136.Theobjectiveistopromotethedevelopmentofover $14 billion to increase natural gas accessibility in Indian cities,thereforeenablingitsutilisationfordomesticcooking, small-scaleindustrial processes,andthetransportation of natural gas-powered vehicles (Vliet, 2019). The City Gas Distribution (CGD) industry in India is expected to grow fromaround9223MMSCM(MillionMetricStandardCubic Metres)from2020to25,570MMSCMby2030,growingata rateof10%annually.Increaseddemandfornaturalgasfrom themanufacturing,automotive,commercial,andresidential end-user sectors is predicted to fuel market expansion. A growing number of businesses are being permitted and licencedtooperateinCGDsectorsindifferentgeographies around the nation in rounds 9 and 10, thanks to an increasing variety of beneficial measures adopted by the IndiangovernmentintheCGDmarket(Singhal,2019).For instance, Indian Oil Corporation and Adani Gas Limited securedthemostnumberofgasdistributionlicencesin17 and 15 geographical areas, respectively, in the ninth and tenthroundsofcitygasdistribution.
Thetransition toa gas-basedeconomy isalsoexpected to createemploymentinthenationsincegasisaninexpensive and ecologically benign fuel. The recently amended laws madeitpossibleformorepublicandprivatecompaniesto participateintheCGDmarket,whichenhancedthecoverage oftheCGDnetworkto228GA,whichcovers52.80%ofthe country'slandareaand70.86percentofthecumulativetotal population. The distribution of city gas in India may be classifiedaccordingtoitskind,supply,end-useindustry,and area. The CNG category drove India's petrol distribution earningsin2019,whichresultedinstringentenvironmental lawsandanincreaseinthe numberofcars inthecountry equippedwithCNG.Overthecourseoftheprojectedperiod, a sharp rise in the nation's CGD industry is predicted, bolstered by the PNG and CNG sectors (Techsci Research, 2020).Naturalgasseemstobeessentialforacountryandis critical to economic progress because of the increased energy demand (Dudley, 2018). In the Indian natural gas market, the City Gas Distribution segment is expanding quickly.Anumberofvariables,includinginfrastructureand natural gas prices, have an impact on the network's expansion. According to Moller and Lund (2010), the pipeline is seen as a safe, affordable, and efficient way to move gas from an upstream gas field or terminal to refineries or downstream consumers. Should the pipeline have an unanticipated breakdown, civilization will be
International Research Journal of Engineering and Technology (IRJET) e-ISSN: 2395-0056
Volume: 11 Issue: 04 | Apr 2024 www.irjet.net p-ISSN: 2395-0072
severelydisruptedanddestroyed.Inthecaseofanincident or business interruption, the pipeline operators must identify,eliminate,monitor,avoid,ortransfertheriskwhile providingregularservice.Regardinghowto maintainsafe and efficient pipeline transport, the risk associated with pipeline activities has become a contentious topic among internationalpipelineoperatingcorporations(JalilVegaet al., 2018). Many research on the hazards associated with pipeline activities are conducted from various angles. For example,ananalysisisconductedonthefeasibilityofcrosscountrygaspipelinesinIndia (Jalil Vega etal.,2018).The dangersthathavebeendiscoveredareexaminedandtaken into consideration for the construction of an Indian gas pipeline project (Shan et al., 2017). In order to assess the riskassociatedwiththepipeline,theSavadkoohproblemin Iran is examined (Unternaehrer et al., 2017). Following a natural catastrophe, possible threats to the networks of natural gaspipelinesarediscovered(Panetal.,2017). An assessmentismadeofthedangerthatlandfillslipsduring development provide to China's long-term gas pipeline project(Alhamwietal.,2017).HanandLee(2011)evaluated theriskandperformanceofaterminalgaspipelinetransport network operating under various service circumstances. Bothqualitativeandquantitativeanalysesareconductedon theinfrastructureofurbangaspipelines(Guoetal.,2016). Fuzzylogicisusedtodeterminetheuncertaintyrelatedto thepipelineriskanalysis(Guoetal.,2017).Fornaturalgas pipelines,quantitativeriskassessmentisadvised(Ghatikar etal.,2016).
Aneffortismadetocomprehendtheaspectsimpactingthe City Gas Distribution industry in this article. Nine key elementsthathavethegreatestimpactonthisindustrywere found after an exploratory survey was conducted. Five of theseninefactors theinfrastructurefactor,policyfactor, petrolconsumptionfactor,totalenergydemandfactor,and economic factor were chosen for the factor analysis procedure. The factor analysis's findings indicate that the CGDsectorismoreimpactedbytheeconomy,infrastructure, and overall energy demand than by factors like petrol consumptionandpolicy.
Thequestionsposedandthecoreelementscollectedforthe CaptainofIndustry(upperauthoritypeople),Middle-level Authority (technical people), and Lower Level People (vendors and third party people) form the basis of the factorialanalysis.Thefollowingisaninterpretationofthe industry'sresponse:
Buildinginfrastructureshouldbeamajorresponsibilityof thegovernment,withlessemphasisonshort-termdemand. This may function as a network developer and facilitator (Fig.1).Thegovernmentshouldworktoincreasesupport for the CGD industry via initiatives like the Viability Gap
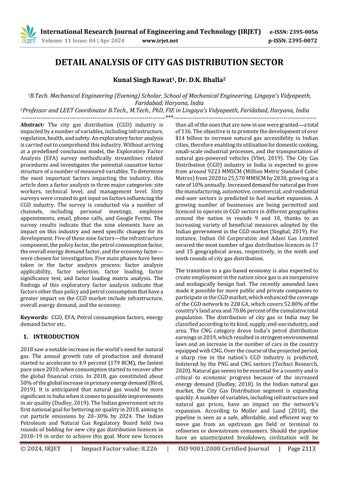
support (VGF) and Public Private Partnership (PPP). A government grant will provide financial assistance to the prospectiveprivatebusinessundertheVGFprogrammefor PPP-basedgaspipelineinitiatives,thereforeincreasingthe projects'economicpotential.PPPeffortsserveasameansof enticingtheprivatesectortoinvestinanddevelopcapitalintensive gas transmission projects that need a lengthy gestation time. Because there is no consensus on this statement in our poll, the market cannot foresee the government'sengagementinPPPandVGFatthistime(Fig. 2).
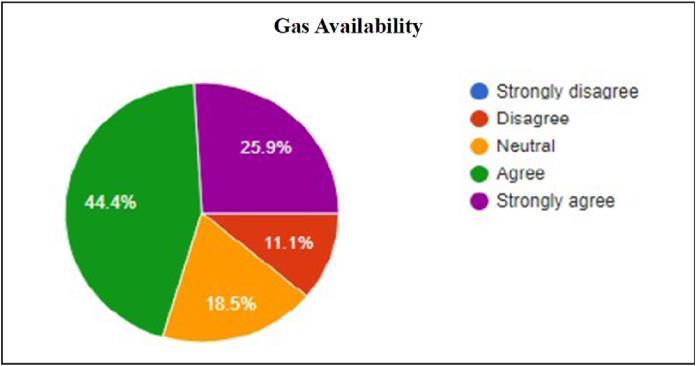
OneimportantelementinthefasterimplementationofCGD networks is providing one window approvals to the CGD network.InIndia,thestateoftheeconomyhasnoeffecton petrolprices.Thereisstillgovernmentinterventioninthe market.Theregulatoryframeworksandregulationsarestill developingandhavenotyettakenform.variousregionsof the nation have various gasoline tax rates. This causes differencesinthesupplyofpetrolandotherfuelsaswellas variationsinthepriceofpetrol.Therefore,itisadvisedthat the tariff be rationalised in a separate state. 64.3%. According to our study, the respondents agree with this assertion(Fig.3).The2016budget'slimitationsonthesale ofinterstatepetrolarebeingexaminedbytheindustry(Fig. 4).TofurtherexpandCGD,localtaxeswouldbeeliminated, domesticgaswouldcontinuetobesenttoCGDagenciesona prioritybasis,CGDbusinesseswouldplaceastrongfocuson customer-centeredinitiatives,andtheoperationalelements of gas supply pipelines and health would be better understood.Asaresult,itseemsthatallrespondentsagreed thatthereshouldbenopossibleconflictsofinterestinthe government or regulatory framework that serves as a foundationforthegrowthofCGDbusinesses.Government restrictionsandpromptpermission-grantingareessential for the development of our nation's city gas distribution industry(Fig.5).
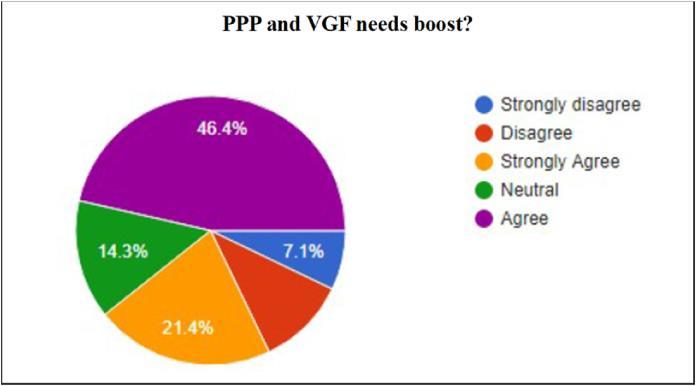
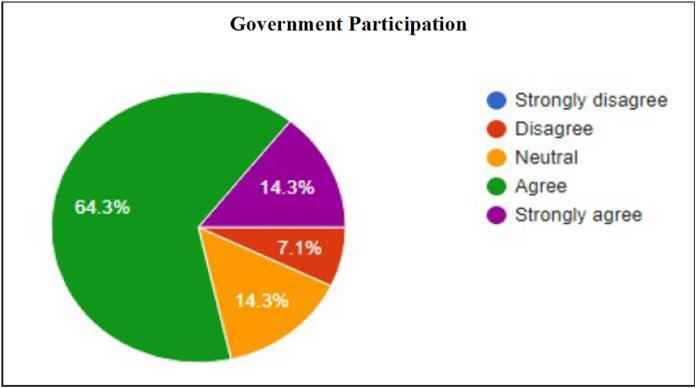
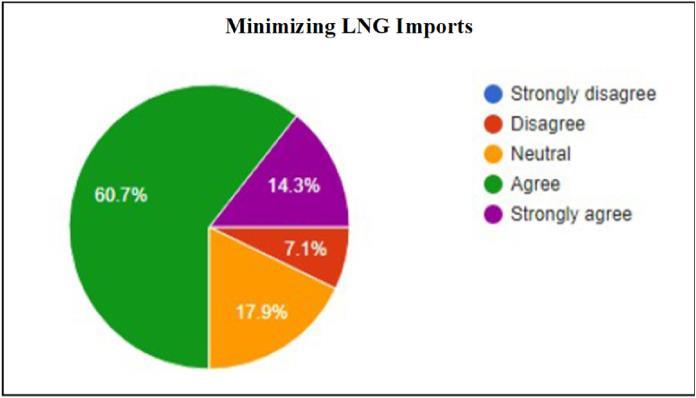
Lack of gas supply and a protracted licence granting time have a detrimental effect on management choices since private companies are more inclined to participate in lucrativeventuresratherthansitaboutwithcapitalfundsin hand(Fig.6).Over60%oftheparticipantsbelievethatalack ofgassupplyhasanegativeimpactonmanagerialchoices, whichiswhymanyprojectsstallout.Reducingconsumption isnecessarytoreduceLNGimports.Thisrequirementwillbe drivenbytheincreasedemphasisonreducinggreenhouse gasemissionsandtheuseofnaturalgasasasaferandmore energy-efficientalternative. Theonlyhindranceisthefact that natural gas's fuel dynamics vary depending on the market. Natural gas costs have significantly decreased internationally,andgovernmentactionisneededtopromote naturalgasusageincertainindustries(Fig.7).
International Research Journal of Engineering and Technology (IRJET) e-ISSN: 2395-0056
Volume: 11 Issue: 04 | Apr 2024 www.irjet.net p-ISSN: 2395-0072
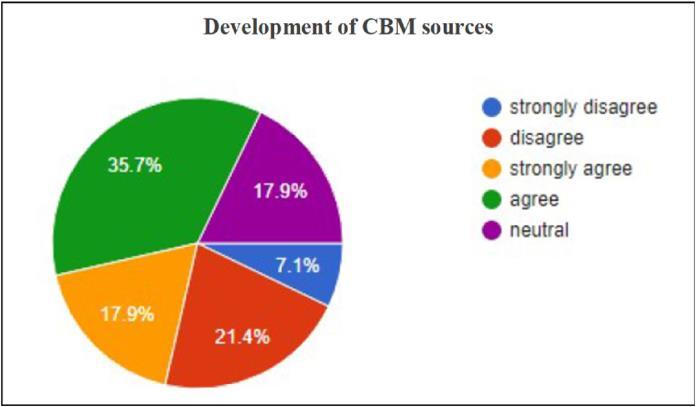
The majority of those who responded to the poll are in favour of using coal bed methane (CBM), one of India's unconventional hydrocarbon sources, for commercial purposes (Fig. 8). The new HELP programme's uniform licencingpolicyforpetroleumexplorationandproduction also permits a business to exploit other unconventional hydrocarbons,suchasCBMandshalegas.

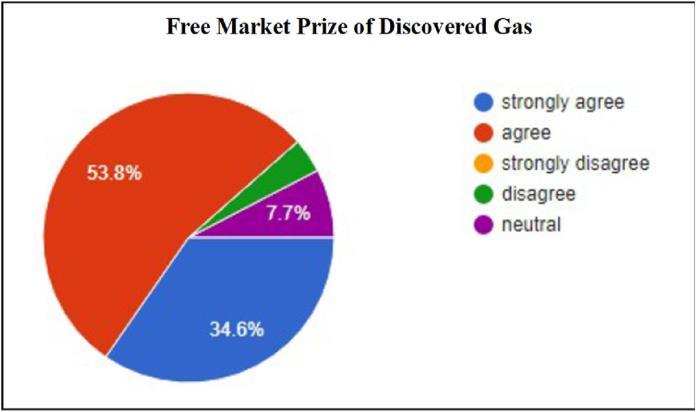
About 75% of respondents believe that there is a strong basisforraisingdomesticpetrolprices,andthisopinionwas supported by our poll. Gas produced domestically is now priced using average gas prices from gas-surplus nations includingtheUS,Russia,andCanada.GOIisgettingreadyto exportgasinthefuturefromdeep-water,ultra-deep-water, high-pressure,andhigh-temperatureregions,withasharp riseinsupplyandadeclineindomesticproduction(Fig.9). However, given that fresh deep-water discoveries vary in cost and risk from USD 6e7 per MMBTU, the industry is certain that the existing pricing system does not provide sufficientchancesfordomesticcapitalinvestment.
Investors at the LNG regasification terminal preferred operations without mandatory third-party access rules in the contemporary cities seeing sector expansion. The primaryreasontheDahejterminalstartedregasifyingwas foritsjointventure,PetronetLNGLtd(PLL),whichimports LNGunderlong-termcontracts.Nevertheless,ithasbegunto sell electricity to other merchants, such Gujarat State Petroleum Corporation (GSPC), in contrast to its equity owners.TheKochiportwasfarfromcompletelyoperational, butitwouldmostlikelyadoptDahej'sstyle.Reliance,GSPC, and Regasified Coal operate the Dahej LNG facility. As a result,theportofDabhoihasregasifiedgoodsthatitsowner has imported and sold. Although not yet completely operating,theKochiterminalcouldadoptDahej'sstrategy.
International Research Journal of Engineering and Technology (IRJET) e-ISSN: 2395-0056
Volume: 11 Issue: 04 | Apr 2024 www.irjet.net p-ISSN: 2395-0072
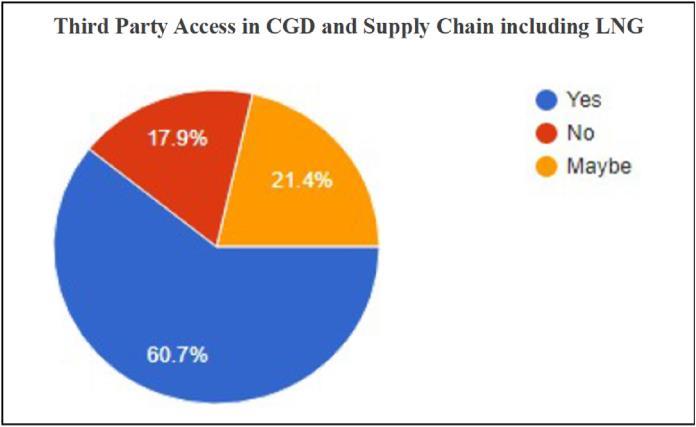
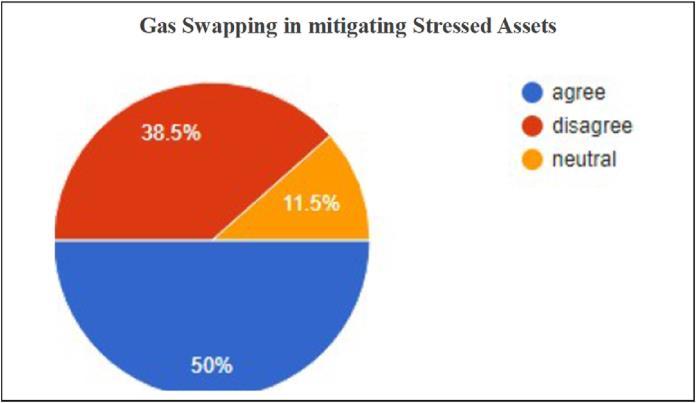
In the future, these ports have the option to change their business plan to provide access to other businesses. The most recent However, terminals often use a variety of businessstrategies.TheproposedMundraTerminalwillbe nodifferent.Similarly,theJafrabadandChharaterminalsare intended to provide the necessary parties with long-term electricityimmediatelyupfront.TheJaigarhimportterminal isprobablygoingtoprovidemostoftheircapacityunderthe tollroadparadigm.Itwillguaranteeadelicateequilibrium thatprotectstheinterestsofIndiangasproducersandusers. Similartothis,themajorityofsurveyparticipantssaidthat CGD should demand the proposed access of third parties, howeverfairly(Fig.10).Halfofthesurveyrespondentssaid thatgasexchanginghadbeeneffectiveinreducingstrained properties.Theyfeltthattherespondentswerehesitantto saywhetherornotthegasexchangeprogrammeachieved thegoalsoftheindustry.Nomatterwhatkindofgasitisor where it comes from, being close to the source helps to minimisedependencyonpipelinetransportation(Fig.11)
Factor analysis makes use of mathematical approaches to findpatternsinavarietyofparametersbysimplifyingthe interrelatedmetrics.Thisstatisticalmethodisusedtoassess the dimensionality of a collection of variables (Pallant,
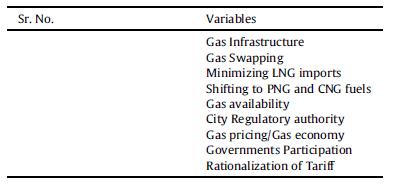
2011).Thefundamentalideabehindfactoranalysisisthat severalmeasuredvariablesexhibitaconsistentbehavioural patternbecausetheyareallconnectedwithalatent(i.e.,not clearlydefined)variable.Confirmatoryfactoranalysis(CFA) and exploratory factor analysis (EFA) are the two main techniquesinfactoranalysis(Matsunaga,2010).CFAuses pathanalysismodelstodescriberesearchvariablesandaims to verify assumptions. EFA looks through the information and tests hypotheses in an effort to identify complicated patterns(Zeynivandnezhadetal.,2019).EFAcallsforactions like gathering samples, getting a matrix of correlations, decidinghowmanyfactorstoinclude,extractingyourfirst setoffactors,rotatingyourfactorstogetthebestoutcome, definingyourfactorstructure,andcreatingfactorscoresfor additionalresearch.Thefactoranalysisapproachknownas EFAhasbeenmodifiedforthisinvestigation.Questionnaires with around sixty items were created for the exploratory survey. These were categorised into three groups: site workers,technicallevelworkers,andmanagerswithcurrent experience in the CGD business. These inquiries were developed with the assistance of literature reviews and discussions with subject-matter specialists from CGD industries. Nine variables such as gas supply, gas infrastructure, municipal regulatory authority, tariff rationalisation,etc. arechosenforthispaper.Anumberof dummyrunswereperformedonFAoncethefactorswere chosen.Thereal exam tobe administered wasdecided by tabulatingthefakeresults.Becauseitofferedinsightintothe kindsofoutcomesthatmaybeanticipated,thiswasacrucial stage. After the survey's real data was acquired, a factor analysiswascarriedoutusingthatinformation.Toarriveat the final findings, the data were collated and analysed. Equation (1) is used to analyse the factor analysis.(Li and others,2017):
where. Ykt represents the tth observed value of the kth variable, bkn denotes the load of the kth variable's nth component, Fnt denotes the tth observed value of the nth factor, and ukt is the tth peculiarity of the kth variable. ThevariablesutilisedinfactoranalysisareshowninTable1.
International Research Journal of Engineering and Technology (IRJET) e-ISSN: 2395-0056
Volume: 11 Issue: 04 | Apr 2024 www.irjet.net p-ISSN: 2395-0072
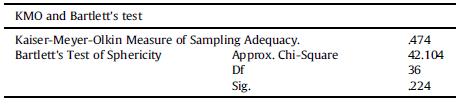
4.1. Applicability of factor analysis
Themostsignificantoutcomeforfactoranalysisapplicability is the test of sample adequacy. Among these methods for estimatingfactoranalysisapplicabilityisKaiser-Meyer-Olkin (KMO). Knowing how well the data are suitable for factor analysis is known as the KMO check (Table 2). This exam
evaluatesthesampleasawholeaswellasthecompetencyof eachvariableintheanalysis.Statisticsarecomputedofthe variationacrossvariables,someofwhichcouldbeshared. Themorefactoranalysisispromisingforyouroutcomes,the lowertheproportion.KMOgivesbackavaluebetween0and 1.Anumberthatiscloseto1ispreferable,andaminimum of0.5issuggestedtoensurethatthefindingsareadequate. The sample size is sufficient since we get a KMO value of 0.474 for the Upper Authority, which supports our conclusion.Numerousfactorsareinvolved,oneofwhichis thesizeofthedatacollection,whichmustbemuchbigger than60.
Table1:Elementsofthemunicipalgasdistributionsystem
An additional result of factor analysis software is communality. According to Table 3, the populations show how much variance is adjusted for each characteristic. All componentsorvariablesaccountfortheinitialcommunities, whichareestimatesofthevarianceforeachcharacteristic. Estimatesofthevariationthateachvariable'scomponents account for are called extraction communities. Since each variable accounts for an equal portion of the data set, principlecomponentevaluationstartswiththeassumption thatallvarianceisnormal.Asaresult,populationsforeach variableare1000.Thecommonvarianceinthedatamodelis represented by the anomalies in the extraction table. Therefore, it is reasonable to estimate that 82% of the volatility connected to petrol is the highest. Commonality
International Research Journal of Engineering and Technology (IRJET) e-ISSN: 2395-0056
Volume: 11 Issue: 04 | Apr 2024 www.irjet.net p-ISSN: 2395-0072
will be 0.6 on average. Strong similarities across this list indicate that the extracted components provide a good definitionforthevariables.
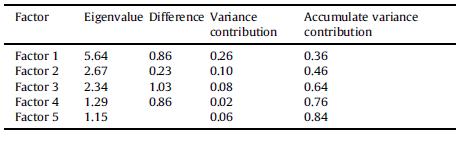
4.2. Factor selection
Table3liststhefactoreigenvalueandvariancecontribution ofthe model.Theeigenvaluesofthefivecomponents are 5.64, 2.67, 2.34, 1.29, and 1.15, respectively, as shown in Table 3. Every one of them is more than one. The five components' respective variance contributions are 0.26, 0.10,0.08,0.02,and0.06.Thefivevariablestogetherhavea cumulativevariancecontributionof0.52.Itissufficientto usethesefivecomponentstorepresenteveryvariable.
Table4presentsfactorloadingFollowingmatrixrotation
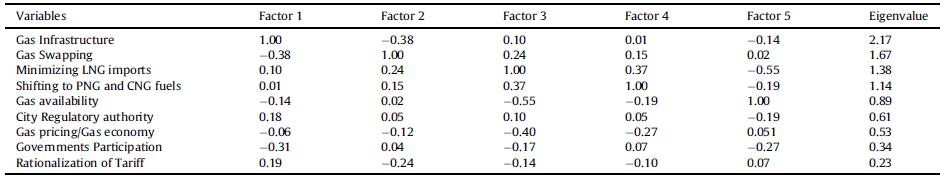
Table5:Factorsandtheirsignificancetest.
4.3. Factor loading
Theloadingofcomponentsaftermatrixrotationisshownin Table 4. Table 4's high absolute value of factor loading suggests that the variances of the variables and factors overlap.Thedifferencebetweenthevariableandthefactor in the direction of the transition is represented by the positive or negative value sign. Major loadings for gas infrastructure,areductioninLNGimports,aswitchtoPNG and CNG fuels, city regulatory authority, and a rationalisationtariffareallincludedinfactor1.Factor1,or theinfrastructurefactor,isdesignatedinaccordancewith the principle of naming based on maximum load. Government engagement, price and economy of gas, availabilityofgas,andgasexchangingaretherelativelylow loadingvariablesintheinfrastructurefactors.Gasswapping, reducingLNGimports,switchingtoPNGandCNGfuels,gas availability, local regulatory power, and government involvement are the factors in Factor 2 with the largest loadings. The policy component is identified as factor number two. Gas infrastructure, price and economy, and tariff rationalisation are the minimal loading factors. Gas infrastructure, gas swapping, reducing LNG imports, switching to PNG and CNG fuels, municipal regulatory authority,andgovernmentinvolvementarethemainloading factors for Factor 4. Factor 4 is referred to as the gas consumption factor based on this. Gas supply,
pricing/economicsofgas,andtariffrationalisationarethe elements with relatively low loading. The main loading factorsforFactor5arethefollowing:rationalisationtariff, gaspricing/economics,gasavailability,andgasswitching. Thus, the economy might be considered Factor 5. Gas infrastructure,reducingLNGimports,switchingtoPNGand CNGfuels,municipalregulatoryauthority,andgovernment involvementaretheleastloadingvariablesinthisclass.
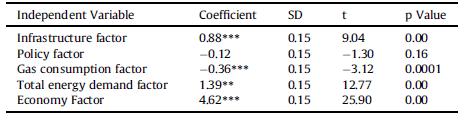
4.4. Determine the variables' relevance
ThesignificancetestresultsareshowninTable5,where"t" standsforthet-statisticsand"p"fortheprobabilityofthe statistical summary value. It is legitimate to take into accountthenullhypothesis,whichwouldbeequivalenttoor moresignificantthantheobserveddata.Theremainderof thetests,withtheexceptionofthepolicyfactor,failthenull hypothesis based on the "p" value findings. They have a noticeable impact on the city gas distribution industry, whereas the infrastructure and policy factors have the oppositeeffects.Asthesystemimproves,theinfrastructure variablegivestheinfrastructureelementgreaterweight.The city gas distribution market is therefore most affected by improvementsordisruptionsintheinfrastructurevariable, asshownbythevalueof0.88.Dependingonthevariables andthepolicyfactor'scoefficient,achangeinpolicywould haveaneffectontheCGDmarket.Thevalueofpis0.16,and theinfrastructurecomponentandtheCGDsector'svolatility are distinct.It is often not possible to reject the null hypothesisata10%connotationlevel.Theconsumptionof coal and oil is a component of the overall energy demand variable.Italsoshowstheamount ofpetrol importedand carbon dioxide emitted. The CGD market is expected to develop owing to a rise in total energy consumption, as shownbythecoefficientof1.39
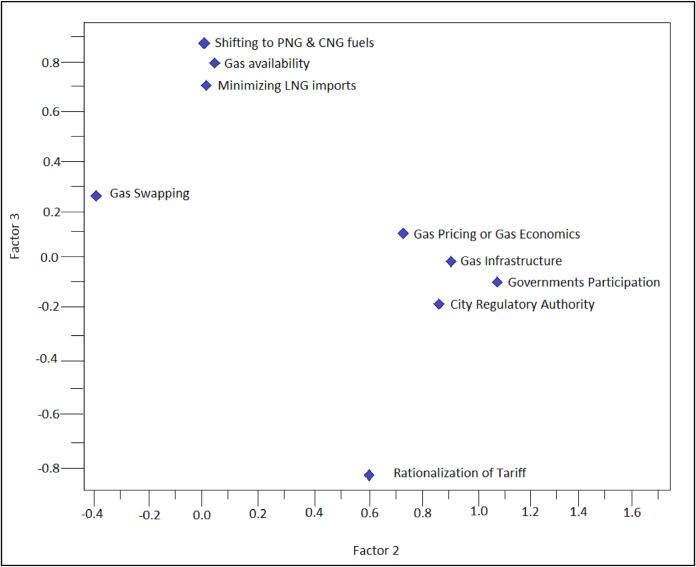
Figure14.representsoneoftheninevariablesutilisedin theresearch.Factorloadingmatrixandvariablesanalysis offactor2(x-axis)vs.factor3(y-axis).
International Research Journal of Engineering and Technology (IRJET) e-ISSN: 2395-0056
Volume: 11 Issue: 04 | Apr 2024 www.irjet.net p-ISSN: 2395-0072
Figs. 12 show the analytical result for the factor loading matrixandparameters.Therelationshipbetweenavariable andafactorretrievedfromthedataiscalledaloadingfactor. The analysis of the factor loading matrix reveals the relationshipbetweenafactorandavariableobtainedusing theorthogonalrotationapproach.Figure12showstheprice and economics of gas, municipal regulations, and gas infrastructure.Governmentalactionandauthorityaremore independent of the other factors. There may be a close relationship between the city's regulatory power, the availability, cost, and economy of petrol. These are all the essential indices used to determine the efficiency and developmentoftheCGDnetwork.
The factors influencing the CGD sector are assessed and understoodinthisresearchviatheuseofthefactoranalysis approach.ThepollwasposedtoCGDentities.Threecategory questionshaveservedasthefoundationfortheexploratory factor analysis survey. The three groups are site workers, technicallevel,andmanagementlevel.Nineelementshave been found to impact the CGD sector and call for some alteration in order to advance. Five factors the infrastructure factor, the policy factor, the petrol consumptionfactor,theoverallenergydemandfactor,and the economy component are used from these nine variablesforthisstudy.Atestforfactorsignificanceisrun oncethefactorshavebeenchosenandloaded.Theresultsof the factor significance test show that the economy, infrastructure, policy, petrol consumption, and overall energydemandhavecoefficientvaluesof0.88,_0.12,_0.36, 1.39, and 4.62, respectively. These findings suggest that factors other than policy and petrol use that have the greatestimpactontheCGDmarketincludeinfrastructure, overallenergydemand,andeconomics.Thefactorloading matrix demonstrated how more autonomous and independent the gas infrastructure, price and economics, municipalregulatorypower,andgovernmentinterference arefromtheotherelements.
[1] Dudley, B., 2018. BP Statistical Review of World Energy,67thEdition.BPEnergy Outlook,British Petroleum.
[2] Dudley,B.,2019.ADual Challenge butNota Dual Commitment. BP Energy Outlook 2019 Edition. BritishPetroleum.
[3] Ghatikar,G.,Mashayekh,S.,Stadler,M.,Yin,R.,Liu, Z., 2016. Distributed energy systems integration and demand optimization for autonomous operations and electric grid transactions. Appl. Energy167,432e448.
[4] Guo, Z., Ma, L.W., Liu, P., Jones, I., Li, Z., 2016. A multi-regional modelling and optimization approach to China's power generation and transmissionplanning.Energy116,1348e1359.
[5] Guo, Z., Cheng, R., Xu, Z.F., Liu, P., Wang, Z., Li, Z., 2017.Amulti-regionloaddispatchmodelforthe long-termoptimumplanningofChina'selectricity sector.Appl.Energy185,556e572.
[6] Han,J.H.,Lee,I.B.,2011.Developmentofascalable infrastructure model for planning electricity generation and CO2 mitigation strategies under mandatedreductionofGHGemission.Appl.Energy 88(12),5056e5068.
[7] Jalil-Vega,F.,Hawkes,A.D.,2018.Spatiallyresolved modelforstudyingdecarbonisationpathwaysfor heat supply and infrastructure trade-offs. Appl. Energy210,1051e1072.
[8] Kaiser,H.,1958.Thevarimaxcriterionforanalytic rotationinfactoranalysis.Psychometrika23(3), 187e200.
[9] Li,H.,Zhang,H.M.,Xie,Y.T.,Wang,D.,2017.Analysis of factors influencing the Henry Hub natural gas price based on factor analysis. Petrol. Sci. 14, 822e830.
[10] Matsunaga,M.,2010.Howtofactor-analyzeyour dataright:do's,don’ts,andhowto’s.Int.J.Psychol. Res.3(1),97e110.