
International Research Journal of Engineering and Technology (IRJET) e-ISSN:2395-0056
Volume: 11 Issue: 04 | Apr 2024 www.irjet.net p-ISSN:2395-0072
International Research Journal of Engineering and Technology (IRJET) e-ISSN:2395-0056
Volume: 11 Issue: 04 | Apr 2024 www.irjet.net p-ISSN:2395-0072
Akansha Shukla1 , Rakesh Kumar2
1PG Student, Dept. Of Computer Science Engineering, Madan Mohan Malviya University of Technology, Uttar Pradesh, India
2Professor, Dept. Of Computer Science Engineering, Madan Mohan Malviya University of Technology, Uttar Pradesh, India
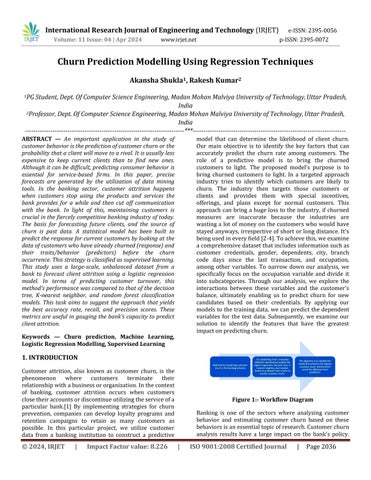
ABSTRACT An important application in the study of customer behavior is the prediction of customer churn or the probability that a client will move to a rival. It is usually less expensive to keep current clients than to find new ones. Although it can be difficult, predicting consumer behavior is essential for service-based firms. In this paper, precise forecasts are generated by the utilization of data mining tools. In the banking sector, customer attrition happens when customers stop using the products and services the bank provides for a while and then cut off communication with the bank. In light of this, maintaining customers is crucial in the fiercely competitive banking industry of today. The basis for forecasting future clients, and the source of churn is past data. A statistical model has been built to predict the response for current customers by looking at the data of customers who have already churned (response) and their traits/behavior (predictors) before the churn occurrence. This strategy is classified as supervised learning. This study uses a large-scale, unbalanced dataset from a bank to forecast client attrition using a logistic regression model. In terms of predicting customer turnover, this method's performance was compared to that of the decision tree, K-nearest neighbor, and random forest classification models. This task aims to suggest the approach that yields the best accuracy rate, recall, and precision scores. These metrics are useful in gauging the bank's capacity to predict client attrition.
Keywords Churn prediction, Machine Learning, Logistic Regression Modelling, Supervised Learning
Customer attrition, also known as customer churn, is the phenomenon where customers terminate their relationshipwithabusinessororganization.Inthecontext of banking, customer attrition occurs when customers closetheiraccountsordiscontinueutilizingtheserviceofa particular bank.[1] By implementing strategies for churn prevention, companies can develop loyalty programs and retention campaigns to retain as many customers as possible. In this particular project, we utilize customer data from a banking institution to construct a predictive
model that can determine the likelihood of client churn. Our main objective is to identify the key factors that can accurately predict the churn rate among customers. The role of a predictive model is to bring the churned customers to light. The proposed model's purpose is to bring churned customers to light. In a targeted approach industry tries to identify which customers are likely to churn. The industry then targets those customers or clients and provides them with special incentives, offerings, and plans except for normal customers. This approach can bring a hugeloss tothe industry, ifchurned measures are inaccurate because the industries are wasting a lot of money on the customers who would have stayedanyways,irrespectiveof short orlongdistance.It's beingusedineveryfield[2-4].Toachievethis,weexamine acomprehensivedatasetthatincludesinformationsuchas customer credentials, gender, dependents, city, branch code days since the last transaction, and occupation, among other variables. To narrow down our analysis, we specifically focus on the occupation variable and divide it into subcategories. Through our analysis, we explore the interactions between these variables and the customer's balance, ultimately enabling us to predict churn for new candidates based on their credentials. By applying our modelstothetrainingdata, wecanpredictthedependent variables for the test data. Subsequently, we examine our solution to identify the features that have the greatest impactonpredictingchurn.
Banking is one of the sectors where analyzing customer behavior and estimating customer churn based on these behaviorsisanessentialtopicofresearch.Customerchurn analysis results have a large impact on the bank's policy.
Volume: 11 Issue: 04 | Apr 2024 www.irjet.net
Because the results of churn analysis allow banks to developnewcustomerstrategiesorimproveexistingones. In addition, banks are critical to a country's financial growth and development, so the banking sector is an essential factor in the country's and people's financial stability. Because it is not always possible to get new customers in the competitive banking market, banks' primary goal is to ensure that existing customers are retention. Because banks,likeall companiesin theservice sector,arecustomer-oriented,customerrelationshipswith banks are a priority to their long-term business achievement. Studies conducted for the banking sector of various countries have revealed that, due to the competitive and dynamic nature of the banking sector, ensuring customer satisfaction is an important policy to prevent customer churn. [5] This analysis can be utilized to develop a recommendation system based on our data, allowing us to determine the most influential factors that affect customer churn. To address these research questions, we employ various regression models to accurately predict the exact values of our dependent variable(churn).
In the banking sector, client attrition, often known as customer churn, is a major problem (Smith, 2020)[6]. It describes the circumstances in which clients leave a bank by closing their accounts, switching to a different type of financial institution, or using fewer banking services (Jones et al.,2019)[7]. For banks, this is a critical issue becauseitismoreeconomicaltokeepcurrentclientsthan to find new ones. (Brown,2018)[8]. Retaining customers reduces marketing costs and guarantees steady revenue streams.Predictingturnoverinthebankingindustryisnot without its difficulties, though. First off, inconsistent datasets result from the fact that churn events are rather rareinthetotalcustomerbase(Gupta&Kumar,2017)[9]. Moreover, churn prediction attempts get more complex duetothe wealth ofconsumer data, whichincludestraits, transaction history, demographics, and behavior (Lee & Lee, 2020) [10]. Furthermore, if customer behavior changes, models must also adjust to temporal dynamics (Wangetal.2019)[11].Toaddresstheseissues,banksuse supervisedlearning.Tofindtrendsandpredictionsentails examininghistoricaldatafromclientswhohavepreviously churned(Li&Zhang,2018)[12].Thesepredictorscovera range of consumer traits, actions, and bank interactions before the churn event (Chen et al., 2016).[13]. Based on thispastdata,statisticalmodelsarethencreatedtopredict the chance of churn for current clients (Kim et al., 2021)[14]. When it comes to statistical models, logistic regressionisfrequentlyusedforbinaryclassificationtasks suchaschurnprediction(Rahmanetal.,2017)[15].Based
p-ISSN:2395-0072
oninputfeaturesincludingtransactionfrequency,account balance, and client tenure, logistic regression calculates thelikelihoodofchurn(Wu&Chen,2020).[16].Usingpast datatodeterminethecorrelationbetweentheseindicators andtheriskofchurn,logisticregressionhelpsbanksmake more accurate predictions. The assessment of churn prediction models generally centers on measures like precision, recall, and accuracy. Recall gauges the capacity to recognize real churn cases, whereas accuracy indicates howaccuratepredictionsareoverall.AccordingtoPark et al. (2019)[17], precision measures the percentage of accurately anticipated churn cases among all predicted churn instances. For banks, accurate churn prediction has significant business ramifications. Identifying at-risk clients and putting preventive measures in place to keep them, permits proactive action (Zhang et al., 2018)[18]. Bankscanalsocustomizeretentionstrategiesbyproviding valuable clients with discounts or personalized incentives (Huang et al., 2020)[19]. In the end, knowing what causes churnenablesbankstobetterhandleclientcomplaintsand raise the caliber of their services, which enhances the client experience asa whole (Kumar &Ravi, 2019).[20].In the banking sector, predicting client attrition entails utilizinghistoricaldata,applyingstatisticalmodelssuchas logistic regression, and assessing models with relevant metrics. Banks can maintain a competitive edge in the market by implementing focused retention tactics and improving customer happiness through accurate churn prediction. In the telecom sector, customer churn the phenomenon wherein consumers move between service providers or stop using particular services poses a serious problem (Brown, 2018)[8]. For telecom businesses, this presents threats to revenue, cost issues, andcompetitivepressures(Jonesetal.,2019)[7].Telecom companies use revenue-generating techniques such as upsellingcurrentclients,findingnewones,andimproving retention to combat these problems (Huang et al., 2020).[19].
According to the research, keeping existing clients is the most profitable strategy because it is both affordable and simple to execute (Kumar & Ravi, 2019)[20]. Telecom businesses rely on churn prediction models created with machinelearningapproachesforefficientretention(Wu& Chen, 2020)[16]. These models employ procedures including feature engineering, model selection, and performance evaluation using metrics like Area Under Curve (AUC) to uncover churn-related aspects by analyzing historical data (Park et al., 2019)[17]. By utilizing client social network information, cutting-edge techniques like Social Network Analysis (SNA) improve predictiveaccuracy(Kimetal.,2021).[14].Acasestudyon Syria Tel Telecom provides examples of how to apply churn prediction models. Investigated several methods,
International Research Journal of Engineering and Technology (IRJET) e-ISSN:2395-0056
Volume: 11 Issue: 04 | Apr 2024 www.irjet.net
including Decision Trees, Random Forests, Gradient Boosted Machine Trees (GBM), and Extreme Gradient Boosting(XGBOOST)LiandZhang(2018)[12].
The best churn prediction tool was XGBOOST, demonstrating its ability to handle telecom churn issues (Gupta&Kumar,2017)[9].
This section gives a thorough introduction to the topic of churn management in the banking industry, outlining its importance,difficulties,andthecurrentstateofpredictive analytics techniques, which include both conventional machinelearninganddeeplearningmethods
In the banking industry, churn management describes the tactics used by financial institutions to lessen the number of clients who leave one bank and open an account with another. Several things might cause this phenomenon, including reaching particular financial objectives, becoming dissatisfied with services, or experiencing changes in one's circumstances. Banks must identify early indicators of customer attrition, including decreased transactionvolumesorinactiveaccounts,totakeproactive actionstoretainlong-termrelationshipswiththeirclients.
In the past, banks have predicted client attrition by analyzingcustomerdatausingstatisticaltechniques.
These techniques include support vector machines (SVM), self-organizing maps (SOM), multilayer perceptrons (MLP), and classification and regression trees (CART). These methods examine past transaction data to spot trends that could point to possible churn and provide guidanceforfocusedretentiontactics.
Since the emergence of big data and the development of processing power, deep learning techniques have become morepopularinthebankingindustryforchurnprediction. Advanced neural networks, such as convolutional neural networks (CNNs) and recurrent neural networks (RNNs), have demonstrated their ability to extract intricate patterns from a variety of data sources, such as text and time-series transaction data. The innate hierarchical structure of data is utilized by deep learning models to automatically discover pertinent information, improving theaccuracyofchurnprediction.
p-ISSN:2395-0072
Deep learning techniques are effective, but there is still a lackofempiricaldataonthebestwaytopickandfine-tune hyperparameters for churn prediction. While deep learningmodelsneedcarefulparameterselectiontoattain maximum performance, traditional machine learning techniques offer well-established frameworks for model optimization. To close this gap, future studies will offer heuristic recommendations for choosing deep neural network(DNN)modelhyperparametersthatareespecially suitedforbankingchurnmodeling.
Churn prediction in the telecom industry Inthetelecom sector, churn prediction refers to predicting which consumers are most likely to switch service providers. To tackle this difficulty, researchers have used a variety of machine-learning techniques and algorithms. Here's an overviewofrelevantstudiesbywell-knownscientists:
Abdel Rahim et al. [21]: For churn prediction, they used tree-basedalgorithmssuchasXGBoost,GBMtree method, random forests, and decision trees. XGBoost had better accuracy in terms of AUC. They recommended optimizing featureselectiontoachieveevengreaterimprovement.
To forecast churn, Praveen et al. [22] performed a comparativestudyofmachinelearningmethods,including support vector machines, decision trees, naive Bayes, and logistic regression. SVM-POLY with Ada Boost performed better than the rest. Using feature selection procedures wasadvisedtoimproveaccuracy.
Beleiuetal.[23]usedPCAforfeaturereductionalongwith neural networks, support vector machines, and Bayesian networks for churn prediction. To increase classification accuracy,theysuggestedemployingoptimizationmethods toenhancefeatureselection.
Burez et al. [24]: Used resampling approaches in conjunction with logistic regression and random forest to addressclassimbalance.Additionally,optimizingmethods were applied. Although they investigated sophisticated samplingmethods,theyrecommendedoptimization-based sampling as a more effective way to address the issue of classimbalance.
To predict turnover, K Coussement et al. [25] compared theuseofrandomforests,logisticregression,andsupport vector machines. When ideal parameters were taken into account,SVMperformedbetterthanLRandRF.
K. Dahiya et al. [26]: Used the WEKA tool to experiment withlogisticregressionanddecisiontrees.
© 2024, IRJET | Impact Factor value: 8.226 | ISO 9001:2008
| Page2038
International Research Journal of Engineering and Technology (IRJET) e-ISSN:2395-0056
Volume: 11 Issue: 04 | Apr 2024 www.irjet.net
They suggested looking at more machine-learning strategiestoincreaseproductivity.
Umman et al. [27]: Used decision tree and logistic regression models to analyze a large database, although the results showed poor accuracy. For improvement, they recommended implementing more machine-learning strategiesandfeatureselectionapproaches.
A comparison of neural networks, regression trees, and regressionforchurnpredictionwascarriedoutbyHadden et al. [28]. Because of their rule-based design, decision treesexhibitedoptimalperformance.Theyadvisedmaking use of the current feature selection methods to increase accuracyevenfurther.
A thorough analysis of machine learning models and currentfeatureselectionmethodswasgivenbyHaddenet al. [28]. They concluded that decision trees were better and stressed the significance of optimization strategies in featureselectionformoreaccurateprediction.
Huang et al. [19]: Used a variety of classifiers, demonstrating the superiority of random forest in AUC and PR-AUC analyses. They recommended enhancing featureextractiontoincreaseaccuracyevenmore.
Idris et al. [29]: Achieved greater accuracy by combining Ada Boost and genetic programming. More optimization methodsweresuggestedbythemtoimproveperformance.
Kisioglu et al. [30]: Suggested the efficacy of using Bayesian belief networks for churn prediction. They also indicatedregionsthatneededmoreinvestigation.
Churn control is still a vital component of customer relationship management in the telecom and banking sectors. By utilizing predictive analytics techniques, such as deep learning and classical machine learning methodologies,banksandthetelecomsectormayforecast client attrition and take proactive retention efforts. As the area develops, optimizing deep learning models' hyperparametersoffersa viableway to raise the accuracy of churn prediction and provide information for strategic decision-makinginthebankingandtelecomsectors.
4.1 Dataset
This section provides a comprehensive overview of the dataset utilized, as well as the various analyses and summaries performed, to gain a better understanding of the distinct parameters that contribute to the prediction modeling. The dataset contains information for creating
p-ISSN:2395-0072
our model. The data file 'churn_prediction’ contains 21 featuresabout28382clientsofthebank. The features or variables arethefollowing:
Variables
Description
customer_id Unusedvariable
Vintage Usedasinput
Age Usedasinput
Gender Usedasinput
Dependents Usedasinput
Occupation Usedasinput
City Usedasinput
Customer_nw_category Usedasinput
branch_code Usedasinput
days_since_last_transaction Usedasinput
current_balance Usedasinput
previous_month_end_balance Usedasinput
average_monthly_balance_prevQ Usedasinput average_monthly_balance_prevQ2 Usedasinput
current_month_credit Usedasinput
previous_month_credit Usedasinput
current_month_debit Usedasinput
previous_month_debit Usedasinput
current_month_balance Usedasinput
previous_month_balance Usedasinput
Churn Usedasthetarget
previous_month_balance Usedasinput
Churn Usedasthetarget
Table 1: Table of Features
Thissectionisthecorepartofunderstandingtheproblem and channel late to the right features, as said before we need to establish possible relations in our attributes and this is where to strongest part of trading off comes in to securethebestpredictions:-
International Research Journal of Engineering and Technology (IRJET) e-ISSN:2395-0056
Volume: 11 Issue: 04 | Apr 2024 www.irjet.net
Churnwillalwaysplaytheroleofatarget
Once the variables and instances are configured, we can performsomeanalyticsonthedata.
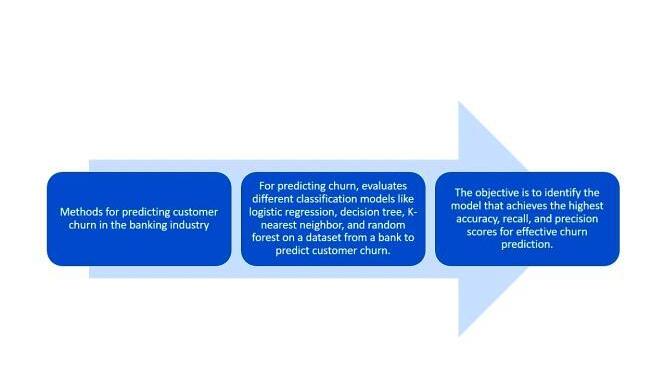
Thedatadistributionstellusthepercentagesofchurnand loyalcustomers.
Herechurnisissuedasthetargetlifttheclienthasleftthe bankduringsomeperiodor0ifhe/shehasnot.
18.5% Churned, 81.5% NOT Churned
Thisisalossoveracertaintimeyetthereisnoclearfactor for churning maybe it is the nature of the business better be alert, but also it gives hope because the business now hasthepowertoimproveitselfgradually.
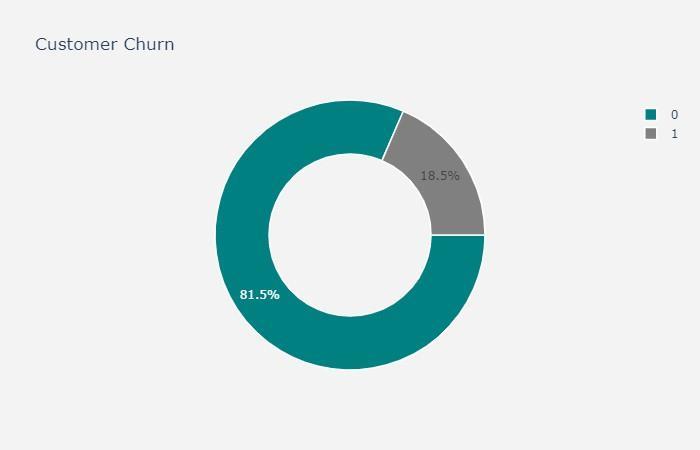
After thoroughly investigating all the variables present in our dataset, we are now able to address the issue of missingvalues,asthesemissingdatapointscannegatively impact the performance of our model. It is possible to identify these missing values using the ".isnull()" function in the panda's library, for instance. Once these null values areidentified,theappropriatecourseofactiondependson the specific case at hand. It may be suitable to fill these missing values with a single value, such as the mean, median, or mode. Alternatively, if there is a sufficient amount of training data available, it may be more appropriatetocompletelyremovetheentrycontainingthe missing value. It is worth noting that there are missing values present in the following variables: gender, dependents, occupation, city, and days_since_last_transaction. We will treat the missing valuesinallthefeaturesonebyone.
p-ISSN:2395-0072
We can consider these methods to fill in the missing values:
For numerical variables: imputation using meanormedian
For categorical variables: imputation using themode
Beforeemployingalinearmodellikelogisticregression,it is necessary to standardize the data and ensure that all attributes are strictly numeric. Standardizing Numerical Attributes for Logistic Regression. It is worth noting that thedataset containsnumerous outliers,particularlyabout he previous and current balance attributes. Additionally,
Standard scaling, in any case, is a requisite when dealing withlinearmodels,andinthis case,wehave performedit after conducting a log transformation on all balance features.
Weaimtoincorporatecharacteristicsthatareexpectedto influence the likelihood of customer churn. Initially, we divide the data into separate training and testing sets.
Volume: 11 Issue: 04 | Apr 2024
Subsequently, we generate novel features based on the existingattributesandtheirrelationships.Additionally ensure that the existing attributes are appropriately prepared for predicting potential churn in our future clients. This process typically involves standardizing the attributesandaligningthemaccordingly.
A one-hot encoding can be considered a representation of categorical variables in the form of binary vectors.Inaimingto achievethis, itis necessary to assign integer values to the categorical values. Subsequently, every integer value is transformed into a binary vector, where all values are zero except for the index of the corresponding integer, which is represented as a 1. To perform calculations, it is imperative to convert string values into numeric values. For instance, in the Churndataset,the"occupation"variablecanbeaddressed as a simple example. By utilizing the Pandas function "get_dummies()", the occupation column can be replaced with four columns: 'occupation_retired', 'occupation_salaried', 'occupation_self_employed', and 'occupation_student'.
5.4
Firstly, it is imperative to train our model. Secondly, it is crucial to test our model. Consequently, it is advisable to possess two distinct datasets. Given the current circumstances, we solely possess one dataset, hence it is customarytodividethedataaccordingly.Xrepresentsthe data encompassing the independent variables, while Y denotes the data comprising the dependent variable. The test size variable determines the proportion in which the datawillbedivided.
Logistic Regression is a machine learning algorithm commonly used to solve binary classification problems. It estimates the probability of an event by examining the relationship between a dependent variable and one or more independent variables. Specially, logisticsregressions topredictthelikelihoodofan instancebelongingtoacertaincategory.
6.1
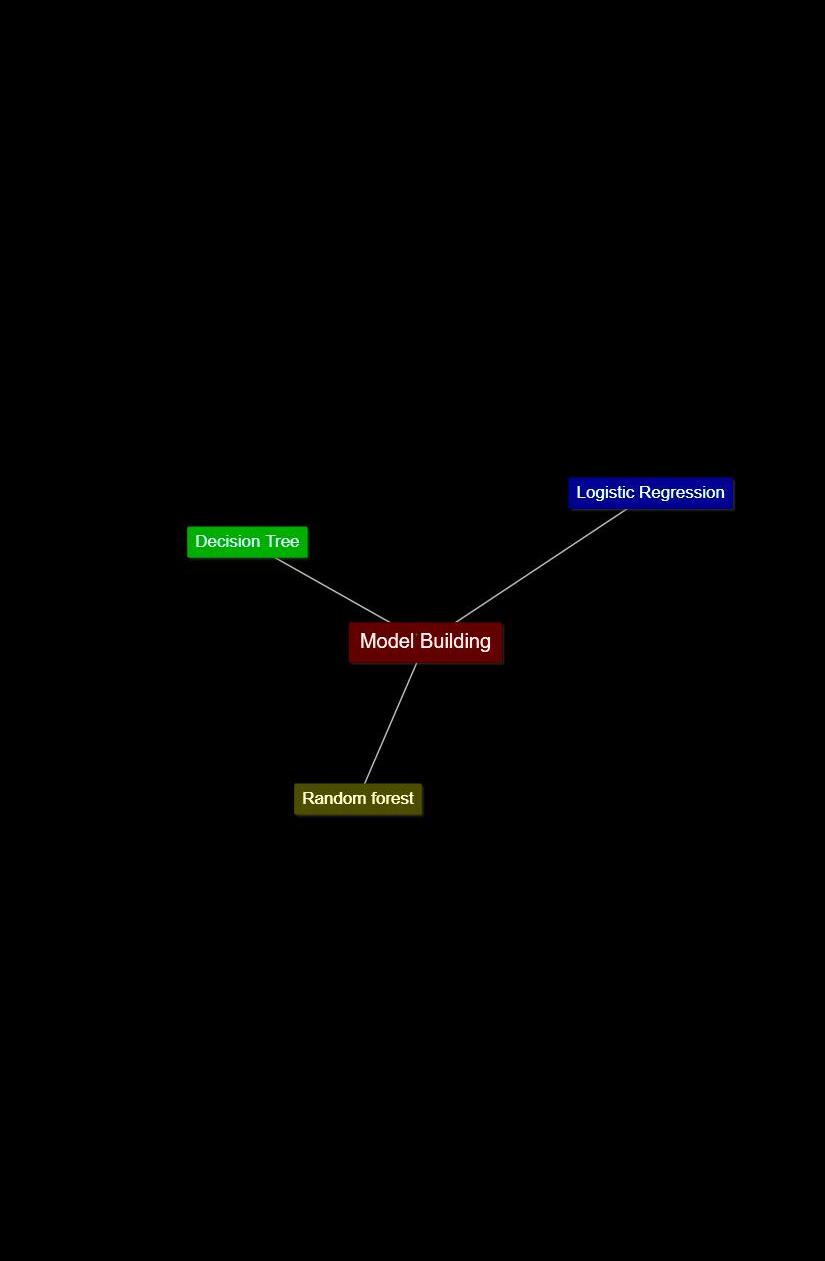
Thistaskisabinarycasestudyandevidently,itfallsunder the purview of a supervised classification learning problemasitnecessitatestheclassificationofwhetherthe Churn is affirmative or negative. Typically, data scientists employtheperformanceofabaselinemodelasametricto juxtapose the predictive accuracy of more intricate algorithms.
A Decision Tree is a form of supervised learning algorithm that possesses a predefined target variable. Although it is primarily utilized in classification tasks, it is also capable of handling numeric data. This particular algorithm divides a data sample into two or more sets that share similar characteristics, based on the most significant distinguishing factor among the input variables,tomakeaprediction.Ateachdivision,a segmentofthetreeisgenerated.Asaresult,atree composedofdecisionnodesandleafnodes,which serve as decisions or classifications, is produced. The tree commences from a root node, which is theoptimalpredictor.
A Random forest is a type of ensemble learning method that uses numerous decision trees to achieve higher prediction accuracy and model stability. This method deals with both regression andclassificationtasks.Everytreeclassifiesadata instance (or votes for its class) based on attributes,andtheforestchoosestheclassification that receives the most votes. In the case of regression tasks, the average of different trees' decisionsistaken.
International Research Journal of Engineering and Technology (IRJET) e-ISSN:2395-0056
Volume: 11 Issue: 04 | Apr 2024 www.irjet.net
Let us make our model to predict the target variable. We will deal with Logistic Regression which is used for predictingbinaryoutcomes.
Fordefining model evaluationparameters, wedefinedthe followingterms-
True negative (TN) refers to the number of negative tuples that were labeled correctly by theclassifier.
False positive (FP) refers to the number of negative tuples that were incorrectly labeled as positive.
False negative (FN) refers to the number of positive tuples that were incorrectly labeled as negative.
True positive (TP) refers to the positive tuples thatwerelabeledcorrectlyaspositive.
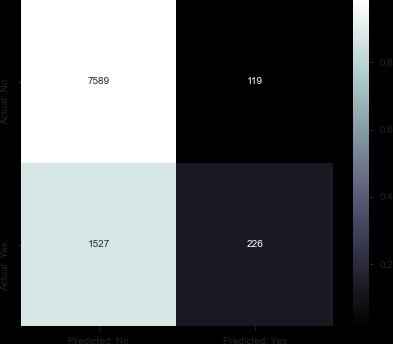
A confusion matrix includes information about actualand predicted classifications. The confusion matrix has two dimensions:one indexed by the actual class andtheother indexedbytheclasspredictedbytheclassifier.
The confusion matrix defined Accuracy as “the probability of success in recognizing the right classofaninstance.”
Italsodefined Precisionas "theprobability that a predicted positive class instance is truly positive".
ItexplainedRecallas“theprobabilityofsuccess inrecognizingapositiveclassinstance.”
It further introduced the F-measure, which is "the harmonic mean of precision and recall and tendstowardsthelowerofthetwo."
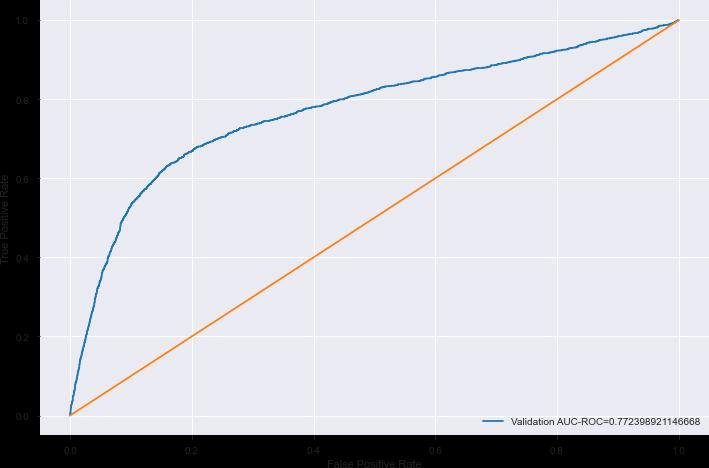
One of the useful statistical tools for describing the classifier performance is the receiver operating characteristic (ROC) curve. Furthermore, one of the most popularmeasuresforevaluatingthepowerofa predictive modelistheareaunderthecurve(AUC).
AUCisdefinedas“theintegratedtruepositiverate overall falsepositiveratevalues.”AUCtakesavaluebetween0and 1. Since this is a binary classification problem, we could usethefollowing2popularmetrics:
p-ISSN:2395-0072
Recall
TheareaundertheReceiveroperating characteristiccurve
Now, we are looking at the recall value here because a customerfalselymarkedaschurnwouldnotbeasbadasa customer who was not detected as a churning customer, and appropriate measures were not taken by the bank to stophim/herfromchurning.
TheROCAUCistheareaunderthecurvewhenplottingthe (normalized)true positive rate(x-axis) and the false positiverate(y-axis).
Our main metric here would be Recall values, while the AUC ROC Score would take care of how well-predicted probabilitiescandifferentiatebetweenthe2classes.
Fordebitvalues,weseethatthereisanassigned if I can't difference in the distribution for churn and nonchurn and it might turn out to be an importantfeature
For all the balance features the lower values have a much higher proportion of churning customers
For most frequent vintage values, the churning customers are slightly higher, while for higher values of vintage, we have mostly non-churning customerswhichisinsyncwiththeagevariable
We see significant differences for different occupations and certainly would be interesting touseitasafeatureforthepredictionofchurn.
Now, we will first split our dataset into test and train and using the above conclusions select columns and build a baseline logistic regression model to check the ROC-AUC Score&theconfusionmatrix.
International Research Journal of Engineering and Technology (IRJET) e-ISSN:2395-0056
Volume: 11 Issue: 04 | Apr 2024 www.irjet.net p-ISSN:2395-0072
Cross-validation is an exceedingly significant notion in all formsofdata modeling.The fundamental idea behindit is to reserve a subset of data for testing purposes,whilethe modelisnottrainedonthissubset.Consequently,themodel isevaluatedonthisreservedsubsetbeforebeingultimately selected.
We partition the complete population into k equivalent samples. Subsequently, we proceed to train models onk-1 samples, while reserving samples for validation. Consequently, during the subsequent iteration, we train the model using another sample for validation. After k iterations,weeffectivelyconstructamodelforeachsample and designate each sample as validation.This approach serves to mitigate selection bias and diminish the variabilityinpredictivecapability.
As multiple models are constructed using various subsets of the dataset, the utilization of CV for modelevaluation enhances the level of confidence in our model performance. When comparing different models, both the ROC AUC Scores and Precision/Recall Scores demonstrate somedegreeofimprovement.
Letusvisualizethecross-validationscoresforeachfoldfor thefollowing3modelsandobservethedifferences: BaselineModel
Model-basedonallfeatures Model-basedontop10featuresobtainedfrom RFE
Table 2:- Comparison of Different model fold wise
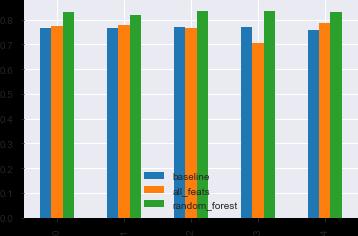
Figure 7:- Graphical Representations of Different Fold Models
Here, we can see that the random forest model is giving the best result for each fold and students are encouraged totryandfine-tunethemodeltogetthebestresults.
International Research Journal of Engineering and
Volume: 11 Issue: 04 | Apr 2024 www.irjet.net
Accuracies
Let us visualize the accuracy scores for each of the following4differentmodelingtechniquesandobservethe differences:
The final phase of the churn prediction workflow has now arrived. The chosen model/models must be implemented in a practical setting. The model may be integrated into existing software or serve as the foundation of a new program. Nevertheless, the approach of deploying the model and then neglecting it is ineffective. Data scientists mustmonitortheaccuracylevelsofthemodelandenhance itwhenevernecessary.Itishighlyadvisabletosharethese findings with the bank and adapt their strategies accordingly. Only when the bank understands where to focus its efforts can its team effectively guide customers towardfeaturesthatencourageprolongedengagement
In this investigation, wehave been working witha dataset from a financial institution, aiming to forecast customers whomaydiscontinuetheirservicesintheupcomingperiod to formulate an appropriate plan to retain them, following theidentificationofconcealedpatternsinthedataset.
The proposed approach harnesses the efficacy of operational data churn analysis, effectively identifying those customers who are most likely to cease their engagement and initiating strategies to retain them. By employing statistical algorithms for data mining, the proposed approach uncovers patterns of churn within the behavioral patterns of previous churners, utilizing this knowledge toassigna rating indicative ofthe potentialfor churntoexistingcustomers.
The investigation therefore makes predictions about attrition of banking clientele and can subsequently be expanded, thus aiding in the development of strategies for intervention based on attrition forecasts to mitigate the
loss of revenue by increasing customer retention. It is anticipated that, by gaining a better comprehension of these characteristics, bank managers can create a tailored approach to customer retention activities within the framework of their efforts in Customer Relationship Management.
The model's accuracy in predicting churned customers is slightly higher when it comes to forecasting those who do churn. Nonetheless, while the model exhibits high precision,itstillfailstoidentifyapproximatelyhalfofthose individualswhoultimatelychurn.
This could be enhanced by retraining the model with additional data over time while concurrently utilizing the model to retain the customers who would have otherwise churned.
Theapplicationofdataminingtechniquesintheelectronic banking domain to predict customer churn is a recent development. In the present research, a significant aspect involvesthecollectionofdataandtheselectionofrelevant features to effectively predict customer churn in the contextofelectronicbankingservices.Itisanticipatedthat by gaining a better understanding of the characteristics of customerswhoexhibitchurnbehavior,bankmanagerscan employ various strategies to mitigate churn. These strategies should be implemented for customers whose characteristics are becoming increasingly similar to the groups of churners identified earlier. The strategies may include providing necessary amenities, enhancing the qualityofservices,identifyingtherequirementsofdifferent customer segments, and enhancing customer responsiveness.
The present study encountered certain limitations stemming from the utilization of the bank's database. A prime illustration of this is the restriction to solely examining factors that had been documented within the bank'sdatabase.Furthermore,theextractionofallthedata was a time-consuming task due to the substantial volume of information stored in the database and the accompanyingprivacyconcerns.
Subsequent research endeavors will delve deeper into the outcomes of the implementation and will utilize diverse methodologies to ascertain customer requirements, while also proposing potential measures to mitigate customer churn. To unravel the underlying causes of churn within the churner groups, our approach will encompass qualitativeresearch
International Research Journal of Engineering and Technology (IRJET) e-ISSN:2395-0056
Volume: 11 Issue: 04 | Apr 2024 www.irjet.net p-ISSN:2395-0072
1. Rahul Preet Singh, Fahim Islam Anik, Rahul Senpati, Arnav Sinha, Nazmus Sakib, Eklas Hossain ,etal(2023)
2. UllahI,RazaB,MalikAK,ImranM,IslamSU,Kim SW. A churn prediction model using random forest: analysis of machine learning techniques for churn prediction and factor identification in the telecom sector. IEEE Access 2019;7:60134–49.
https://doi.org/10.1109/ACCESS.2019.2914999
3. Ahmed AAQ, Maheswari D. Churn prediction on huge telecom data using hybrid firefly-based classification. Egypt Inform J 2017;18(3):215–20.https://doi.org/10.1016/j.eij.2017.02.002.
4. E V, Ravikumar P, S C, M SK. An efficient technique for feature selection to predict customer churn in the telecom industry. In: Proceedings of the 1st International Conference onAdvancesinInformationTechnology(ICAIT); 2019. p. 174–9. https://doi.org/10.1109/ICAIT47043.2019.898 7317
5. Brown, A. (2018). Telecom Customer Churn: UnderstandingItandAvoidingIt.Forbes.
6. Ruholla Jafari-Marandi, Denton, Idris, Smith, Keramati (2020) Optimum profit-driven churn decision making: innovative artificial neural networksinthetelecomindustry.
7. Jones, T., et al. (2019). Understanding Customer Churn in the Telecommunications Industry.
Journal of Strategic Marketing,27(1),76-92.
8. Brown, A. (2018). Retaining Existing Banking Customers: Strategies for Success. Banking Strategies.
9. Gupta, M., & Kumar, N. (2017). Churn Prediction in Banking Sector: A Review. InternationalJournal of Computer Applications, 171(10),40-45.
10.Lee, H., & Lee, S. (2020). Machine Learning Approaches for Customer Churn Prediction in Banking.ExpertSystemswithApplications,157, 1-12.
11.Qiu-FengWang,Xu,andHussain(2019):LargeScale ensemble model for customer churn predictioninsearchads.
12.Li,H.,&Zhang,L.(2018). ACaseStudyonChurn Prediction Models in the Telecom Industry: Insights from SyriaTel Telecom. International Journal of Communication Systems, 31(11), e3565.
13.Chen, S., et al. (2016). Predicting Customer Churn in the Banking Industry Using Machine Learning Techniques. Journal of Banking & Finance,72,1-12.
14.Kim, D., et al. (2021). Social Network Analysis in Customer Churn Prediction: A Case Study inthe TelecomIndustry. Information Systems Frontiers, 1-17.
15.Rahman, M., et al. (2017). Predictive Analytics for Churn Prediction in Banking: A Logistic RegressionApproach.*InternationalJournal
16.Wu, Y., & Chen, S. (2020). Predicting Customer Churn in the Telecom Industry Using Machine LearningModels. IEEE Access,8,57291-57302
17.Park, J., et al. (2019). Evaluating Churn Prediction Models in Banking: A Comparative Analysis. Journal of Retail Banking Services, 41(4),1-14
18.Li, H., & Zhang, L. (2018). Churn Prediction Models in Banking: A Case Study of XYZ Bank. International Journal of Information Management,
19.Huang, S., et al. (2020). Enhancing Customer Retention Strategies in the Banking Sector: A Machine Learning Approach. Journal of Banking &Finance.
20.Kumar,P.,&Ravi,V.(2019). Churn Predictionin Telecom Using Machine Learning in Big Data Platform. International Journal of Advanced ResearchinComputerScience
21.Abdelrahim et al.: Utilized tree-based algorithms including decision trees, random forests, GBM tree algorithm, and XGBoost for churn prediction. XGBoost showed superior performance in terms of AUC accuracy. They suggested further improvement by optimizing featureselection
International Research Journal of Engineering and Technology (IRJET) e-ISSN:2395-0056
Volume: 11 Issue: 04 | Apr 2024 www.irjet.net
22.Praveenetal.:Conducteda comparativeanalysis of machine learning models such as support vector machine, decision tree, naive Bayes, and logistic regression for churn prediction. SVMPOLYwithAdaBoostoutperformedothers.
23.Horia Beleiu et al.: Employed neural networks, support vector machines, and Bayesian networks for churn prediction, with PCA for featurereduction.
24.J. Burez et al.: Addressed class imbalance by applying logistic regression and random forest with re-sampling techniques. Boosting algorithmswerealsoutilized.
25.K Coussement et al.: Compared support vector machine, logistic regression, and random forest forchurnprediction. SVMoutperformedLR and RFwhenoptimalparameterswereconsidered.
26.K. Dahiya et al.: Experimented with decision trees and logistic regression using the WEKA tool. They recommended exploring other machine-learning techniques for improved efficiency.
27.Ummanetal.:Analyzedamassivedatabaseusing logistic regression and decision tree models but encounteredlowaccuracy.
28.J. Hadden et al.: Conducted a comparative study of neural networks, regression trees, and regressionforchurnprediction.
29..Idris et al.: Combined genetic programming and AdaBoost,achievingsuperioraccuracy.
30.P. Kisioglu et al. [23]: Employed Bayesian belief networksforchurnpredictionandsuggestedits effectiveness.
p-ISSN:2395-0072