
International Research Journal of Engineering and Technology (IRJET) e-ISSN:2395-0056
International Research Journal of Engineering and Technology (IRJET) e-ISSN:2395-0056
Shanmukha Srinivas Gorantla 1*, Prudhvitej Immadi2, Pradeep Kumar G N 1
1 Department of Civil Engineering, Sri Venkateswara University College of Engineering, Tirupati, Andhra Pradesh, India.
2 Indian Administrative Service, Government of Andhra Pradesh. ***
Abstract - The present study is to use Geographic Information System (GIS) for determining the best areas having groundwater quantity and quality in Neeva basin. Themes such as slope, rainfall, groundwater level and land use/land cover was developed in GIS. Thematic layers were weighed and groundwater potential zones map was developed through weighted overlay analysis. Results indicated that 80.26 (61.27 %), 26.07 (19.9%) and 24.67 (18.83%) sq.km. of area has good, moderate and poor groundwater potential. On the other hand, National Sanitation Foundation method was applied for evaluating water quality index in the basin at 43 observation wells and samples were tested for physico-chemical analysis for eight parameters and study revealed that 20.93%, 74.42% and 4.65% of area has good, moderate and poor quality of groundwater Based on the obtained results, some suggestions for groundwater management in general and for the basin in specific were made.
Keywords: GroundwaterPotential,GroundwaterQuality,GIS,landuse,WaterPolicy
1. Introduction
Water has been, is, and will be one of the most important resources for the survival of mankind. Most of the cities and townsarebuiltonthebanksofriversorsomewaterbodies(Ahmadet.al,2005).Waterisrequiredfordrinking,irrigation, industrial and commercial purposes. Sustainable Development Goal no 6 aims to “Ensure availability and sustainable management of water and sanitation for all” (UN Resolution). Rapid increase in population and use of natural resources are hampering our efforts to achieve this goal. A multitude of factors have caused surface water a less commonly used sourceofwater,especiallyinIndia(GEC,1997;GEC,2015).Throughoutthearidanddryregionsofthecountry,thepeople depend on the groundwater resource to meet their water requirements because groundwater is relatively purer with respecttosurfacewaterandeasiertoobtaininthesepartsofthecountry.Thismakesgroundwaterisanimportant,finite resourceandisanessentialpartofthehydrologicalcycle. Hence,itbecomesveryimperativeforeveryoneingeneraland administratorsinspecifictounderstandthehydrologicalcyclesmanagethediminishingresourceofgroundwater(Anuet. al.2012;Rehmanet.al.,2024).Itisnecessarytounderstandthedynamicsofgroundwatersothattheycouldbeproperly monitoredandmanaged. Quantificationofgroundwaterresourcesifverycriticalandnosinglecomprehensivetechnique notyetidentifiedforestimatingaccurategroundwaterassessment(Sutradharet.al.,2022).Themainreasonbehindthisis that accurate estimation needs a multidisciplinary approach to the problem. Various physical, geological, morphological andhydrological properties ofthesurfacedeterminethegroundwater environment (Maitre et.al., 1999).Thefirstorder indicators such as recharge or discharge zones, moisture content of soil and vegetation are directly related to the groundwater system (Atar Singh et. al., 2024) The second order indicators are rock types, soil, structures, fractures, landforms, drainage and anthropogenic activities on surface (Magesh et. al., 2012). These are a fair number of surface indicators,whichcanprovideinformationforgroundwater(Tariqet.al.,2023;NaikandAwasthi,2003)
2.1 Study
AndhraPradeshisapredominantlyagrarianstatelocatedintheEasterncoastofthecountry.Threemajorriversnamely Godavari,KrishnaandPennarrunacrossthestate.Amajorpartoftheareaisunderlinedbygneissiccomplex,sedimentary andalluvialformations.Thealluvialformationsareconfinedmainlyinthedeltaregionwherethetubewellsyieldfrom1560cu.m./hr.Rainfallinthestatevariesfrom561mmin RayalaseemaRegiontoabout1113mminthenorth-easternpart of the state. This study was carried out in Neeva River, Chittoor District which lies in between 12037’ - 14000’ North longitudes and 78003’ - 79055’ East latitudes with an aerial extent of 15151-sq.km. The district is having population of 41.74 lakhs (Census, 2011) of which urban population is 12.31 lakhs and rural population is 29.43 lakhs. Neeva River is oneofthemajortributariesofthePonnaiRiverthatflowsthroughthedistrict.ItstartsnearBhumireddipallevillageand
Volume: 11 Issue: 04 | Apr 2024 www.irjet.net p-ISSN:2395-0072 © 2024, IRJET | Impact Factor value: 8.226 | ISO 9001:2008 Certified Journal | Page1675
International Research Journal of Engineering and Technology (IRJET) e-ISSN:2395-0056
Volume: 11 Issue: 04 | Apr 2024 www.irjet.net p-ISSN:2395-0072
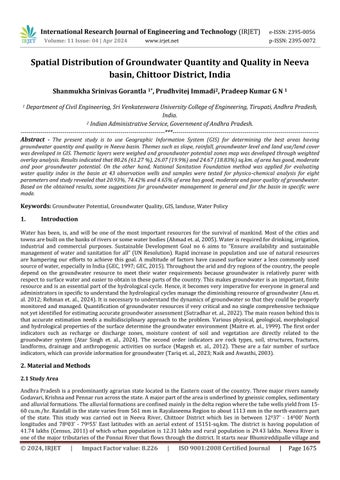
flows and carried a length of 16.3km around Chittoor town and joins Ponnai River at the junction of Mukundrajanipeta villageand Kotturuvillage. Neeva Riveristhelife-lineofthedistrict headquarters, Chittoortownwith catchmentarea of 131sq.km(around10%oftotal1300sq.kmcatchmentofPonnairiver).Riverflowsthroughmostpartofthetownandis veryimportantforrecharginggroundwateraquifersinandaroundthetown.NeevaWatershed(Figure1)istakenasthe study area as it would also encompass the effects of built up nature in urban area, commercial and domestic usage in ChittoortownandtheagriculturalusageinthesurroundingmandalsusingGIS.
The district is (85%) underlain by Archean granites and granite gneisses mainly followed by Cuddapah formation i.e., Quartzites, Shales and Sandstones of upper Gondwana and recent alluvium in the stream courses. The district has an attitudeof300to900maboveMSLandaverageannualrainfallofthedistrictis934mm.Thedistrictisdrainedbymajor riversviz.,Cheyyeru,Papagni,Swarnamukhi,Araniyar,Palar,Koratliar,KalyaniandPonnairbesidesnumberoftributaries withdendritictosubdendriticdrainagepattern.
It experiences semiarid climate conditions with temperatures ranging from 430c in May to 200c in December. The major cropscultivatedarePaddy, Sugarcane,Pulses,Mulberry,MangoandotherHorticulturecrops.Sincethereisno perennial source of water for either irrigation or drinking water purposes, the majority of district is dependent on rainfall, minor irrigation tanks and groundwater for all purposes. Rainfall has been very erratic in the past decade five years were drought declared. This has made people to resort more to groundwater sources. The strain on groundwater aquifers mostlyinuplandareasisincreasingalarmingly.
2.2 Estimation of Groundwater Potential Zones (GWPZ)
Geospatialtechniquesprovidearapidandcosteffectivetoolforgeneratingvaluablegeo-databothdirectlyandindirectly, which is used in deciphering groundwater potential zones in hard-rock terrain (Dar et al. 2011). Evaluation of groundwater potential zonesin the study area wasdone by preparing and integrating variousthematic layers usingGIS. TheIndianRemotesensingSatellite(IRS),linearimageself-scanning(LISS)IIIdigitaldataona1:50000scale,wereused in the present study. The IRS LISS III of the area are used for the land use classifications and compared using
International Research Journal of Engineering and Technology (IRJET) e-ISSN:2395-0056
Volume: 11 Issue: 04 | Apr 2024 www.irjet.net p-ISSN:2395-0072
georeferencedopenseriesmapofSOI57O/4(1:50000scale).Rainfalldata,groundwaterleveldatawerealsocollectedto validate the results for final groundwater potential map. Thematic layers pertaining to drainage density and slope were extractedusingDigitalElevationModel (DEM)togetherwiththeSurveyofIndia(SOI)maps.Allthedatawere integrated inaGISdomainandanalyzedtoassesstheeffectofgroundwatercontrolling features.Finallygroundwaterpotentialmap wasgeneratedusingoverlaytechnique.Overlay analyseswasdoneusingspatial analystextensiontoolsofArcGIS 10.2.2, usingweightedlinearcombinationtechnique.
GWQI,amathematicaltooltoevaluateallthephysico-chemicalparametersintosingleparameter.Itisoneoftheaggregate indicesthathavebeenacceptedasa ratingthatreflects thecompositeinfluence on theoverall qualityeffectively(APHA, 2012).GWQIiscomputedasfollows.
Relativeweight(Wi)ofeachqualityparameteriscomputedusing:
where,Wiistherelativeweight,wi istheweightofeachparameterandnisthenumberofparameters.Qualityratingscale (qi)ofeachparameterisdeterminedbydividingitsconcentrationineachwatersamplebyitsrespectivestandard.Asper BureauofIndianStandards(BIS,2012),thevaluesofqi arecomputed,
qi =(Ci /Si)*100
whereqi isthequalityrating,Ci istheconcentrationofeachqualityparameterineachwatersampleinmg/landSi isthe IndianStandardfordrinkingwaterofthatqualityparameterinmg/l.Si valueforeachparameteriscomputedusing
Si =Wi *qi
Finally,GWQIforeachqualityparameteriscomputedas
GWQI=∑Si
Based on the value of GWQI, the water may be good (GWQI > 100), moderate (100 > GWQI > 200) or poor (GWQI > 200) in quality.
3.1
For sustainable development of water resources, it is imperative to make quantitative estimation of available water resources.IntegratedremotesensingandGISbasedapproachisatoolforassessinggroundwaterpotentialzonesbasedon whichsuitablelocationsforgroundwaterwithdrawalsarelocatedeasily.
3.1.1
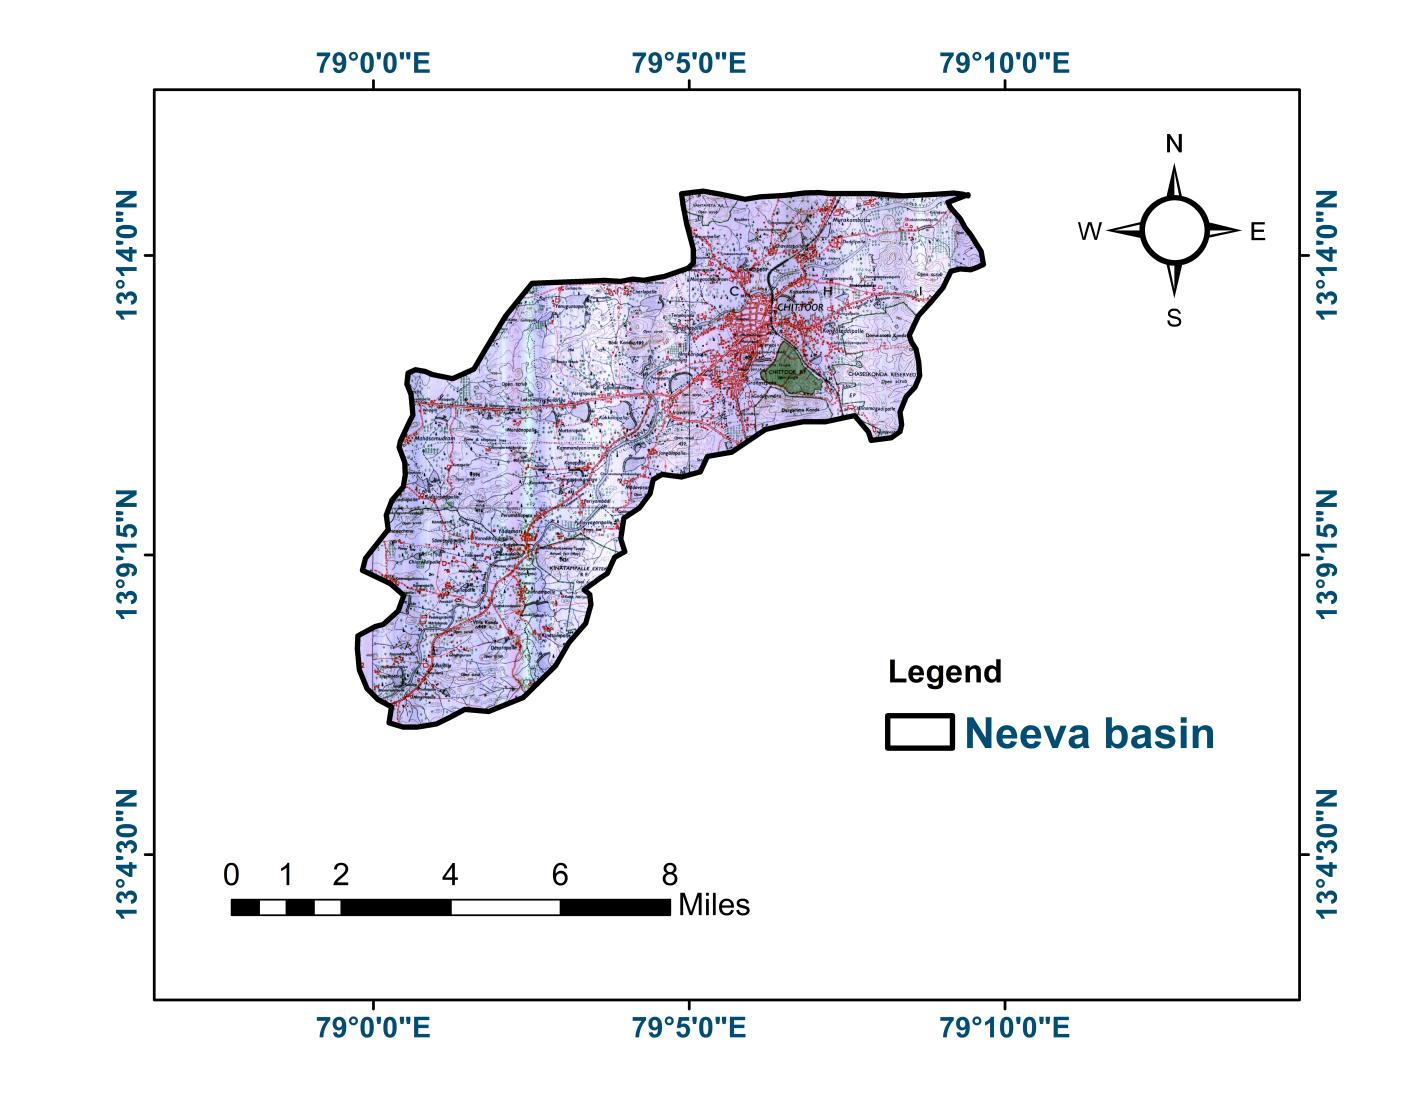
Slope is a significant terrain characteristic, which expresses the steepness of the ground surface. Slope gives essential informationonthenatureofthegeologicandgeodynamicprocessesoperatingatregionalscale(RileyS.Jetal.1999).
International Research Journal of Engineering and Technology (IRJET) e-ISSN:2395-0056
Volume: 11 Issue: 04 | Apr 2024 www.irjet.net p-ISSN:2395-0072
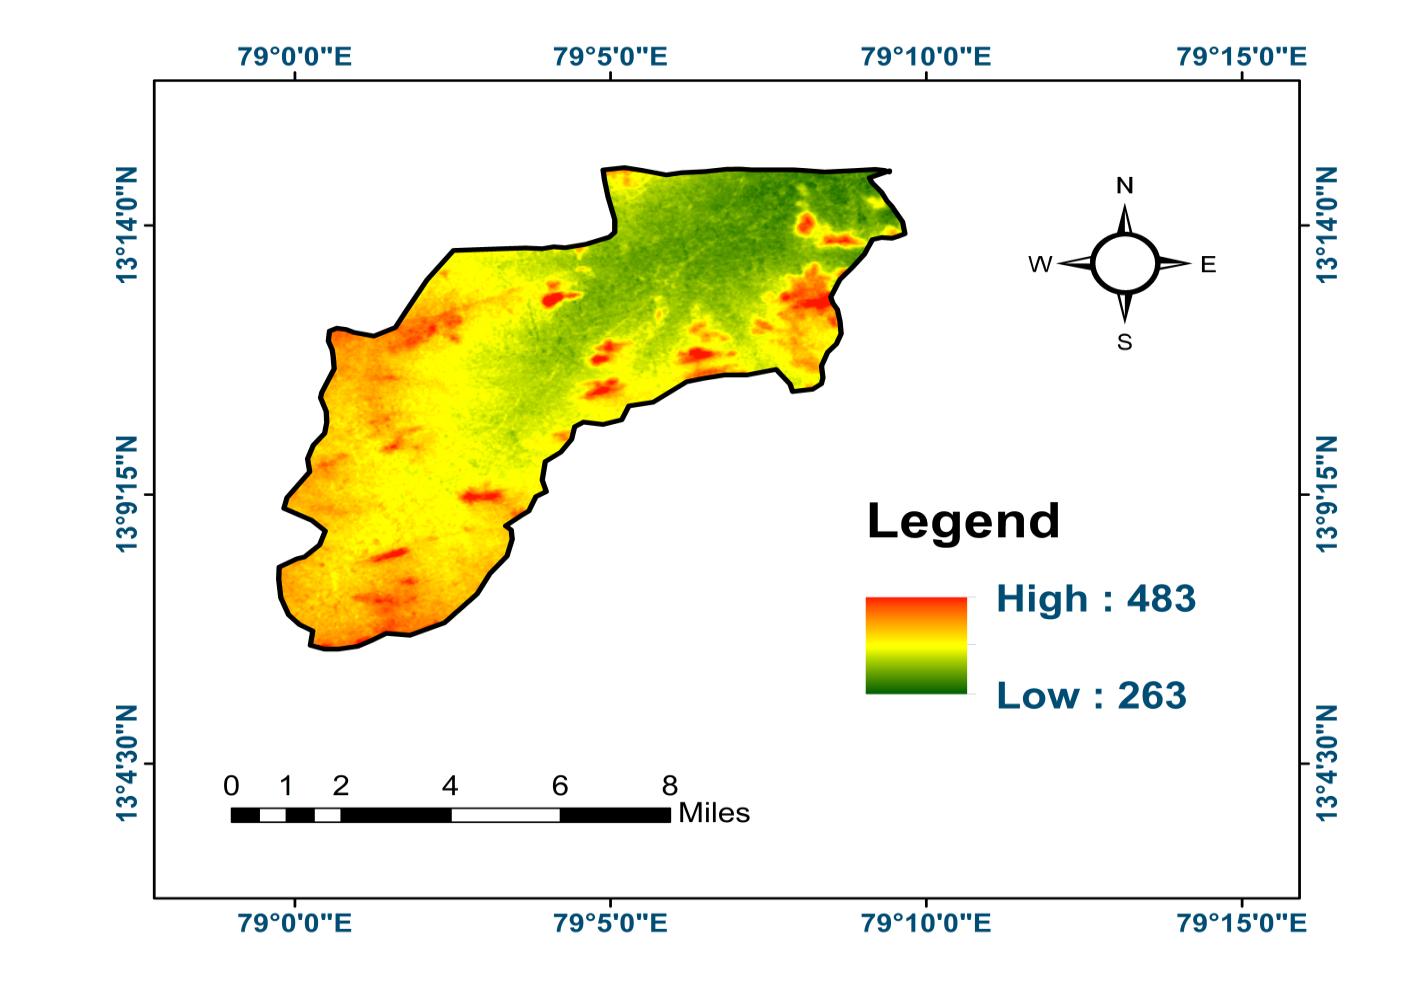
Class having less value is assigned higher rank due to almost flat terrain while the class having maximum value is categorizedaslowerrankduetorelativelyhighrun-off.Table1representstheSlopeofthebasinvariedfrom1to128and valuesarereclassifiedintofourcategories Figure3presentsslopedepictedfromDigitalElevationModel(DEM) (Figure 2)
Table 1: Details of Slope map
International Research Journal of Engineering and Technology (IRJET) e-ISSN:2395-0056
Volume: 11 Issue: 04 | Apr 2024 www.irjet.net p-ISSN:2395-0072
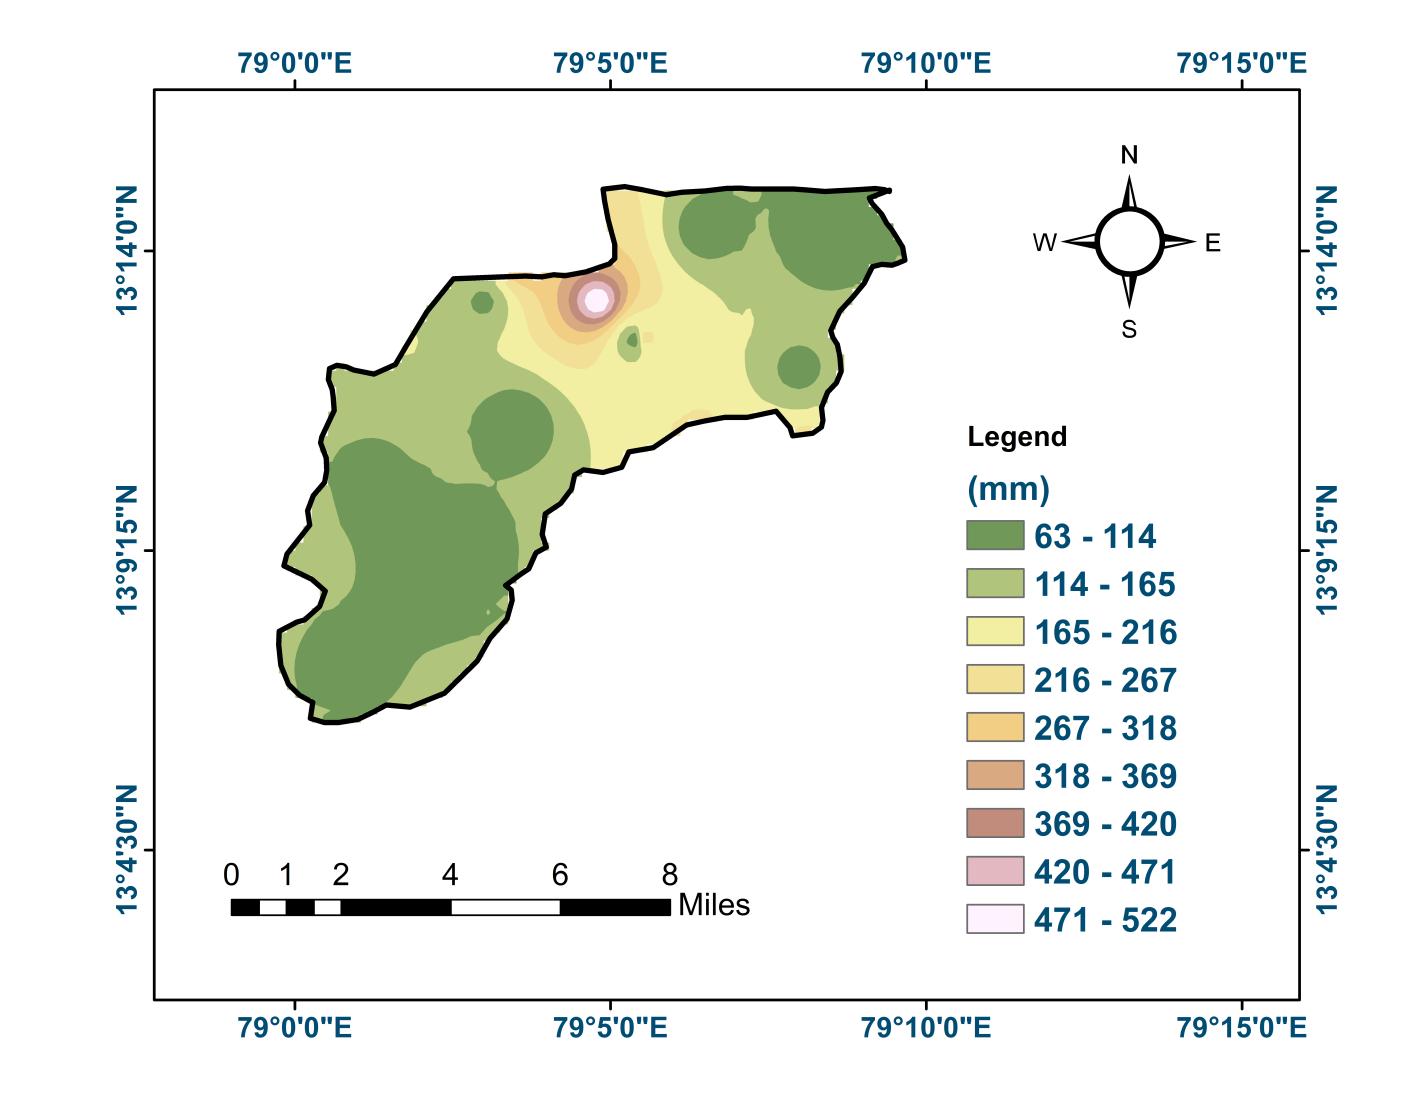
3.1.2 Rainfall Map
Rainfall is the major source of recharge. It determines the amount of water that would be available to percolate into the groundwater system. Rainfall in the study area grouped into four classes based on annual rainfall in the study area as listedinTable2 RainfalldatadepictsthatNorthernandEasternpartsoftheareareceivemaximumrainfall.Highrainfall is favorable for high groundwater potential, hence assigned higher priority. The data was interpolated and spatial distribution map of rainfall was created using IDW technique as shown in Figure 4 Rainfall values categorized as poor, goodandexcellent.Accordingly,observedthat77.91%ofthestudyareafallsinpoorrainfallarea(60-220mm),16.04%in goodrainfallareasandonly6.05%oftheareafallsintoexcellentrainfallarea.
International Research Journal of Engineering and Technology (IRJET) e-ISSN:2395-0056
Volume: 11 Issue: 04 | Apr 2024 www.irjet.net p-ISSN:2395-0072
LULC gives the essential information on infiltration, soil moisture, groundwater, surface water, in addition to providing information on groundwater requirements. Landuse is interpretable by satellite images. Various types of landusepatternwereidentifiedinthestudyareawhichincludeswaterbodies,forest,agriculturalland,andbuilt-uparea (Table3). Vegetationandrivercourseare excellent sitesforgroundwater exploration,and hence giventhehighestrank, pavedsurfacesranksverylowasithasrunoffatmaximum.Figure5presentsthedistributionofLULCinthebasin.
Table 3: Extent of Land use/land cover classes in the study area
International Research Journal of Engineering and Technology (IRJET) e-ISSN:2395-0056
Volume: 11 Issue: 04 | Apr 2024 www.irjet.net p-ISSN:2395-0072
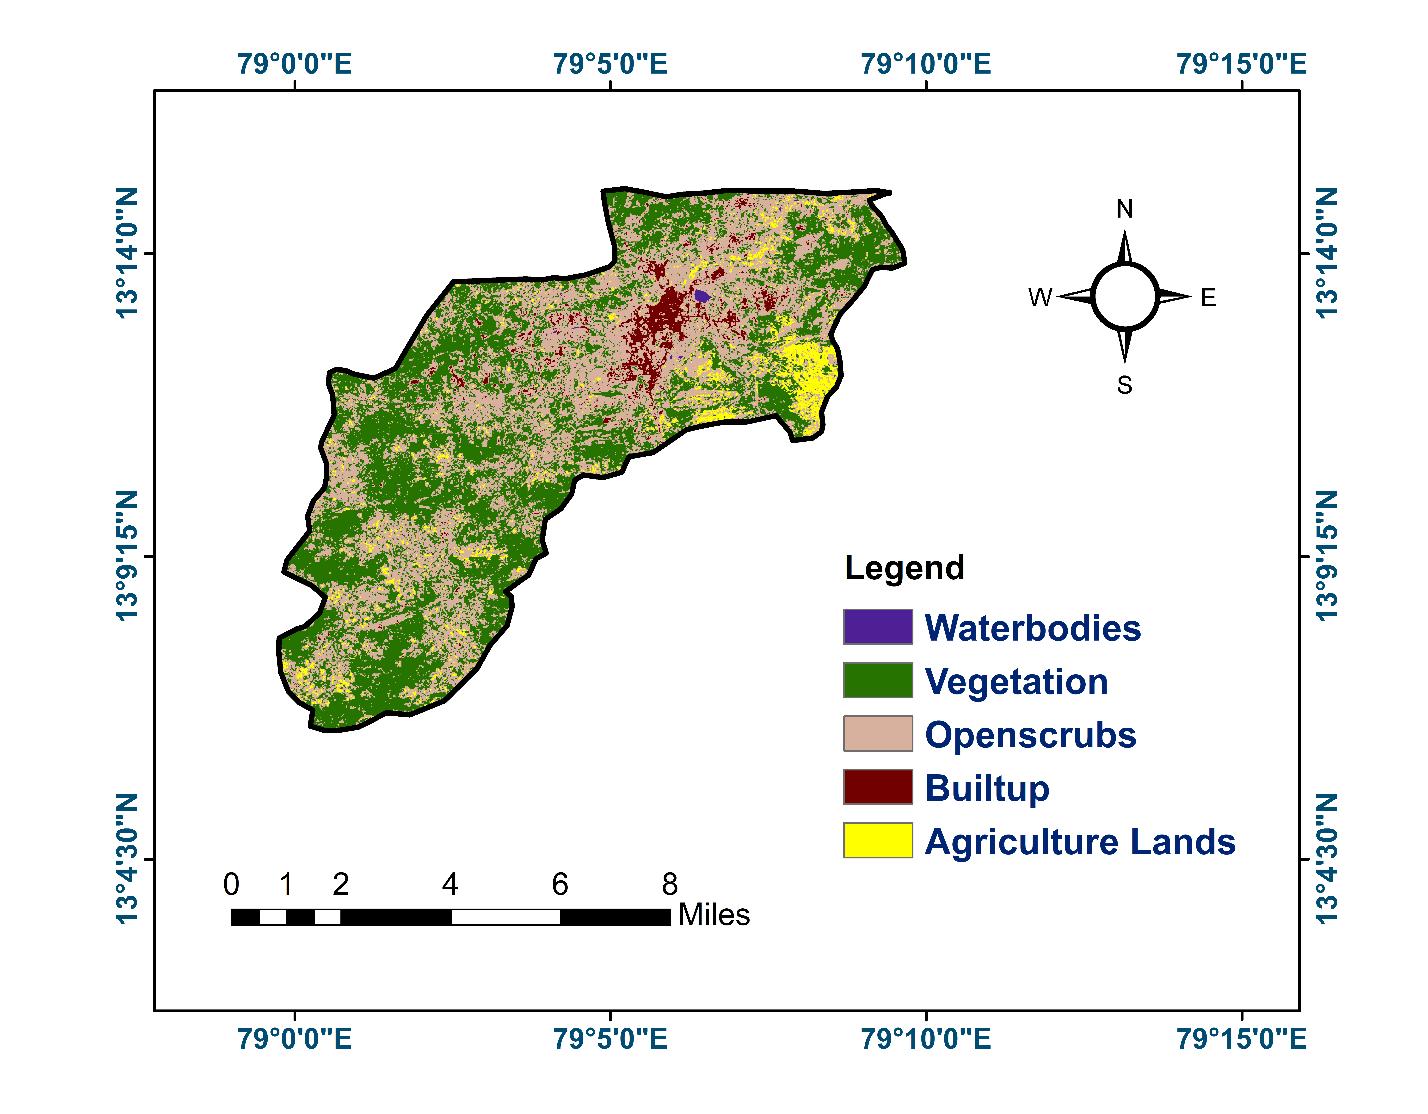
5 : Landuse/Land Cover pattern in Neeva River basin
3.1.4 Groundwater level Map
Piezometric levels of groundwater tables in the post-monsoon season data collected from Groundwater Department of AndhraPradesh,todeterminedirectionandmovementofgroundwatertoascertaintheflowaccumulationintheaquifers.
Table 4: Piezometric levels of groundwater in the study area
International Research Journal of Engineering and Technology (IRJET) e-ISSN:2395-0056
Volume: 11 Issue: 04 | Apr 2024 www.irjet.net p-ISSN:2395-0072
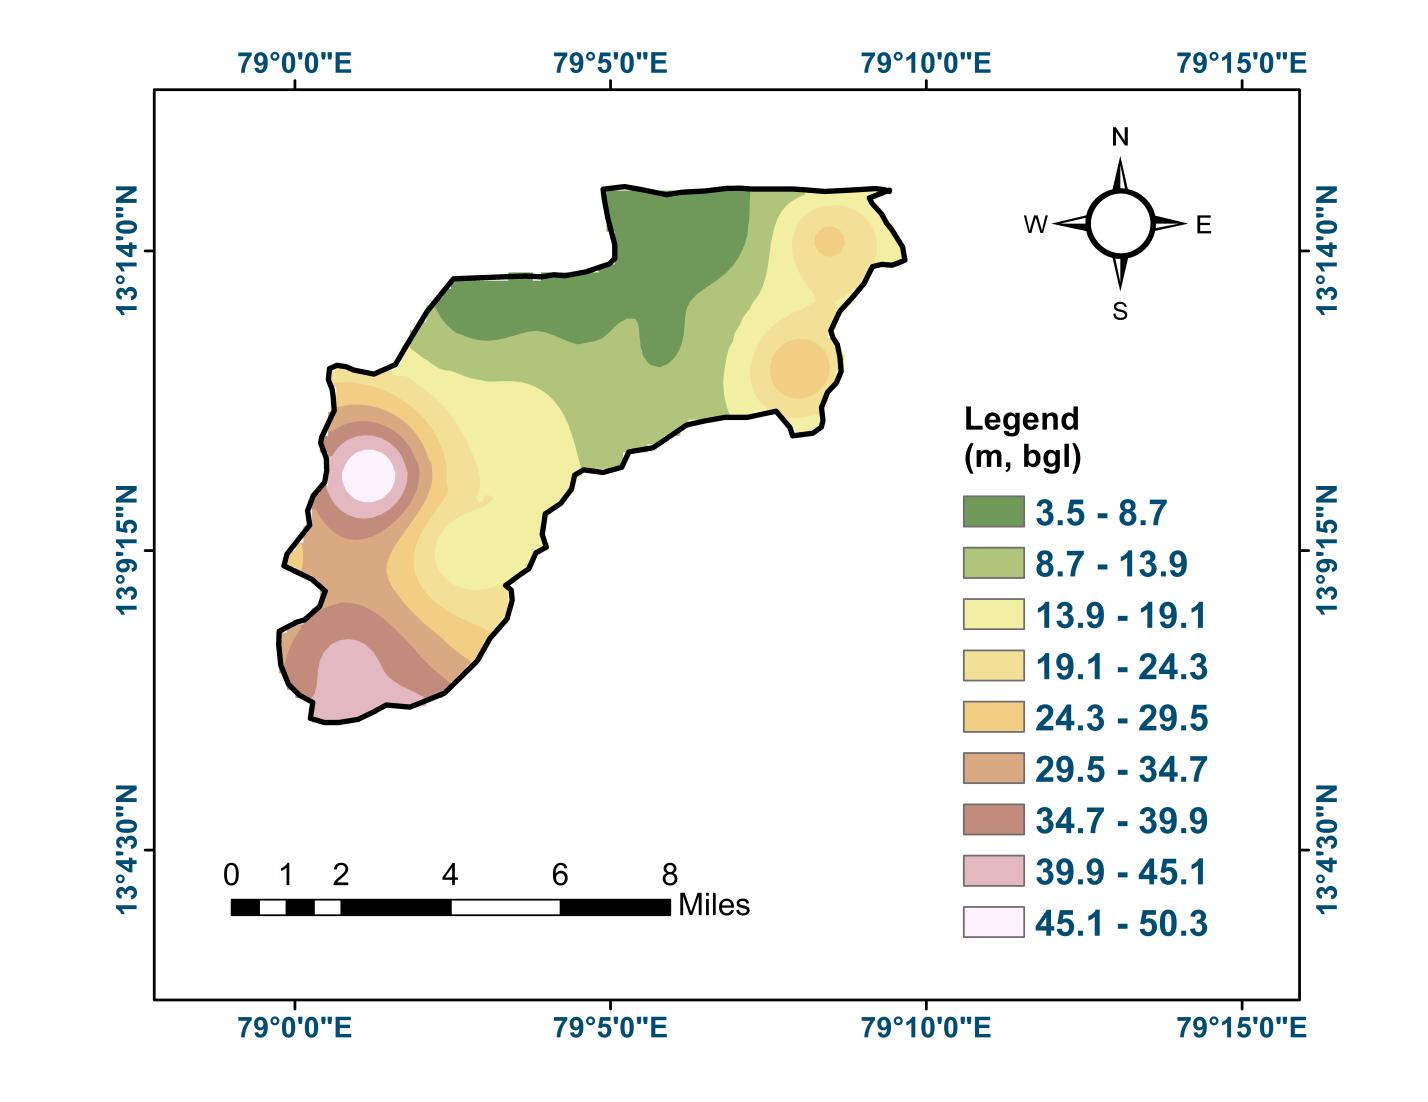
6 : Depth to Groundwater Level map in Neeva River Basin
InPost-monsoonseason,groundwaterlevelwithmajorportionoftheareahaving10mdepth.IntheSouthernpartofthe area,groundwaterdepthwasgreaterthan50m.Groundwaterlevelinnorthernpartvariesfrom10to30m,withaofthe study area of 27.77 Sq.km (Table 4) Spatial map is prepared using Inverse Distance Weighted (IDW) tool as shown in Figure6.
3.1.5 Groundwater potential Zones Map
Groundwaterisareplenishableresource,butduetovariouskindsof anthropogenicactivitiesandskeweddevelopments, rechargeofthissustaining resourcereducedsignificantlyinthe pastfewdecades (Kumaret.al.2018).Thegroundwater availability is not uniform in space and time and therefore, an assessment of the Groundwater Potential Zones (GWPZ) map is prepared using weighted overlay technique in the GIS environment with the selected parameters viz., slope, rainfall,landuse/landcoverandgroundwaterlevel.
International Research Journal of Engineering and Technology (IRJET) e-ISSN:2395-0056
Volume: 11 Issue: 04 | Apr 2024 www.irjet.net p-ISSN:2395-0072
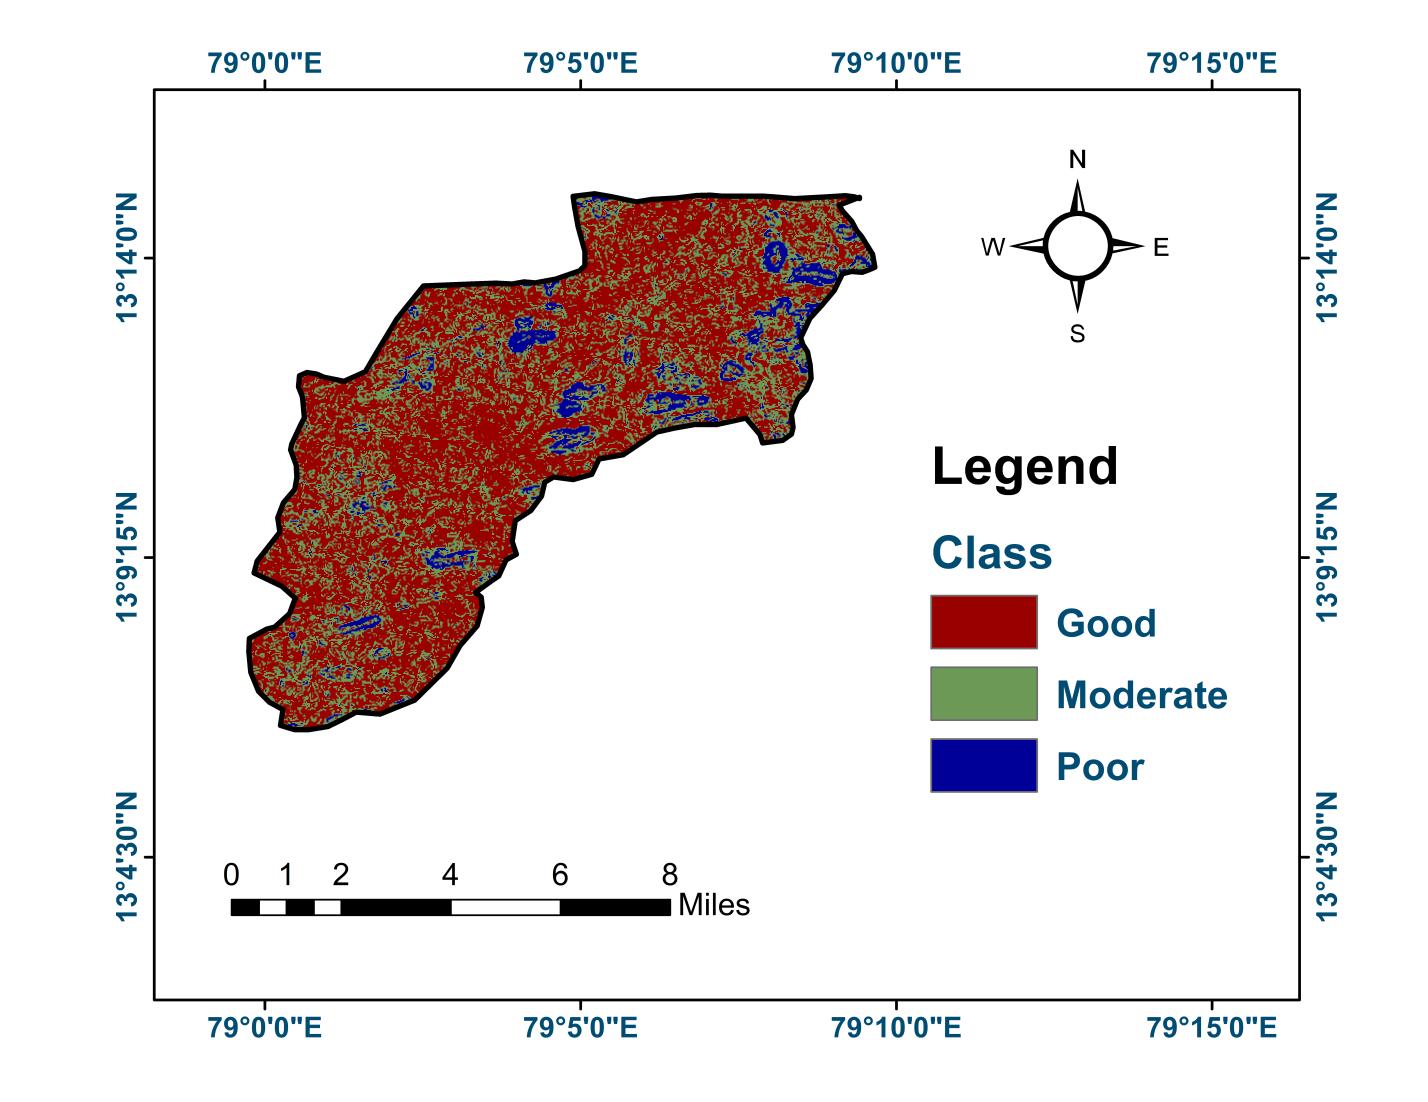
7: Map showing the Groundwater Potential Zones in Neeva River basin
Theresultsrevealedthat80.26sq.km.(61.27%)ofareahasgoodgroundwaterpotential,26.07sq.km(19.9%)ofareahas moderate groundwater potential and 24.67 sq.km (18.83 %) area is with poor groundwater potential as illustrated in below Figure 7. The figure also depicts, good groundwater potential zones occur predominantly in midland and lowland regions.Goodgroundwaterpotentialzonesconfinedgenerallytohighrainfallregions,whichinturnhavehighinfiltration runoffs
Physico-chemical analyses carried out for all the groundwater samples from forty-three well locations collected during Post-monsoon period. Samples collected as per BIS standards and procedures prescribed by American Public Health Association (APHA, 2012) followed to attain relative weights based on National Sanitation Foundation (NSF) Method(AragawandGnanachandraswamy2021;Attaet.al.2022)asshowninTable5 Eachofthegroundwatersamples was analyzed for Eight parameters viz., pH, Chlorides (Cl-), Fluorides (F-), Calcium (Ca2+), Magnesium (Mg2+), Sulphates (SO42-),TotalHardness(TH)andTotalDissolvedSolids(TDS).Usingthesevalues,GroundwaterQualityIndex(GWQI)map developed using Inverse Distance Weighted (IDW) tool in GIS environment to study the overall effect and individual qualitystatusoverthebasinshowninFigure8 DetailsofthewelllocationsandGWQIobtainedusingNSFmethodshown inTable6
International Research Journal of Engineering and
Volume: 11 Issue: 04 | Apr 2024 www.irjet.net
Table 5 : Relative Weightages for physico-chemical parameters
Table 6: GWQI data at various locations in the study area S.No
International Research Journal of Engineering and Technology (IRJET) e-ISSN:2395-0056
Volume: 11 Issue: 04 | Apr 2024 www.irjet.net
Table 7: Study Area classified based on GWQI value
International Research Journal of Engineering and Technology (IRJET) e-ISSN:2395-0056
Volume: 11 Issue: 04 | Apr 2024 www.irjet.net p-ISSN:2395-0072
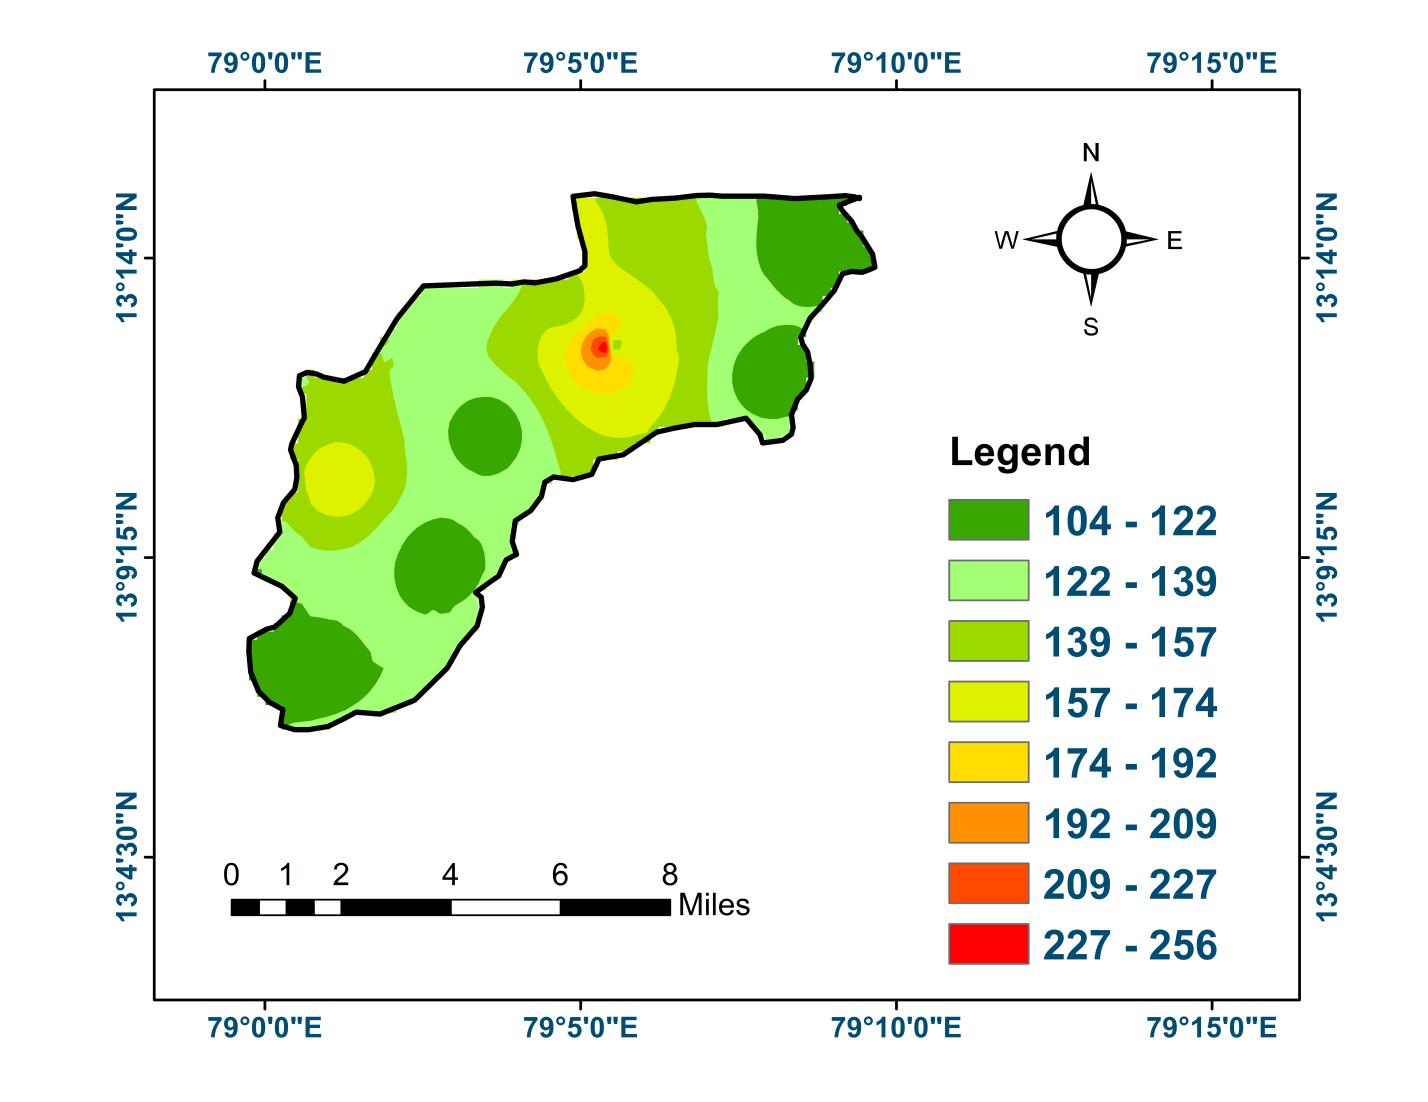
GWQIinthepresentstudyemphasizesthatmajorityofthesamples(Table7)fallsundermoderatecategory,thisisdueto various factors such as waste and wastewater disposal methods adopted in the study area are the probable reasons for deterioration of quality of groundwater. Spatial distribution map generated using physico-chemical parameters will help inidentifyingqualitystatusacrossthestudyarea.GWQImapdevelopedusingNSFmethod,oftenprovidesinformationfor better groundwater treatment procedures Remedial measures such as artificial recharge and control measures for contaminanttransportintheporousmediummustbeprioritytoimprovequalityofgroundwater.
3.3
Inthepresentstudy,groundwateristheonlysourcetomeetthedomesticneedsofthe Chittoordistrictinadditiontothe available surface water resources. The intensive groundwater draft leading to critical situation and the problem will manifestitselfintheformofdeclininggroundwaterlevelsandshortageinsupply (SekarandRandhir,2007).Inaddition toalltheremedialmeasuresdiscussed,waterconservationregulationsprovidedbelow: AndhraPradeshWater,Landand Trees Act, 2002 (APWALTA, 2002) is a comprehensive act covering surface and groundwater resources. The act aims to promotewaterconservation,enhancetreecoverandregulatetheexploitationanduseofgroundandsurfacewater.
Frequent monitoring of groundwater levels, water quality and the amount of water abstracted will provide an early warningsystemforefficientgroundwatermanagement(Theesfeld,2010;SasaneandPatil,2013;Pino-Vargaset.al.2023) It assumes greater significance with competing demands for water in the area. The state government can institute legislationsto protect thedrinkingsources. Wherever there isa gap between demandand the resource augmentationof the groundwater by way of constructing percolation tanks, check dams and water harvesting structures (Moench, 1996; IDSA,2010;Foster,2020).Watershedmanagementprogrammesalsohelpinimprovingthegroundwaterrechargethereby increasingitsaugmentation.
© 2024, IRJET | Impact Factor value: 8.226 | ISO 9001:2008 Certified Journal | Page1686
International Research Journal of Engineering and Technology (IRJET) e-ISSN:2395-0056
Volume: 11 Issue: 04 | Apr 2024 www.irjet.net p-ISSN:2395-0072
The objectives of present study attained by understanding various methods of estimating groundwater potential zones through a mix of theoretical and practical approaches. The parameters that affect the groundwater potential selected throughdetailedstudyofsimilarearlierworksinotherregions.Resultsindicatedthat80.26(61.27%),26.07(19.9%)and 24.67 (18.83%) sq.km. of area has good, moderate and poor groundwater potential. Groundwater potential zones map developedwillbehelpfulforgroundwatermanagementinthestudyarea. Ontheotherhand, groundwaterqualityinthe study area revealed that 20.93%, 74.42% and 4.65% of area has good, moderate and poor quality of groundwater respectively.Thisstudyalsoencompassestheresultsofqualityofgroundwaterwithmoderateclassinthemajorityofthe portion. However,the qualityofgroundwateraround the CMC andits surroundings fell under poor groundwater quality duetopresenceofmultiplecontaminationsourcesintheurbanarea Thecurrentpolicyframeworkdiscussedabovewith implicationsforbettergroundwatermanagementinthestudyarea
Declarations
Acknowledgements
Special thanks toSriVenkateswara UniversityCollegeofEngineeringforaccording permission tocarry outthis research work.
Funding
Theauthor(s)receivednofinancialsupportfortheresearch,authorship,and/orpublicationofthisarticle.
Conflict of Interest
Theauthorsdonothaveanyconflictofinterest.
Data availability statement
Supportingdataismadeavailablewiththecorrespondingauthoruponreasonablerequest.
References
1. AhmadM.,WimG.M.BastiaanssenandReinderA.Feddes,“Anewtechniquetoestimatenetgroundwateruseacross large irrigated areas by combing remote sensing and water balance approaches, Rechna Doab, Pakistan”, HydrogeologyJournal,Vol.13,2005,p653-664.
2. ANDHRA PRADESH WATER, LAND AND TREES ACT – 2002 (APWALTA – 2002), https://forests.telangana.gov.in/pages/Acts_Rules/WALTA%202002%20(AP).pdf(Accessed02/04/2024)
3. Anu Varughese, Abdul Suhail, Chitra M.G, Jiji P.S, Deepthy C, Raneesh, K. Y. “Identification of shallow groundwater potential zones using GIS – A case study” International Journal of Advanced Engineering Applications, Vol.1, 2012, pp.65-70.
4. APHA, “Standard Methods for the Examination of Water and Wastewater”, 2012, 22nd edition, American Public HealthAssociation,WashingtonDC.
5. Aragaw, T.T., Gnanachandrasamy, G. Evaluation of groundwater quality for drinking and irrigation purposes using GIS-based water quality index in urban area of Abaya-Chemo sub-basin of Great Rift Valley, Ethiopia. Appl Water Sci 11,148(2021).https://doi.org/10.1007/s13201-021-01482-6
6. Atar Singh, Rajesh Kumar, Ramesh Kumar, Prity Singh Pippal, Payal Sharma, Tanuja, Abhilasha Sharma, “Delineation of groundwater potential zone using geospatial tools and analytical hierarchy process (AHP) in the state of Uttarakhand, India”, Advances in Space Research, Volume 73, Issue 6, 2024, Pages 2939-2954, ISSN 02731177,https://doi.org/10.1016/j.asr.2023.12.041
7. Atta, H.S., Omar, M.AS. & Tawfik, A.M. Water quality index for assessment of drinking groundwater purpose case study:areasurroundingIsmailiaCanal,Egypt. J. Eng. Appl. Sci. 69,83(2022).https://doi.org/10.1186/s44147-02200138-9
8. BIS,“StandardSpecificationsforPotableWater”,BureauofIndianStandards(BIS-10500-2012),May2012.
International Research Journal of Engineering and Technology (IRJET) e-ISSN:2395-0056
Volume: 11 Issue: 04 | Apr 2024 www.irjet.net p-ISSN:2395-0072
9. Dar, I.A., Sankar, K., and Dar, M.A., 2011. Deciphering groundwater potential zones in hard rock terrain using geospatialtechnology.EnvironmentalMonitoringandAssessment,173(1),597–610.
10. Foster S. Global Policy Overview of Groundwater in Urban Development A Tale of 10 Cities! Water. 2020; 12(2):456.https://doi.org/10.3390/w12020456
11. GEC. (1997). “Groundwater Resource Estimation Methodology”, 1997, Report of the Groundwater Resource EstimationCommittee,CentralGroundWaterBoard,MinistryofWaterResources,GovernmentofIndia.
12. GEC (2015) Report of the Groundwater Resource Estimation Committee; Central Ground Water Board, Ministry of WaterResources,GovernmentofIndia,NewDelhi.
13. IDSA(2010)WatersecurityforIndia;TheExternalDynamics,InstituteforDefenceStudiesandAnalyses.
14. Kumar,S.;Bhattacharya,P.;Singh,R.;Mukherjee,S.Groundwaterleveldeclineandaquifervulnerabilityassessment intheGhaggarRiverBasin,North-WestIndia. J. Hydrol 2018, 563,674–685.
15. Magesh N.S., Chandrasekar N. and John Prince Soundranayagam“Delineation of groundwater potential zones in Thenidistrict, Tamil Nadu, using remotesensing,GIS andMIF techniques” Journal ofGeoscience, Vol3(2),2012,p 189-196.
16. Maitre, D.C.L., Scott, D.F., and Colvin, C.,A review of information on interactions between vegetation and groundwater,SouthAfricaWaterResearchCommission,1999.
17. Moench, M. 1996. Groundwater policy: Issues and alternatives in India. Colombo, Sri Lank. International Irrigation ManagementInstitute.x,61p.(IIMICountryPaper,IndiaNo.2)
18. Naik P.K. andAwasthi A.K., “Groundwater resources assessment of the Koyna River basin, India”, Hydrogeology Journal,Vol.11,2003,p582-594.
19. Pino-Vargas E, Espinoza-Molina J, Chávarri-Velarde E, Quille-Mamani J, Ingol-Blanco E. Impacts of Groundwater Management Policies in the Caplina Aquifer, Atacama Desert. Water. 2023; 15(14):2610. https://doi.org/10.3390/w15142610
20. Rehman,A.,Islam,F.,Tariq, A.,Ul Islam,I.,BrianJ,D.,Bibi,T., …Al-Ahmadi,S.(2024).Groundwaterpotential zone mapping using GIS and Remote Sensing based models for sustainable groundwater management. Geocarto International, 39(1).https://doi.org/10.1080/10106049.2024.2306275
21. Riley,S.J.(1999).Indexthatquantifiestopographicheterogeneity.Intermt.J.Sci.5,23-27.
22. Sasane V. V. and Patil V. M. (2013) Assessment of Ground Water Quality Status Using NSFWQI Method in Selected Rural Area of Kopargaon, Ahmednagar, Maharashtra, International Journal of Advanced Technology in Civil Engineering,Volume-2,Issue-1,5-10.
23. Sekar, I., & Randhir, T. O. (2007). Policies for sustaining groundwater resources in India. Water International, 32(sup1),697–709.https://doi.org/10.1080/02508060.2007.9671991
24. Sutradhar S, Sarkar D, Bhuimali A, Mondal P. 2022. Integration of different geospatial factors to delineate groundwaterpotentialzonesusingmulti-influencingfactorsunderremotesensingandGISenvironment:astudyon Dakshin Dinajpur district, West Bengal, India. Sustain Water Resour Manag. 8(1):37. doi: 10.1007/s40899-02200630-3.
25. TariqA,HashemiBeniL,AliS,AdnanS,HatamlehWA.2023.Aneffectivegeospatial-basedflashfloodsusceptibility assessment with hydrogeomorphic responseson groundwater recharge. Groundw SustainDev. 23(8):100998. doi: 10.1016/j.gsd.2023.100998.
26. Theesfeld,I.2010.Institutionalchallengesfornationalgroundwatergovernance:Policiesandissues.GroundWater 48:131-142.
27. WorldHealthOrganization.(2017).Guidelinesfordrinking-waterquality-incorporatingthefirstaddendum.