
International Research Journal of Engineering and Technology (IRJET) e-ISSN:2395-0056
Volume: 11 Issue: 04 | Apr 2024 www.irjet.net p-ISSN:2395-0072
International Research Journal of Engineering and Technology (IRJET) e-ISSN:2395-0056
Volume: 11 Issue: 04 | Apr 2024 www.irjet.net p-ISSN:2395-0072
Saransh Juneja, Shivam Vohra, Souvik Banerjee, Subhranshu Shekhar1
Department of Electronics and Communication Engineering, Dr, Akhilesh Das Gupta Institute of Technology and Management, New Delhi-58
Abstract
This study aims to develop a system where the input power comes from self-powered water flow energy harvesting system. This Water flow harvesting system hasbeendesignedusingawaterpumpandPeltonwheel turbine,which enablesus to transformkinetic energyof the water flow into electrical energy which is further usedtopowerlowpowerelectronicdevicesandsensors. Thesespecializedhydro-systemscanoperateinavariety of head and flow conditions depending upon the water flow rate The water flow energy harvesting system and waterpressurefluctuationintroducedduringthetesting and the analysis of the project is also used to generate small amount of power. The output produced through the energy harvesting system is predicted to be about 1.87Waspertheresultsachievedwhichisgoodenough torunthelowpowerelectronicdevices.
Keywords: Arduino, Energy Harvesting, Turbine, water
INTRODUCTION
The extraction of energyfromnon-conventional sources in the environment has received increasing attention over the past decade by researchers studying these alternative energy sources for low power consumption applications. The researchers constantly aim at figuring out recent advancements in the field of energy harvesting. There is a lot of wasted energy in the environment which can be converted to its useful form andshowcasingitasapotentiallycheapsourceofpower. With the advent growth of technology in the 21st century, we have arrived at a point where many of today'smoreefficientbatterytechnologiesuseelements such as lithium, which are often quite rare considering thedemandforchemicalsforindustrialpurposes.Today we have to think about how we can manufacture these materialslookingatthehumanneedsand,perhapsmore importantly, how we can dispose of them at the end of their useful life. The demand for these materials is increasing exponentially with the demand for the materials required to manufacture them. Concerns have been constantly raised about the fate of the planet, not only about how we can fulfil the demand but also about its impact on the world. What the world needs now is a
new generation of products that generate their energy from their local environment, rather than relying on conventional batteries. The world needs us to develop products that use energy harvesting as the base for powering low-power electronic devices. We and the world cannot afford not to ignore the subtle demand of thisneed.
That raises the question of what basically is Energy Harvesting? Energy harvesting could be termed as a processofextractingandconvertingtheambientenergy when it is easily accessible into its usable form such as electrical energy e.g., Wind Energy Harvesting. Energy harvesting is important as it provides an alternative power source for electronic devices where traditional energysourcesarenotavailable.Thistechnology,canbe extended to devices in the IoT which eliminates network-based energy and conventional batteries, minimizes maintenance costs, eliminates cables and batteries, and is environmentally friendly. Energy generation promotes environmentally friendly technologies that save energy and make this technology indispensable for achieving next-generation smart cities and sustainable society. Previously, solar energy and mechanical energy were two of the most important and only known sources used to produce energy. However, the surge in demand has led to a growing focus on the sciencethataimstoextractenergyfromvarioussources such as wind, geothermal, rain, or other natural vibrations. Piezo-electric, thermoelectric are also the techniquesthathavebeenusedinthepasttocontribute to the research in this field. The researchers lately introduced such energy harvesting networks that can harvest electromagnetic waves as well as radio waves intoelectrical energyforpowergenerationThedecision about using the harvesting method depends on the locationandtheapplicationinvolved.Thedifferencelies in the amount of energy produced with each of the different technique. The table given below depicts the PowerDensityindifferentenergyharvestingmethods.
Table 1 Clearly highlights the comparison of various Energy Harvesting Methods with respect to their Power Densities with their Units. We can also learn about the elementsinvolvedinthoseharvestingtechniques.
International Research Journal of Engineering and Technology (IRJET) e-ISSN:2395-0056
Energy Harvesting Methods Energy Harvesting Elements Power Density
SolarandLight Energy Harvesting
Mechanical Energy Harvesting
Thermoelectric Energy Harvesting
Electromagnetic WaveEnergy Harvesting
Photovoltaic solarPanel
Windturbine Vibration
piezoelectric Wafer Vibration
Electromagnetic vibration electrostatic
Thermoelectric Converter
RFHarvesting Board
1500µW/cm2 (Outdoor sunlight 1000W/m2)
3.5mW/cm2
500µW/cm2
4.0µW/cm2
3.8µW/cm2
40µW/cm2
100µW/cm2 Temperature difference5oC
20mW (915MHz Inputpower 100mW)
Table 1. Comparison of power densities of various Energy Harvesting Techniques.
LITERATURE REVIEW
From H F Liew et al 2021 [1], In this water pipeline systemconsistsoftwoArduinoandtwoLCDscreenused in the system to display different parameters from the source. The first Arduino and LCD is work as screen to collect and display data from the hydroelectric generator. Then the second Arduino and LCD screen is used to collect and display data from the water flow sensor. At the same time, power generated from the hydroelectric generator will directly function as to light up a LED bulb. Also, parameters measured which are included current, voltage and power from the generator willbedisplayedontheLCDscreenwithanArduinoUno boardastheprocessor.Fromthesource,waterwillflow throughthewaterflowsensortomeasurethewaterflow rate. Water flow rate will also be displayed on the LCD screen with an Arduino Uno as the processor. Finally, withtheESP8266Wi-Fimoduleastheprocessor,allthe parameters obtained should be displayed on the webserverforthemonitoringsystempurposes.Asthewater flow rate increased, the voltage generated by the generator also increased. The voltage varies constantly fromwaterflowraterange3-12L/minbutatrange1215 L/min, voltage experienced raise and increase
Volume: 11 Issue: 04 | Apr 2024 www.irjet.net p-ISSN:2395-0072 © 2024, IRJET | Impact Factor value: 8.226 |
constantly at range 15 - 20 L/min. The result present that water flow rate is controlled by controlling the water pipe faucet with 3 L/min recorded as the minimumwaterflowrateand20L/minrecordedasthe maximum water flow rate by the water flow sensor. When output current produced from the system increasing from 23 mA as the minimum value and 107 mAasthemaximumvaluearerecorded.
In2015,Casini[2], The internal and external systemsof the in-pipe hydropower system are separated into two primary groups and two main portions. In internal system the runner is totally inside the pipe section and only the generator sticks out from the pipe have the merit of minimal size, making it more useful for smaller applications, but not limit itself. The output of this project varies from 5-10 Watt to 100 KW for more energy-required applications, which to provide selfpowered water metering or monitoring systems. On the otherhand,externalsystemwhereasecondarypipethat covers the main pipe contains a runner which do not depend upon the size of the pipe and allows much greaterflexibility.
Ye and Sogain2012[3]suggestedthat wantto monitor water distribution systems within the facility trade within the field of energy harvest. thanks to harvest renewable energy from a water or environmental distribution system would be a gorgeous possibility, water sensors are put in into areas wherever power provide is lacking and downsides difficulties replacementofbatteriesordrawbackrestrictedlifetime. The water distribution systems into energy harvest systems square measure analyzed, compared and modelled victimization simulation knowledge and real knowledge [1, 2]. The resultsofthisanalysisintroduced by hydrothermal energy harvesters and water pressure fluctuationsisprobablygoingtoproducerangeinmWof power. Overall, this works reportable that on the likelihoodofenergyharvest ina verywaterdistribution system from hydraulic energy in bypass water pipes, thermal energy in water-air gradient, and mechanical energyinwaterpressurefluctuations.
This research work deals with the water flow energy harvesting system using water flow through a dual pressure pump to replicate a natural water flow, which helps measure various electrical parameters such as DC Current, DC Voltage, AC Voltage using Arduino platform and generates energy for intelligent measurement applications. This research also highlights some prime ideas for enhancing the amount of energy produced by water flow energy harvesting system, which is dependent upon the power output, water pressure whichvarieswiththeoutputofPressurepumpused.The project work generates power output which is good enough to operate low power devices such as sensors controlled using Arduino software. Furthermore, the
International Research Journal of Engineering and Technology (IRJET) e-ISSN:2395-0056
Volume: 11 Issue: 04 | Apr 2024 www.irjet.net p-ISSN:2395-0072
application can be extended across locations closer to the arches based on the water flow rate through which variousexperimentalconfigurationscanbeexperienced.
A system to generate hydroelectric power from water is designed using Arduino Uno as the core of processor to obtain all the data and parameters required and display itontotheLCDscreenfor monitoringparameteraswell as use Bluetooth for measuring Temperature and Humidity data. In this energy harvesting prototype, the system consists of Two Arduino and one LCD screens that are used in the system to display various parameters from the source. The project starts with the use of a 24v dc pump to create the necessary pressure requiredforthePeltonwheeltorotate.Thispressurized water jet strikes the runner of the Pelton wheel turbine which is connected to an alternator which converts this rotationalmechanicalenergytoelectricalenergyinform of alternating current (A.C), this A.C is then passed through full bridge rectifier with a 2200uf capacitor to obtainasmoothD.Coutput.ThisD.Coutputisthenused to power an Arduino uno directly and charge a 7.5-volt battery pack simultaneously. The first Arduino is connected to a voltage sensor and a lcd, the voltage sensor is a voltage divider consisting of two resistors of 30k�� and7.5k��i.e., a 5:1voltagedivider, thedata form thevoltagesensoristhendisplayedoverthelcdwithan Arduino board as the processor. The 7.5-volt battery pack isacombinationof6cellsof1.25Veachconnected in series to give a total of 7.5v output voltage. The battery pack is getting charged from the D.C supply providedfromtherectifierandisalsopoweringasecond Arduino simultaneously. This second Arduino is connected to a DHT-11 sensor and a HC-05 Bluetooth module. The DHT-11 sensor is used to measure the humidity and temperature, DHT-11 sensor consists of a capacitivehumiditysensingelementandathermistorfor sensing temperature. The moisture sensor capacitor contains two electrodes between which a moistureretainingsubstrateislocatedasadielectricmaterial.The Capacitance value changes in accordance with the change in humidity levels. The IC measures, processes these changed resistance values and changes them into digitalform.Thetemperaturesensoruses principleofa Negative Temperature coefficient thermistor, which in term can lead to resistance value decrease with temperature increase. To get a larger resistance value even for the smallest change in temperature the data from this sensor is sent to the Bluetooth module by the second Arduino, this Bluetooth module which uses the 2.45GHz frequency band. The data transfer rate may be variedupto1Mbpsandisintherangeof10meters.then sends the temp and humidity data to the phone connectedthroughthisBluetooth.
The main idea was to improve the efficiency of the energy harvester through the designing of a DC-to-DC Converter by using 555 timer and MOSFET as the switching device. The trade-off between voltage and currenthasbeenanintegral improvementintheenergy harvesterprototypesincethelowcurrent,lowvoltageor bothhavebeenanissuewiththeenergyharvestersfora long time now. Essential power management is important for various applications. The DC Voltage before using the Converter was 20V which was reduced to17VinordertoincreasetheDCcurrentforextending the range of sensors that could be powered using the power available from the energy harvester and furthermore increasing the efficiency of the energy harvester prototype designed in this research. The voltage fluctuations were reduced at the output and on LCD screen giving constant display for displaying the excess voltage obtained after powering the Arduino boards,voltagesensor.
In Table 2 Following Electrical Quantities were measured to analyse the energy performance of the water flow energy harvesting system and compare the results with the ones achieved through the researches done before and see how the system prototype is better than others. The Values displayed in the table listed belowarethePeakValues.
ACVoltage 8.4V 8.6V
Voltage 20V 17V
DCCurrent 90mA 110mA
DCPower 1.8W 1.87W Energy 0.440kWh 0.317kWh
Table 2 Electrical Parameters Obtained Time(minutes) Voltage Capacity 0-2 3.8V(50%) 2-3 5.6V(75%) 3-4 6.86V(91%) 4-5 7.04V(94%) 5-6 7.20(96%)
Table 3 Charging Phase Analysis
Table 3 showcases the charging phase analysis of the rechargeable battery pack that is charged through the
International Research Journal of Engineering and Technology (IRJET) e-ISSN:2395-0056
Volume: 11 Issue: 04 | Apr 2024 www.irjet.net p-ISSN:2395-0072
power obtained from the prototype of the energy harvesting system. The table contains the data of the time taken to charge the 7.5 V battery pack. The maximum capacity of the battery pack is 7.5V. The 2nd columnofthetablecontainsthebatteryvoltageachieved and the percentage of the total capacity of the battery. Firstly the stop watch is set at a timer of 2 minutes and thevoltagecapacityismeasures.Asobservedthebattery is charged to 3.8V in 2 minutes which is approximately 50% of the total capacity. In the next 1 minute the capacity exceeds to 75% of the total capacity. This is quiteobviouskeepinginmindthebatterywhenatlower voltage charges at a rapid rate at first and then the chargingrateslowsdownasitsdifficulttomovetheions insidethecellduetothetemperatureandpotential.
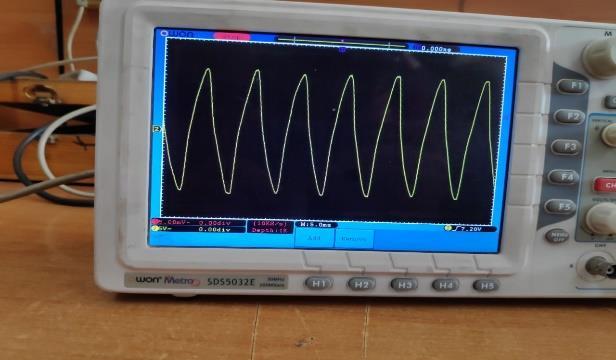
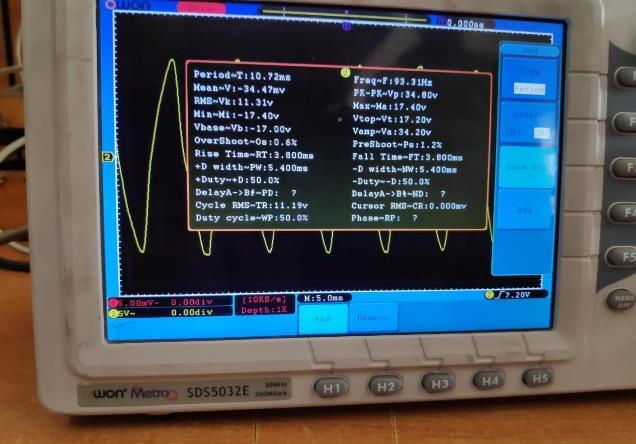
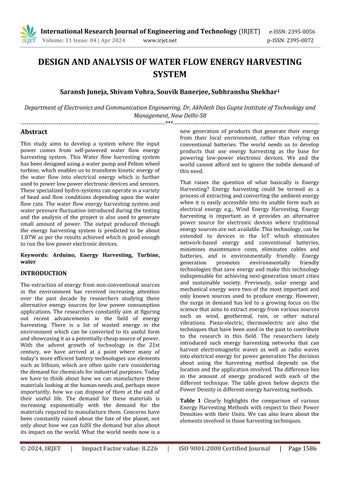
Figure 1 showsthevoltageplotsobtainedfortakinginto account the performance of the energy harvester designed. The Graphs were plotted using DSO (Digital StorageOscilloscope)fortheanalysisoftheperformance ofourprototype.
Figure 2 shows the enlistment of the Plot specifications suchasRMSValue,frequency,Peakovershootvalue,rise time, fall time, time period and various other specifications which gives us a better understanding of thevoltageplot.
The figure 3 above depicts the setup of the Energy HarvesterPrototype
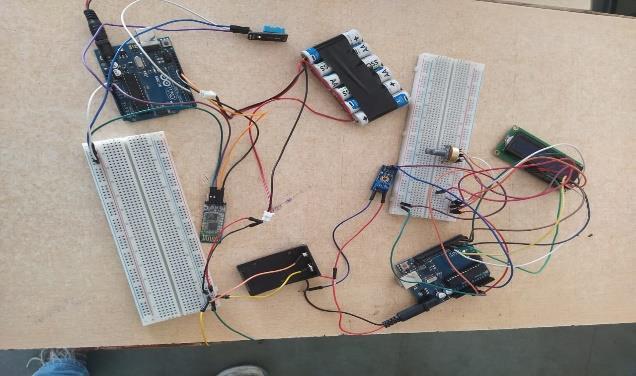
Figure 4 showcases the various sensors used for the application of the project such as DHT-11 Temp and Humidity sensor, Bluetooth HC-05 Module, Voltage sensor(Vcc<25V),lcdmodule
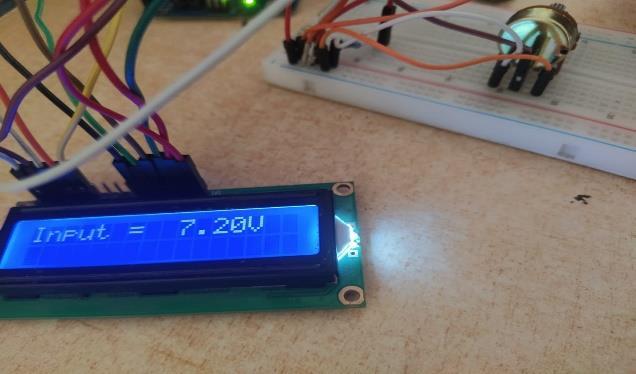
Figure 5 depicts the voltage sensor setup for displaying the excess output voltage after powering the deployed sensorsandArduinoBoardfortheirapplications.
International Research Journal of Engineering and Technology (IRJET) e-ISSN:2395-0056
Volume: 11 Issue: 04 | Apr 2024 www.irjet.net p-ISSN:2395-0072
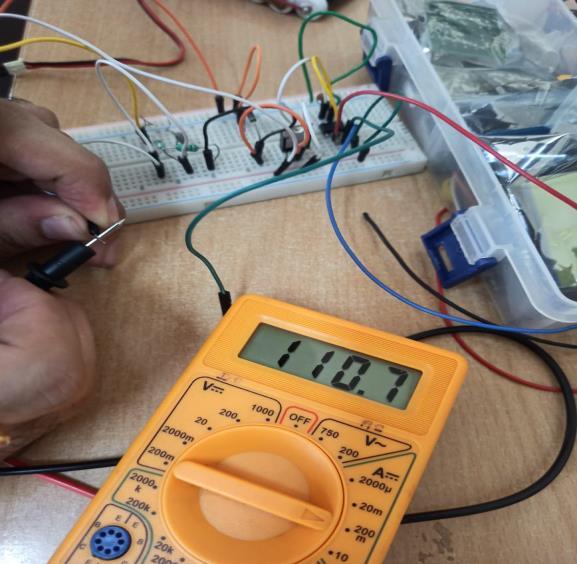
Figure 6 Displays the DC Current measured using the MultimeteraftertheDC-DCConversion.
This research focuses on energy harvesters' core operation, dominance, and analysis. The most straightforward way to turn out energy is to use water flow.Instead,theoutputpowersuppliedbythesystemis low in comparison to the capabilities of the instrumentality used in the system. The system, on the otherhand,reliedonalarge-scaleelectricalgeneratorto providethehighestvoltage(24VDC).Thisproject,which uses water as its primary source of energy, is able to createanenergycollectionsystemthatisbothcleanand promising in terms of supply. It is being used to replace generators to generate energy since it has numerous advantages and is simple to deploy because it provides useful data and change period measurement for users, anditcanbeaccessedatanytimeandfromanylocation. Anotherimprovementthatwillbemadetotheprojectin thefutureistheuseofalargerelectricalgeneratortoget more power, Because the generator used in this project willonlyproduceamaximumoutputvoltageof16volts, thepowerwillbelimitedandwillnotbeabletosupport a heavier load. Finally, using the battery as a direct connection to the Arduino's capability for this purpose mayresultinotherconcernssuchastherequirementfor regular battery replacement and the possibility of electrical shocks as a result of water leaks. As a result, with a few recommendations and alternatives, the systemmaybebuiltandimprovedinasafersetting.
[1] Hui Fang, Liew & Abd Rahim, Rosemizi & Fahmi, M Izuan & Nuraidah, M. (2021). Development of Water Pipelines Energy Harvesting System. Journal of
Physics: Conference Series. 1793. 012041. 10.1088/1742-6596/1793/1/012041.
[2] Casini M 2015 Harvesting energy from in-pipe hydro systems at urban and building scale International Journal of Smart Grid and Clean Energy. 4 pp316-327
[3] Ye G and Soga K 2012 Energy harvesting from water distribution systems. Journal of Energy Engineering.1381pp7-17
[4] Alhejji, A., Kuriqi, A., Jurasz, J., & Abo-Elyousr, F. K. (2021). Energy Harvesting and Water Saving in Arid Regions via Solar PV Accommodation in Irrigation Canals.Energies,14(9),2620.doi:10.3390/en14092620
[5] ] Shukla, H., Desai, H., Sorber, J., & Piratla, K. R. (2018). Evaluation of Energy Harvesting Potential in Water Pipelines to Power Sustainable Monitoring Systems. Construction ResearchCongress2018. doi:10.1061/9780784481295.047
[6] D. Vinko, "Power management circuit for energy harvesting applications with zero-power charging phase," 2017 40th International Convention on InformationandCommunicationTechnology,Electronics and Microelectronics (MIPRO), 2017, pp. 158-161, doi: 10.23919/MIPRO.2017.7973409.
[7]Eshra,N.M.;Zobaa,A.F.;Aleem,S.H.A. Assessment of mini and micro hydropower potential inEgypt:Multicriteriaanalysis.EnergyRep.2021,7,81–94
[8]RahmatRF,SatriaIS,SiregarBandBudiartoR2016 Water pipeline monitoring and leak detection using flow liquid meter sensor. In International Conference on Electrical Engineering, Computer Science and Informatics(EECSI)1901p.012036
[9] Hoffmann D, Willmann A, Göpfert R, Becker P, Folkmer B and Manoli Y 2013 Energy harvesting from fluid flow in water pipelines for smart metering applications. In Journal of Physics: Conference Series. 4761pp2104-2110
[10]J. A. Paradiso and T. Starner, “Energy scavenging for mobile and wireless electronics,” IEEE Pervasive Computing,vol.4,no.1,pp.18–27,Jan.2005