
International Research Journal of Engineering and Technology (IRJET) e-ISSN: 2395-0056
Volume: 11 Issue: 04 | Apr 2024 www.irjet.net p-ISSN: 2395-0072
International Research Journal of Engineering and Technology (IRJET) e-ISSN: 2395-0056
Volume: 11 Issue: 04 | Apr 2024 www.irjet.net p-ISSN: 2395-0072
Nitin Sawalkar1 , Siddhesh Date2 , Siddhi Salunke3
1Assistant Professor, Dept. of Civil Engineering, VIIT, Pune, Maharashtra, India
2Student, Dept. of Civil Engineering, VIIT, Pune, Maharashtra, India
3Student, Dept. of Civil Engineering, VIIT, Pune, Maharashtra, India
Abstract - Climate change describes the changes into the behavior of climate that may be extended for a period of decade or longer. Its impact on the environment is devastating if the same trend of carbon emission is followed (IPCC 2021). Therefore it necessitates finding out the effect of climate change in future, certainly 30 years in future. Climatic models such as General Circulation Models (GCMs) are used to check this impact on the ocean. Dissolved Oxygen is one of the most important parameter which decides the pollution level of the water. Water quality along the coast line of major cities across the world is at its worst due to the addition of unwanted pollutants to the sea water. Therefore in the present study it is proposed to assess the quality of ocean water by checking the Dissolved Oxygen (DO) Concentration. The general circulation models used for this study are taken from CMIP5 and CMIP6 projects. CanESM5 and NCAR CESM1-1-CAM5-CMIP5 models for hind-cast period of 1980-2010 and 2017-2027 respectively have been used for this study.
Key Words: IPCC, General Circulation Models (GCMs) , Dissolved Oxygen, CMIP5 and CMIP6
TheIntergovernmentalPanelonClimateChange(IPCC)isan intergovernmentalbodyoftheUnitedNations.Itsjobisto advancescientificknowledgeaboutclimatechangecaused byhumanactivities.TheWorldMeteorologicalOrganization (WMO)andtheUnitedNationsEnvironmentprogrammed (UNEP)establishedtheIPCCin1988.
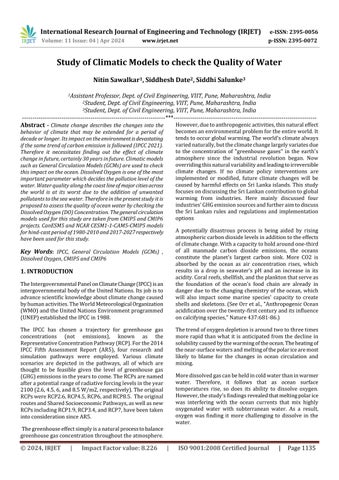
The IPCC has chosen a trajectory for greenhouse gas concentrations (not emissions), known as the RepresentativeConcentrationPathway(RCP).Forthe2014 IPCC Fifth Assessment Report (AR5), four research and simulation pathways were employed. Various climate scenarios are depicted in the pathways, all of which are thought to be feasible given the level of greenhouse gas (GHG)emissionsintheyearstocome.TheRCPsarenamed afterapotentialrangeofradiativeforcinglevelsintheyear 2100(2.6,4.5,6,and8.5W/m2,respectively).Theoriginal RCPswereRCP2.6,RCP4.5,RCP6,andRCP8.5. Theoriginal routesandSharedSocioeconomicPathways,aswellasnew RCPsincludingRCP1.9,RCP3.4,andRCP7,havebeentaken intoconsiderationsinceAR5.
Thegreenhouseeffectsimplyisanaturalprocesstobalance greenhousegasconcentrationthroughouttheatmosphere.
However,duetoanthropogenicactivities,thisnaturaleffect becomesanenvironmentalproblemfortheentireworld.It tendstooccurglobalwarming.Theworld'sclimatealways variednaturally,buttheclimatechangelargelyvariatesdue to the concentration of "greenhouse gases" in the earth's atmosphere since the industrial revolution began. Now overridingthisnaturalvariabilityandleadingtoirreversible climate changes. If no climate policy interventions are implemented or modified, future climate changes will be causedbyharmful effectsonSriLanka islands.Thisstudy focusesondiscussingtheSriLankancontributiontoglobal warming from industries. Here mainly discussed four industries'GHGemissionsourcesandfurtheraimtodiscuss the Sri Lankan rules and regulations and implementation options
A potentially disastrous process is being aided by rising atmosphericcarbondioxidelevelsinadditiontotheeffects ofclimatechange.Withacapacitytoholdaroundone-third of all manmade carbon dioxide emissions, the oceans constitute the planet's largest carbon sink. More CO2 is absorbed by the ocean as air concentration rises, which results in a drop in seawater's pH and an increase in its acidity.Coralreefs,shellfish,andtheplanktonthatserveas the foundation of the ocean's food chain are already in dangerduetothechanging chemistry oftheocean, which will also impact some marine species' capacity to create shellsandskeletons.(SeeOrretal.,"AnthropogenicOcean acidificationoverthetwenty-firstcenturyanditsinfluence oncalcifyingspecies,"Nature437:681-86.)
Thetrendofoxygendepletionisaroundtwotothreetimes more rapid than what itis anticipated fromthe decline in solubilitycausedbythewarmingoftheocean.Theheatingof thenear-surfacewatersandmeltingofthepolaricearemost likely to blame for the changes in ocean circulation and mixing.
Moredissolvedgascanbeheldincoldwaterthaninwarmer water. Therefore, it follows that as ocean surface temperatures rise, so does its ability to dissolve oxygen. However,thestudy'sfindingsrevealedthatmeltingpolarice was interfering with the ocean currents that mix highly oxygenated water with subterranean water. As a result, oxygen was finding it more challenging to dissolve in the water.
International Research Journal of Engineering and Technology (IRJET) e-ISSN: 2395-0056
Volume: 11 Issue: 04 | Apr 2024 www.irjet.net p-ISSN: 2395-0072
GCM stands for “General circulation model”. General circulation model is one of the most important tools in climatescience.Whatifyouknowaboutourfutureclimateis based on this model soitis important to understandhow they are made, how they are tested & how they are used. Modelsareessentialtoolsinscience,itallowstousedatato makepredictionsaboutprocessesthatcandirectlymeasure such as, things shall happen in future or things were happened in the past. GCM are built on well understood physical principles, they use complex map and computer algorithmstopredicthowenergyandmatterinteract.GCM aretemporalmodelsmeaningthattheywhopredictchanges urbantime.Timeintervalcanvaryyeartoyearortominute to minute. For the small interval the prediction should be more precise. GCM are also special model because they predictconditionsonallareasoftheplan,gridsize isvery important. The smaller the grid size the more precise predictionforgivenlocation.GCMsarealsohasprobabilistic meaningthatthepredictedoutcomescomefromthemodels areassociatedwithapercentlikelyheardagainheardright. In general, the better the data to a government model the moreaccuratethemodelwillbe.Themostadvancedtools nowavailableforpredictinghowtheglobalclimatesystem will respond to rising greenhouse gas concentrations are generalcirculationmodels(GCMs),whichsimulatephysical processes in the atmosphere, ocean, cryosphere, and land surface.
1.2 CMIP5 (Coupled Model Intercomparison Project Phase 5)
It is a comprehensive set of experiments created by the World Climate Research Programme’s working group on coupledmodelling.NumbersofGCMsareavailableonthis site. Thismethodologyenablesabroadgroupofscientiststo approachthesystematicanalysisofGCMs.CMIP5ismeantto provide a framework for coordinated climate change experimentsforthenextfiveyears.
1.3 CMIP6 (Coupled Model Intercomparison Project Phase 6)
CMIP6 is the upgraded version of CMIP5. It is a comprehensive set of experiments created by the World ClimateResearchProgramme’sworkinggrouponcoupled modelling In terms of the number of modelling groups involved, the number of potential future scenarios considered,andthenumberofvariousexperimentscarried out, CMIP6 represents a significant improvement over CMIP5. A set of common simulations are created by CMIP andthenexecutedoneachmodel.
An international organization under the United Nations is theIntergovernmentalPanelonClimateChange.Itsroleisto
increasescientificunderstandingofhowhumanactivityis causing climate change. Every year the working group of peoplepublishesthereportonclimatechange.
RCP means Representative Concentration Pathway. One mustforecastourbehaviorinordertounderstandhowour climate could alter in the future. In RCPs, a wide range of potential climate change-related problems are described, including greenhouse gases, air pollutants, emissions, and land use. In a number of ways, RCPs have made history. Some of the greatest and lowest greenhouse gas emission scenarioslatelyexploredbythefieldofclimatescienceare included in them. Unlike the Special Report of Emission Scenarios (SRES), which focuses solely on a no-climatechangestrategy,theycontainscenariosthatmitigateclimate change. Fig1 shows the Representative Concentration Pathwaywiththeemission.
The extreme literature survey has been done on the summaryofpreviousresearchonGeneralCirculationModel Through this it has been found the different parameters whichareusedinGCM.
R.L.Wilbyet.al(1998)evaluatedtheStatisticaldownscaling ofgeneralcirculationmodeloutputwhichhastheObjective asfourstatisticaldownscalingmethodswereappliedtothe CMIP6GCMtoexecutethedifferentstatisticaldownscaling by given data. There were many GCM models, major is HadCM2generalcirculationmodel,alsothereare2artificial neuralnetworkapproachesANN1,ANN2whereANN2was majorlyusedbecauseitwastemperaturepredictor.Other twomethodswerebasedonairflow(B-CircandC-Circ).So these downscaling are calibrated using data prediction method. And these methods exhibited the greatest proportional changes at the sites. The results were compared by GCM-derived predictor variables and by standardsetsusingastandardsuiteofdiagnosticstatistic. Once the downscaling methods are evaluated, the future projections for the drought-related indicators are derived from the methods. D. A. Sachindra, F et.al (2014) have
International Research Journal of Engineering and Technology (IRJET) e-ISSN: 2395-0056
Volume: 11 Issue: 04 | Apr 2024 www.irjet.net p-ISSN: 2395-0072
workedontheStatisticaldownscalingofgeneralcirculation modeloutputstocatchmentscalehydroclimaticvariables: issues, challenges and possible solutions which have displayed the Outputs of a downscaling study mainly dependent on quality and length of the record of field observations.AsitisobservedthatGreenhouseGases(GHG) are increasing which can cause anthropogenic climate change.InfuturethedataofGHGandothergasesemission scenariosisobservedsoitneededtodownscalethedatain regionalmannersoRCMisthefactorusedtodownscaledata regionally. The uncertainties that are observed to the outputs of a statistical downscaling study due to different statisticaldownscalingtechniquesarelessincomparisonto the uncertainties arising from GCMs and greenhouse gas emissionscenarios.Statisticaldownscalingstudyshouldbe usedasindicationsratherthanexactpredictions.
Andrew D. Polasky et.al (2022) looked over the CC downscalingwhichwasanopen-sourcePythonpackagefor multivariablestatisticalclimatemodeldownscalingV1.0So Itismethodforobtaininghigh-resolutionclimateorclimate changeinformation.Astheclimatechangeinformationtends to grow so to downscale this data there are some applications for this like CC downscaling package that provides number of downscaling methods. It is an opensourceframework,thecodeiscreatedtoaccommodatenew methods for future users. The code is basically written in pythonlanguageasitiswidelyusedinboththeAtmospheric ScienceandMachineLearningcommunities.Ithasseveral methods and metrics for evaluating the skill on several variablesimportantfordifferentdownscalingapplications. UsingSelf-OrganizingMaps(SOM)soitcanbeexaminedthe projectedimpactsofclimatechange.SOMmethodincludes twoparticulartrainingmetricsquantizationandtopological error. SecondusedisScikit-Learn whichdevelop machine learning-baseddownscalingmodelstodetermineimpactsof atmosphericwarmingonregionalweather90andclimatic conditions. The analytical solution of the model is found acceleratingneedforpredictableandhighlylocalizeddata for climate change scenarios led to the development of software. Jolene Cook et.al (2022) at EPSRC were always readytodedicatetimeandenergytotheneedsoftheteam. BEISalsoorganizedthevenuehostingthecoreteamforthe 14thSessionofIPCCWGIII.MitigationofClimateChangeis foundtobethethirdsectionoftheIntergovernmentalPanel on Climate Change (IPCC) Sixth Assessment Report (AR6) anditwascreatedbyWorkingGroupIII.Thereportpresents anup-to-dateassessmentofworldwideemissionsfromall sourcesandindustries,whichincludesactualandprojected levels. Mitigation tactics used to reduce emissions and remove greenhouse gases from the atmosphere, and advancements in achieving climate goals. Three guiding principlesservedasthebasisfortheWGIIIcontributionto AR6thatimprovedthesynthesisbetweenhigher-leveland bottom-upinsightsintotechnologiesandotherforreducing emissions;theyusedsocialsciencedisciplinesmorebroadly, mainly for gaining insight into problems of lifestyle,
behavior, consumption for better connect climate change mitigationtootherfieldsofstudy.
BrysonBatesandZbyszekKundzewicz(2008)havefound thatnumberofchangesinthelarge-scalehydrologicalcycle, includes the increase in atmospheric water in amount of vaporcontent,alteredprecipitationpatterns,intensities,and extremes,decreasedsnowcoverandwidespreadicemelting, and adjustments to soil moisture and runoff, it have been linkedtoobservedwarmingoverthepastseveraldecades. Freshwater resources are found to be in danger of being severelyimpactedbyclimatechange.Theabilitytopredict futurechangesinhydrologicalvariablesandtheirimpactson systems and sectors is constrained by uncertainty at all stagesoftheassessmentprocess.Uncertaintyisinfluenced by a number of factors, like the range of socioeconomic development possibilities, the range of climate model forecastsforaspecificscenario,thedownscalingofclimate effectstolocalandregionalscales,impactsassessments,and feedback from adaptation and mitigation efforts. M. A. Chamberlain1 et.al (2012) presented a study ofBoundary currents and eddies which are examples of ocean characteristicsthatarecurrentlyresolvedbyglobalclimate modelsusedforprojectclimatechange.Thathasaccurately forecastedthemarineimplicationsofclimatechange.Ocean modelbaselineconditionsandsurfacefluxeswerecombined withclimatechangetocreateatime-slicepredictionforthe ocean in the year 2060. Here, the downscaling model is ocean-onlyanddoesnottakeintoaccounthowchangesin thestateoftheoceanwillaffecttheatmosphereandair-sea fluxes.Tosimulatereal-oceanfeedbackonheatandmaintain steadysalinity,ithasbeenstatedto userestorationofthe seasurfacetemperatureandsalinity.
Daisuke Kozaki et.al (2017) have Determined the Water Quality Degradation Due to Industrial and Household WastewaterintheGalingRiverinKuantanwhichhavethe westernsideoftheGalingRiverhadhigherlevelsofhuman activity,includinganinfluxofcommercial,residential,and untreated raw sewage effluent, and recorded lower class levelsthantheeasternsideintermsofammoniacalnitrogen, COD,andDO.Tounderstandtheinfluenceofthesourceon water quality, studies have monitored both typical parameters and heavy metal species in industrial, raw sewage, and domestic wastewaters that have discharged from all areas of the Galing River basin area. It is been recommended to look into the evaluation of the water qualitydatausingspecificKuantancitystatistics(business type, population of each lot, etc.). Additionally, it is vitally crucialtobuildanewwatertreatmentplant,sewagesystem, and thoroughly examine industrial wastes in the western part of the Galing River basin area. B. B. Cael et.al (2022) have demonstrated that how ocean colour measured by remotesensingreflectanceexhibitsamorerapidemergence ofclimatechangetrendsduetoitsmultimodalnatureand the low inter annual variability of specific wavebands. Followingsamplecollection,DOwaslocallymeasuredusing
International Research Journal of Engineering and Technology (IRJET) e-ISSN: 2395-0056
Volume: 11 Issue: 04 | Apr 2024 www.irjet.net p-ISSN: 2395-0072
aportableDOmeter.Afterthesampleswerecollected,the pH values were determined in the lab using a desktop pH meter.AUV-visibledetectorwasusedtocalculateCOD.
Inaridandsemi-aridnationsliketheUnitedArabEmirates, the future projection of air temperature and precipitation duetoclimatechangehasasignificantimpactonhowwater resourcesmanagementstrategiesaredeveloped(UAE)have been studied by Abubaker El Hakeem et.al (2015) .The outputs of the coarse global circulation models (ocean atmosphere global climate models, or OAGCMs) typically understatetheimpactoflocaltopography,landuse,andsea land differences. To enhance future forecasts, statistical downscaling(SD)linksandOAGCMoutputs(predictors)are foundtobemorepreciselocalobservedweatherdata.The HadleyModel(HadCM3)predictorsaredownscaledinthis studyusinglocalobservationsattwostationsthatreflectthe main bioclimatic zones in the UAE. The article suggests a thorough and organized process to direct the choice of dominatingpredictorsinthesuggestedmethodologyisused fortheUAE,howeveritiseasilyadaptabletootherregions. By2080atthestudiedstations,thecalibratedmodel,which wasusedtoestimatefuturescenariosinthearea,showeda rangeofincreasesinannual meanmaximumtemperature andarangeofdecreasesinannualprecipitation.Inlightof therevisedpredictionsfortemperatureandprecipitation, the effects of climate change on the management of the UAE's water resources are examined. The impacts of temperature are particularly substantial because a significant portion of the water resources are used for agriculture. At the national level, however, the effects of precipitation are rarely noticeable. The effects of less precipitation,however,willhaveamorelocalizedinfluence on mountainous areas that are critically dependent on precipitationforwaterresources.
This present study consists of parameter named O2 (Dissolved Oxygen concentration). So the data has been taken from CMIP 5 and CMIP6 sites. Table 1 shows the detailsabouttheGCMdownloadedfromIPCCModelIDs.
Table1.GCMDownloaded
Title IPCC MODEL ID PRIMARY REFERENCE
CCCma CanESM5 model output prepared for CMIP6 DCPP dcppA-hindcast (1980-2010)
NCAR CESM1-1CAM5-CMIP5 model output prepared for CMIP6 DCPP dcppA-hindcast (2017-2027)
CCCmaCanESM5 Sospedra-Alfonso, Reinel; Lee, WooSung; Merryfield,WilliamJ. etal.(2019)
NCARCESM1 Danabasoglu, Gokhan(2019)
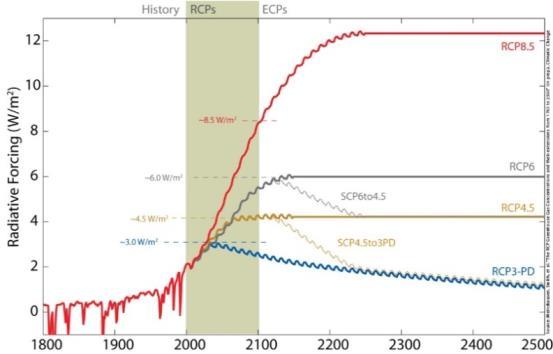
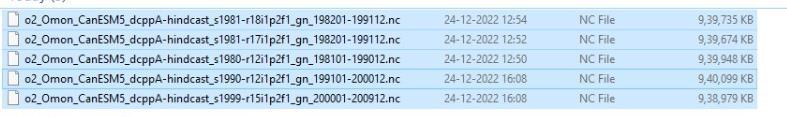
TheGeneralcirculationmodelhasbeendowndoadedfrom CMIP6 and CMIP5 site for the O2 (Dissolved Oxygen concentration).ThedownloadedGCMfileshavebeengiven inthefig2below.
5. USE OF DOWNLOADED GCM
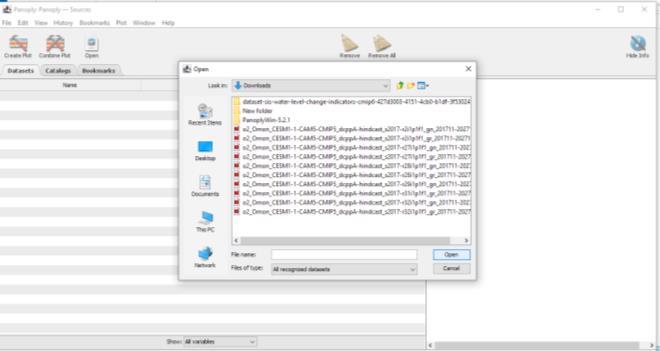
TheGCMthathavedownloadedusedfortheanalysisofO2 (Dissolved Oxygen Concentration) from the ocean by the helpofdownscalingmethodsforthepredictionofO2levelin water from the ocean. This data helps to study climate changeimpactonwaterduetoriseinwaterpollution.This downloadedGCMsareneedtoextractforthefurtherstudies byusingextractingtools.ThePanoplytool(Fig3)whichhas developedbyNASAhasusedforextractionoftheGCMsfrom .NCfileformattotextorcsv
International Research Journal of Engineering and Technology (IRJET) e-ISSN: 2395-0056
Volume: 11 Issue: 04 | Apr 2024 www.irjet.net p-ISSN: 2395-0072
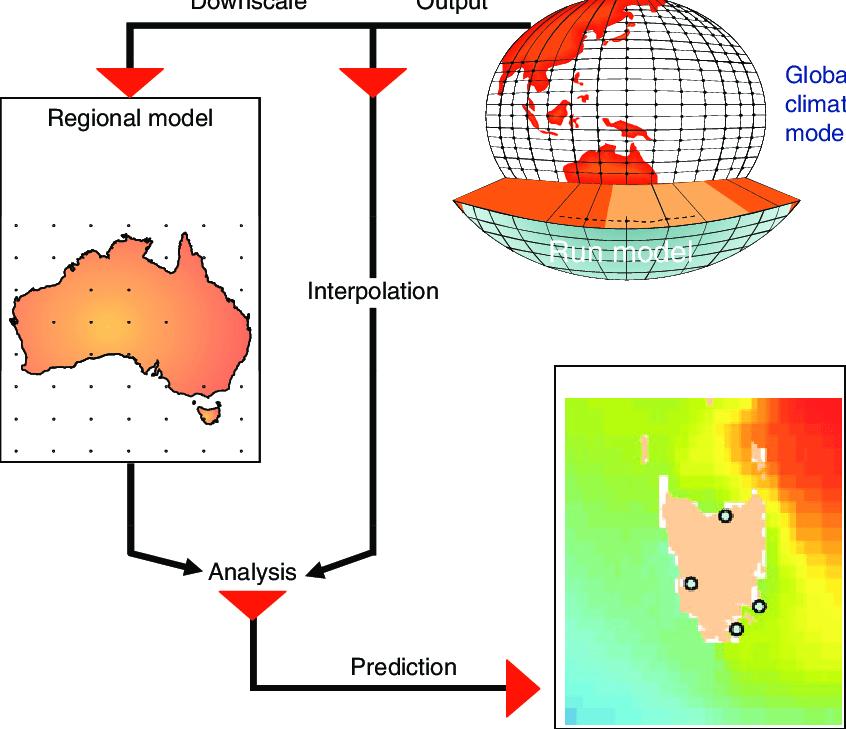
High-resolutionclimateorclimatechangeinformationcan beobtainedbydownscalingfromGeneralCirculationModels with comparatively low resolution. For the GCM file Downscaling is the important stage to focus on particular region from the globally collected data. From the downscalingmethodgottheproperreadingsforourregion for the study. Downscaling can be done by the various methods like Statistical Downscaling and Dynamic Downscaling. Fig4. Show the downscaling from Global ClimateModel.
StatisticalDownscaling:SimplemethodforDownscalethe GCM extracted files to give accurate readings or data. The statisticaldownscalingapproachusestatisticalregressions fortranslation.Suchtechniquescanbeassimpleasmultiple regressions,whichconnectlocal variablestospecific GCM drivers,orassophisticatedassupportvectormachinesand neural networks, which use multilayer, input-output configurations.
This method, sometimes referred to as empirical downscaling,ismostlydatadriven.Ingeneral,theprocess starts with determining the connection between global factorsandregionalclimaticconditions.Oncethislinkhas been established for the present, it may be used to future predictions.TheStatisticalDownscalingdonewithsoftware likeANN,MATLAB,PYTHON,etc.
DynamicDownscaling:Itisanothermethodofdownscaling ofGCM.ThisistheAdvancelevelofDownscalingmethod.It needs high-level supercomputer or massively parallel computerforthehigh-resolutionclimatechangedata.
Fromthisstudyithasbeenacknowledgedthathowclimatic change affects the water quality especially in the oceanic regions. There is a major importance of the general circulationmodel(GCM)becauseitplayedanimportantrole that how it has affected the water quality and climatic change. It has found that the number of GCM's used, the parameters are affecting the climatic and oceanic regions. Majorly the parameter that have used is DO (Dissolved Oxygen)whichcauseFishandotheraquaticspeciesdepend onittosurvive.Asthewastewaterfromthevariousparts enteringintotheoceanstheFishandotheraquaticspecies cannotsurvivewhenthedissolvedoxygenlevelistoolow.
AlongwithDOotherparametersarealsoimportantbuthere mainlyheretheconcerned aboutDOasBODandCOD are directlyconnectedwithDO.WhilesearchingtheGCMmodels ithasbeenfoundthatmanymodelswhicharebasedonDO variable from CMIP5 and CMIP6 sites. These sites informationisbeendisplayedinthepreviouspartsofour report.
From this study one can go for Statistical Downscaling technique as that of the dynamic downscaling technique becauseStatisticaldownscalingtechniquescanbeusedfor much higher resolutions, up to station-scale, and are computationally cheap and much faster than dynamical downscaling techniques. As it has also found out that statisticaldownscalinghasagainmajorareainthefieldof ANN, MATLAB and also by using Python Code that can downscale the data that have been collected globally to regionalarea.
[1] R. L. Wilby., T. M. L. Wigley., D. Conway., P. D. Jones., (1998)."Statisticaldownscalingofgeneralcirculationmodel output"34,11,2995-3008.
[2]D.A.Sachindra.,F.Huang.,A.BartonandB.J.C.Perera., (2014)"Statisticaldownscalingofgeneralcirculationmodel
International Research Journal of Engineering and Technology (IRJET) e-ISSN: 2395-0056
Volume: 11 Issue: 04 | Apr 2024 www.irjet.net p-ISSN: 2395-0072
outputstocatchmentscalehydroclimaticvariables:issues, challengesandpossiblesolutions"
[3] Daisuke Kozaki., Norhasmira Idayu Binti Harun., and MohdHasbiBinAb.Rahim(2017)"DeterminationofWater Quality Degradation Due to Industrial and Household WastewaterintheGalingRiverinKuantan",4,35,10-3390
[4]B.B.Cael1.,KelseyBisson2.,EmmanuelBoss3.,Stephanie Dutkiewicz4.,andStephanieHenson1(2022)"Globalclimate changetrendsdetectedinindicatorsofoceanecology"
[5] Andrew D. Polasky1., Jenni L. Evans., and Jose D. Fuentes1.,(2022)"CCdownscaling:anopen-sourcePython package for multivariable statistical climate model downscalingV1.0"