
Volume: 11 Issue: 04 | Apr 2024 www.irjet.net p-ISSN:2395-0072
Volume: 11 Issue: 04 | Apr 2024 www.irjet.net p-ISSN:2395-0072
A Leelavathi1 , G Sri Jaya Sairam 2 , G Rishitha3 , V venkat4 , SH Thahira5 , D Harika Poorna6
1Sr.Asst Prof., CSE Dept, Sri Vasavi Engineering College, Tadepalligudem. 2,3,4,5,6Student, CSE Dept, Sri Vasavi Engineering College, Tadepalligudem, A.P., India
Abstract
Stock Market forecasting is becoming popular. It aids investorsinreaching informed decisions. Todetermine thestockprice,severalforecastingapproachesareused, including time series analysis, statistical analysis, technical analysis, and fundamental analysis. Stock forecasts are regarded to be extremely difficult in light ofvolatilityofthestock market.Atvariousperiods,the stock market moves in both directions. Since machine learning is essential for stock market predictions, it contains a big amount of data that may be used. To depictdataintabularform,Usingmachinelearningand a Python framework, we can generate dynamic visualizations of a company's financial data. Investors and traders benefit from stock forecasting and visualizing techniques to manage the stock market. In order to accurately estimate the stock values of a certain firm, the forecasting model must be highly precise. This internet program may be used by any businesstoexamineuseraccess.
Keywords:
SVM (Support Vector Machine) algorithm, forecasting, visualization
I. Introduction
Making judgments is essential for traders in the financial industry. Two essential tools that uses investors and financial analysts are visualization and forecastingofstocks.Thesetechniqueshelpindividuals and organizations gain knowledge about the stocks, assessmarkettrends,andmakeinvestmentdecisions.
Visualization of stocks refers uses the graphical and charting techniques to represent and analyze historical andreal-timestockmarket andinterpretfinancialdata related to a particular company's or market's performance. Visualizations can take the form of line charts, candlestick charts, bar charts, and more to represent stock price movements. These visual representations make it easier for analysts and investors to identify patterns, trends in stock prices.
The technique of projecting future stock prices and market trends using historical data, mathematical models,andstatisticalmethodologiesisknownasstock forecasting. It is essential to the decision-making process for traders, investors, and financial analysts. Theyusewiderangeoftheoriesandtechniques,likeas time series analysis, fundamental analysis, technical analysis, and machine learning algorithms, to forecast stocks.
Stock market's fundamental characteristic is unpredictability. Through the usage of data analytics, machinelearning, visualizationtechniques,thisproject seekstogivehistoricalstockpricepatternsandforecast future price movements. Financial experts must be willing to do predict which will increase or decrease overagivenlengthoftime
Understanding the methods, approaches, and approaches now employed in terms of stock price forecasting and visualization requires a thorough reviewoftheliterature.
[1] Elijah Joseph suggested a Research in 2019 that willusetheSupportVectorMachine(SVM)approachto estimate near stock market movements. He concludes that fine-grained Gaussian, cubic, linear, and quadratic models on stock price forecasting may be enhanced withapplicationofSVM.170daysweredividedinto51 testingand119trainingdatasets.Forprojectingfuture stock values, Model predictions are compared to actual prices.
[1]In2017,HakobGrigoryansuggesteddoingresearch on support vector machines and variable selection techniques based on SVM algorithms for identifying market trends. He came to the conclusion that To test the effectiveness of several trials had been suggested integratedmodel andtocontrast theresults ,the model thatjustreliedonSVMtechnique.
[1][2] A study on the SVM algorithm-based method to Support vector machines can be hep to predict stock
International Research Journal of Engineering and Technology (IRJET) e-ISSN:2395-0056
Volume: 11 Issue: 04 | Apr 2024 www.irjet.net p-ISSN:2395-0072
priceswasproposedby Naliniprava Tripathy in2019 Hecametotheconclusionthat, amarketvolatileasthe Indianstockmarket,theSVMmodelisadvantageousfor both investors and regulators. Future research may look at additional The interest rates, and foreign exchange rates are macroeconomic factors that have a bigimpactonstockmarket.
[2]In 2019, Jagruthi Hota presented a research paper on machine learning and methods for predicting stock market i.e, SVM and the Random Forest algorithm. He went on to say that the Project aims to help stock marketinvestorsbyassessingAmericanAirlinesstocks using four machine learning algorithms. The Random Forest and Artificial Neural Network had the lowest MAPE values (0.36 and 0.37), showing potential advances through the employment of advanced ANN evolutionarytechniques.
[3][4]GaurangSonkavdepresenteda studythatwould makeadvantageofRandomForest,XGboost,andother machine learning and deep learning models to forecast stock market values in 2023: A comprehensive evaluation, performance analysis, and discussion of consequences. He concluded that no universal solution exists for accurate stock price prediction. Suggests enhancing models with hyperparametertuningand usingAI-basedforecastsas supplementary tools for traders and advisors. Encourages future research in portfolio management, tradingstrategies,andinvestmentdecision-making.
Data Complexity: First, compile and clean historical data on stock prices from reliable sources, such as financial databases or application programming interfaces. use libraries like Pandas in Python to manage and preprocess the data. You may need to address issues like missing data, outliers, and data quality.
Pattern Identification: Utilize various data analysis and visualization techniques to identify patterns in historical stock price data. Common tools for this include moving averages, technical indicators(e.g.,MACD,RSI),and candlestick charts. Pattern recognition may also be accomplished using machine learning technologies, such as time series analysisordeeplearning(e.g.,LSTM).
Predictive Accuracy: Choose applicable machine learning algorithms, create a model, then tweak the model's hyperparameters to improve projected accuracy.MakeuseofmetricslikeMeanAbsoluteError (MAE), Mean Squared Error (MSE), or Root Mean
Square Error (RMSE) to assess performance. To evaluate the generalizability of the model, do crossvalidation.
Feature Selection: Pick pertinent aspects with care which can help you forecast changes in stock price. To help with feature selection, apply methods such as feature importance analysis, correlation analysis, and domain expertise. When necessary, further dimensionality reduction methods like as Principal ComponentAnalysis(PCA)mightbeused
Dynamic Market Conditions: Recognize that stock marketisimpactedbyawiderangeoffactors,including economic indicators, news, geopolitical events, and marketsentiment.Considerincorporatingexternaldata sources, sentiment analysis, and news sentiment analysis into your models to account for dynamic market conditions. Regularly update your models and retrainthemtoadapttochangingmarketdynamics.
1.Data Collection and Preprocessing:
Data Sources: Find and use trustworthy data sources tolearnabout stock market. Thismayincludeprevious stock price data, financial statements, news feeds, and economic indicators. Consider using APIs or scraping datafromfinancialwebsites.
Data Cleaning: When necessary, further dimensionality reduction methods like as Principal Component Analysis (PCA) might be used. For data cleaning and manipulation, you may want to utilize programslikePandasorNumPy.
Data Storage: Organize and store the data efficiently, possibly in a database or data warehouse, to enable quickaccessandretrieval.
2.Visualization Module:
Data Visualization : Developa visualizationmodule to help users understand market trends and data patterns. Utilize libraries like Matplotlib, Plotly. JavaScripttogeneratedynamicgraphsandcharts.
Key Visualizations: Toshowstockpricedata,technical indicators,andotherpertinentinformation,thinkabout using heatmaps, line charts, bar charts, and candlestick charts.
Interactive Features: Allowusers to customizecharts, change time frames, and overlay various technical indicatorsforamorecomprehensiveanalysis.
3.Pattern Recognition:
Implement Algorithms: Utilize machine learning or statistical algorithms for pattern recognition in stock pricedata.Fortimeseriesanalysis,commontechniques
International Research Journal of Engineering and Technology (IRJET) e-ISSN:2395-0056
Volume: 11 Issue: 04 | Apr 2024 www.irjet.net p-ISSN:2395-0072
include RSI, Bollinger Bands, MACD, moving averages, andmachinelearningmodelslikeLSTM.
Real-time Analysis: Incorporate real-time data analysis to identify patterns and trends as they occur, enablingtimelydecision-makingfortraders.
4.User Interface:
Design: Create an intuitive and user-friendly interface that allows investors and traders to interact with the system easily. Pay attention to the design concepts for userexperience(UX).
Features: Include features like search functions, customizabledashboards,newsfeeds,andalerts. When particularcircumstancesaresatisfied,usersoughttobe allowedtochoosethecriteriafornotifications.
User Profiles: Consider allowing users to create profiles,savepreferences,andtracktheirportfoliosand tradinghistory.
1.Decision Making: Visualization and forecasting provide information to make decisions. Investors and tradersusethesetoolstoassessthepotentialrisksand returnsofvariousstockinvestments,helpthemtobuy, sellandholdthestock.
2. Identifying Trends: The purpose of visualizing historical stock price data is to make it easier to see patternsandtrendsthatcanguidetradingdecisions.
3.Risk Management: Visualization and forecasts help identify risk associate with stock investments. It analyzing historical drawdowns and estimating the potential downside of a stock which is crucial for risk mitigation.
4.Education and Research: Techniques for predicting and visualization are also beneficial for research and teaching. They make it possible for traders and investors to examine past market data and learn about thebehaviorofthemarket.
Requirements Gathering: Understand the project scope,objectivesandstakeholder’sneeds
System Design: Define the system architecture, includingthefrontend,thebackend,andthedatabases. Organize the database so that historical data, user profiles,andforecastsarestored.
Predictive Modeling: Create machine learning models toestimatefuturestockpricefluctuations.
Tests and Quality Control: Perform unit, integration, andend-to-endtestingtoensure functionalityanddata quality.
Installation: Install the program on the platform for hosting
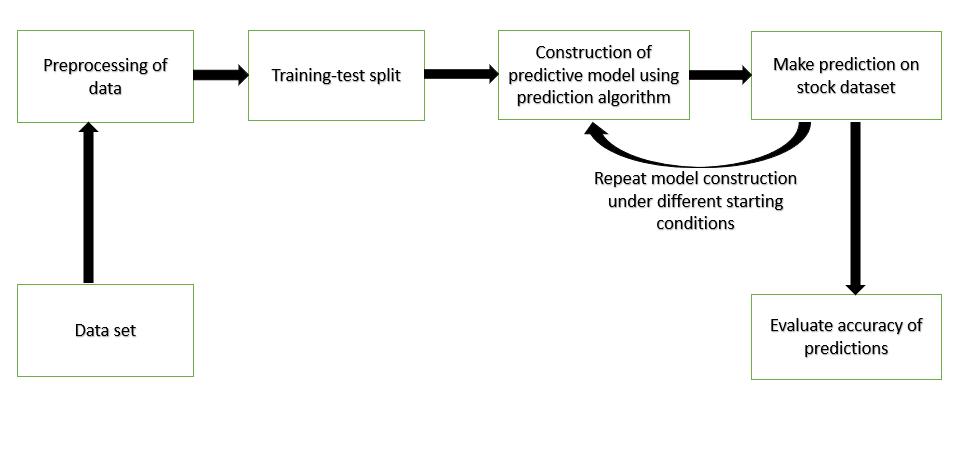
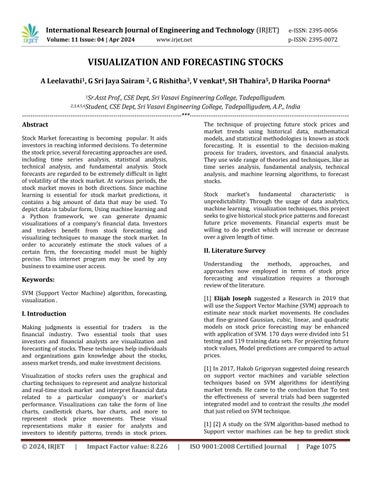
Fig.1.displaysthesystem'sarchitecture.
Data Selection: Thefirststepistochoosethedatathat theorganizationwilluseanddivideitintotrainingand testing data. 75% of the resources were used for instruction, while 25% were used for testing. We examinedseven importantstock market indexesinour research,includingtheyfinance.
Data pre-processing: During pre-processing, we choose the properties that Data pre-processing: We can select the qualities that the algorithm requires during pre-processing and discard the remainder. The selected characteristics are Trade Open, Trade High, Trade Low, Trade Close, and Trade Volume. In preprocessing, normalization is performed to get data that fallinsideacertainrange.
International Research Journal of Engineering and Technology (IRJET) e-ISSN:2395-0056
Volume: 11 Issue: 04 | Apr 2024 www.irjet.net
Training test-split: The train-test split is a technique that is used for classification or regression problems. The procedure takes the dataset and It was split into two halves. The model is trained using the training set, andtestedusingthetestingset.
SVM Algorithm: A famous machine literacy idea is the Support Vector Machine (SVM). In this study, we understand at how a Support Vector Machine predicts stock prices. It is among the most well-liked financial subfields. We feed the SVM with many widely used stockspecificpointersasinputparameters
Make prediction using stock dataset: To make predictions using a dataset, you'll need to first select a suitable algorithm, such as SVM algorithm on your specific task. After preprocessing and cleaning your dataset,modelcanusepreviousdatatotrainthechosen model.Oncetrained,themodelcanhandlethenpredict outcomes or values for new, unseen data points. This enables you to make informed decisions, forecasts, or classificationsbasedonpatterns.
Evaluation: In the evaluation phase, for the given problem the right type of model as well as the appropriateparametersforproblemischosentogetthe accurateprediction.
SVM, a widespread machine learning approach for regression and classification in a wide range of applications. SVMs have a wide range of applications, including stock predictions and visualization Support vector machines (SVMs) can aid in prediction in this visualization.SVMisableto categorizemarketcontrols according to past performance. Analyzing these categories over time can aid investors in comprehendingmarketbehaviormorerapidly.
Sector Analysis: SVM can classify sectors as strong or weakperformers.Visualizationtheseclassificationscan identify sector trends and their potential impact on stockprices.
Volatility Forecasting: SVM can forecast stock price volatility which is crucial for risk management and options trading. visualizing the predicted volatility can helptradersaboutmarketconditions.
Hyperplane Equation: SVM aims to find a hyperplane thatsplitsdatapointsintotwogroups Theequationfor a hyperplane in a two dimensional feature space is givenby
p-ISSN:2395-0072
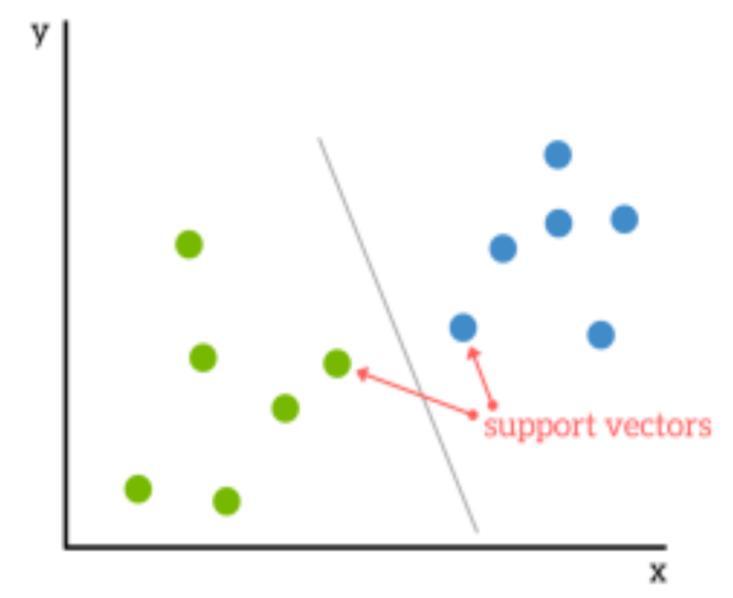
Fig.2.showsthesupportvectorsusingvariousanalysis
Fig.3.showstheOptimalHyperplaneusingSVM
IX. Results:
From the below three figures are the interfaces providedtotheusertopredictstockmarket.

Fig.4.displaysthehomepageforthestockpredictor.To forecastthestocks,wemayinputthetickernameand numberofdaysonthispage.
International Research Journal of Engineering and Technology (IRJET) e-ISSN:2395-0056
Volume: 11 Issue: 04 | Apr 2024 www.irjet.net p-ISSN:2395-0072
TICKER INFORMATION
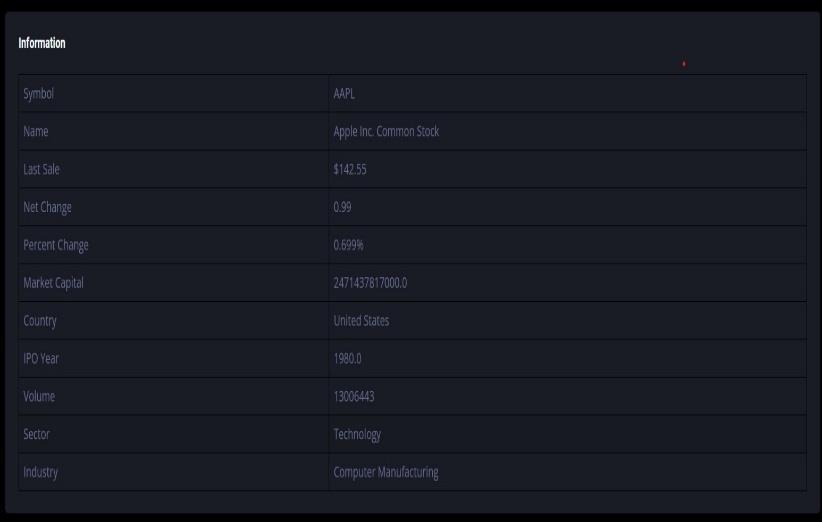
Fig.5.displaystheprecisetickernameinformationto forecastthecompany'sstock.
RESULT IS DISPLAYED
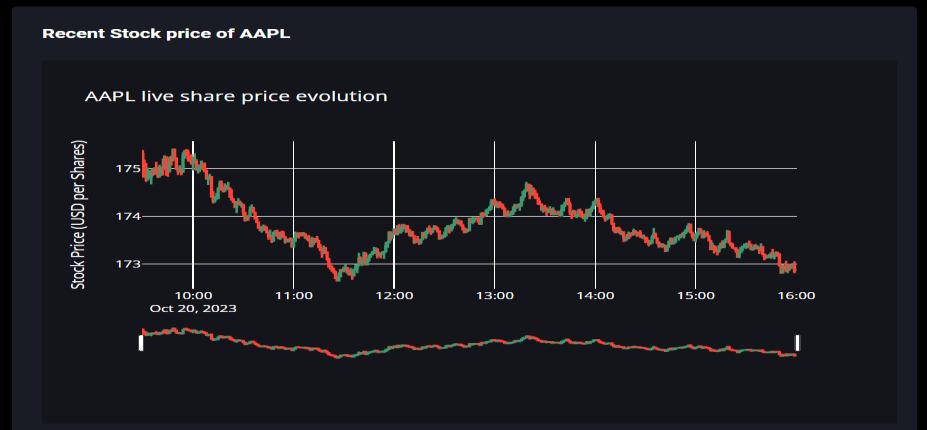
Fig.6 displaysthecompany'smostrecentstockprice.
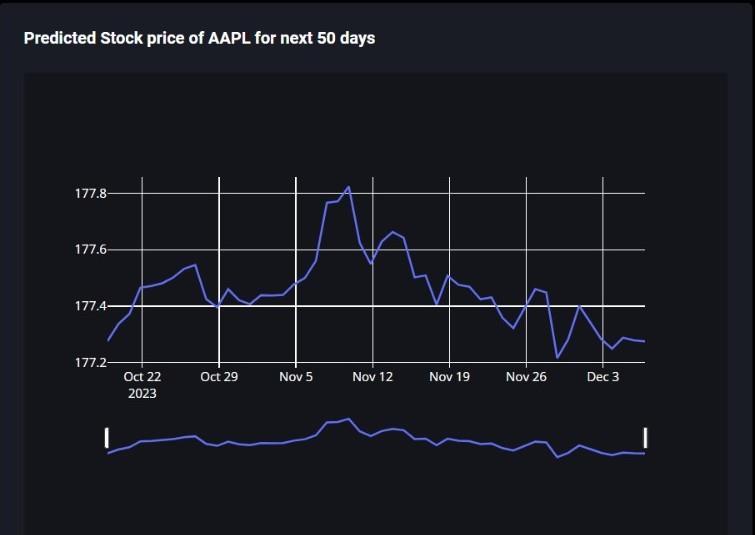
Fig.7.predictsthespecificcompany'sstockpriceforthe following50daysonthegraph.
The SVM algorithm works with a vast dataset acquired from several global financial markets. Furthermore, SVM is not affected by overfitting. Numerous known and unanticipated factors have an impact on stock values. Visualizations and the application models for predicting, we have embarked on a journey to comprehend the dynamic nature of stock markets. When combined, visualization and SVM-based forecasting can offer insightful information on the behavior, the stock market, aiding financial professionalsinmakingdecisions.
In the future, we can implement the forgot password functionality and also when the user can signup with theirmailidthenwecansentthemailfortheuser.
I would like to express my gratitude to our project guide, Mrs. A. Leelavathi, Senior Assistant Professor in the Sri Vasavi Engineering College's CSE Department, for all of her assistance and support throughout this project. Furthermore, I would want to express my gratitude for presenting us with the resources and opportunities required to do this task. I sincerely appreciatehowinspiringcommitmenthasbeen.
[1] Ashutosh Sharma, Sanket Modak and Eashwaran Sridhar, "Data Visualization and Stock Market and Prediction", International Research Journal of EngineeringandTechnology(IRJET), vol. 06, no. 09, Sep 2019.
[2] Understanding Support Vector Machine Regression, mathworks, [online] Available: https://in.mathworks.com/help/stats/understandingsupport-vector-machine-regression.html#buzowxx.
[3] M. Sathiyanarayanan and D. Pirozzi, "Linear-time diagram: A set visualisation technique for personal visualisation to understand social interactions over time", 2016 2nd International Conference on Contemporary Computing and Informatics (IC3I), pp. 259-264,2016.
[4] I. Parmar, N. Agarwal, S. Saxena, R. Arora, S. Gupta, H. Dhiman, et al., "Stock Market Prediction Using Machine Learning", 2018FirstInternationalConference
International Research Journal of Engineering and Technology (IRJET) e-ISSN:2395-0056
Volume: 11 Issue: 04 | Apr 2024 www.irjet.net p-ISSN:2395-0072
on Secure Cyber Computing and Communication (ICSCCC),2018.
[5] Corinna Cortes and Vladimir N. Vapnik, "Supportvector networks" in (PDF). Machine Learning, CiteSeerX,vol.20,no.3,pp.273-297,1995.
[6] Pedregosa et al., "Scikit-learn: Machine Learning in Python", JMLR,vol.12,pp.2825-2830,2011.
[7]IqbalZahid,R.Ilyas,W.Shahzad,Z.MahmoodandJ. Anjum, "Efficient Machine Learning Techniques for Stock Market Prediction", Int. Journal of Engineering Research and Applications, vol. 3, no. 6, pp. 855-867, Nov–Dec2013.
[8] Mustansar Ali Ghazanfar, Saad Ali Alahmari, Yasmeen Fahad Aldhafiri, Anam Mustaqeem, Muazzam Maqsoodand MuhammadAwaisAzam,"UsingMachine Learning Classifiers to Predict Stock Exchange Index", International Journal of Machine Learning and Computing,vol.7,no.2,April2017.
[9] Hegazy Osman and S Omar, "Soliman and Mustafa Abdul Salam A Machine Learning Model for Stock Market Prediction", International Journal of Computer Science and Telecommunications, vol. 4, no. 12, December2013.