
Volume: 11 Issue: 04 | Apr 2024 www.irjet.net
Volume: 11 Issue: 04 | Apr 2024 www.irjet.net
Dr. Chethan H K , Ms. Chaya Devi SN , Mr. Vinod Kumar C ,Mr. Vijay M
1 Professor, Dept. of Computer Science and Engineering, Maharaja Institute of Technology, Thandavapura 2,3,4, 5 Students, Dept of Computer Science and Engineering, Maharaja Institute of Technology, Thandavapura ***
Abstract - The financial market has seen significant involvementfromthestockmarket.Aminorcommoditycan experience varying effects as a result of stock market fluctuations.Investorsdrawntothecompanybyitsmarket valueorstockpriceforthecompany'sexpansion.Therefore, making an accurate stock price prediction might be quite beneficial.Asaresult,scholarshavefocusedonthissubject and have created numerous models and studies over the years. This research proposes a new framework for stock price prediction that combines many models (Long Short Term Memory (LSTM) model, Support Vector Regression (SVR) model, Linear Regression model, and Sentimental Analysis)intoahybridmodel.
It is evident from the simulation results that our suggestedstrategycanpredictfuturestocktrendswiththis hybrid model when the hyper parameters are adjusted appropriately.Onlinedatasetsforstockmarketswithopen, high, low, and closing prices are used to conduct the assessments.
Key Words: Long Short Term Memory (LSTM), Support Vector Regression (SVR), Linear Regression, Sentimental Analysis.
These days, investing in stocks seems to be an additionalsourceofrevenue.Whilesomeinvestasaprimary source of income, others do it as a retirement plan. By retaining their shares locally under the company's name, they strengthen their bonds with their employees. Even though stocks are prone to volatility, discerning investors can make more informed decisions about which firm to invest their money in by visualizing share prices across a rangeofcharacteristics.Withtoday'stechnology,oneofthe mostprominentfieldsisdatavisualization.Sinceadvancesin machine learning, stock market analysis and forecasting have become a significant and developing trend. These analysis techniques are used by brokerage businesses, financialinstitutions,thebankingindustry,andothersectors inordertoobtainfamiliaritywithstockscores.Businesses employ this to shield themselves from the possibility that their investments will cause their share price to decline. Government agencies in both developed and emerging nationsutilizestockanalysistoboosttheireconomysinceit influencesthepricingofothergoodsonthemarket.Giving the unstable enterprises security assurances has been a crucialcomponentofthemonitoring.
Assistinginthedecisionto purchase,sell,or hold has been the main goal of stock market forecasting. By utilizing the Streamline in this application we can, make dynamic graphs of a particular company's financial data. Furthermore, we can forecast future stock prices using a machine learning algorithm. Any corporation of one's choosing(witharecognizedstockcode)mayusethisonline program.
Our stock market prediction web app aims to give consumersprecisepredictionsandinsightssotheycanmake wise investing choices. Our platform uses real-time data analysisandsophisticatedmachinelearningalgorithmsto forecast future stock movements with high accuracy. This allowsuserstotakeadvantageofopportunitiesandreduce risk in the ever-changing financial markets. Furthermore, our intuitive interface and adaptable features guarantee smooth navigation and customized suggestions based on individualinvestingobjectivesandrisktolerances,enabling customerstosuccessfullytraversetheintricaciesofthestock market.
Thedataforourproposedmethodwillcomefromyfinance, whichisaninternetsource.Usingthepresentedapproaches, anassemblingmodel(i.e.,Linear,SVR,LSTM,andregression. The algorithms are selected based on how well they performed, as determined by the results of the literature review. Since stocks are thought to be a combination of linearandnon-linearity,several techniquesareapplied to improve accuracy. Sentiment analysis has also been conductedinconjunctionwiththismodeltotestpolarity.In additiontobeingmorebeneficialforSVM,wecanlearnfrom both positive and negative tweets, which can assist us in obtainingprofessionalguidance. International Research Journal of Engineering and Technology (IRJET) e-ISSN: 2395-0056
International Research Journal of Engineering and Technology (IRJET) e-ISSN: 2395-0056
Volume: 11 Issue: 04 | Apr 2024 www.irjet.net p-ISSN: 2395-0072
AnLSTM(longshorttimememory)algorithmwas introducedbySonawaneNikita,SonawaneAbhijit,Sharma Aayush, Shinde Sagar, and Prof. A.S. Bodhe[1] in order to trainastockpredictionmodel.Despitethelargedataset,the paperproducedanexcellentresultandsuggestedthatstock advertisementsbeclassifiedaccordingtoaspecificcompany. The results obtained were superior to those of other algorithms,andtheoutcomecanbedeemedexceptionally promisingasithasdemonstratedtheabilitytopredictwell incomparisontoothermethods.
Several techniques were provided by Azadeh Nikfarjam,EhsanEmadzadeh,andSaravananMuthaiyah[2] todemonstratetheinfluenceoffinancialnewsandtweetson stockprediction.
marketplace. They presented two methods: the first was basedonnewscontent,andthesecondwasbasedonmarket data,withtheclassifiertakingintoaccountcharacteristics like stock price opening, closing, and change indicator values.Thestockpriceswerenotedduringawindowoftime thatincludedthenewscast.
A research by Ashwini and Sakshi Pathak [3] concentratedonusingdifferentmachinelearningmethods, includingSupportVectorMachine(SVM),KNN,andLogistic usingtheRandomForesttechniqueand regressiononthe dataset.
Performance parameters such as recall rate, accuracy,precision,andfscorewerecomputed.Findingthe optimal algorithm for stock market prediction was their primarygoal.
Using a hybrid model of ARIMA and GRU, Rahul Mangalampalli,PawankumarKhetre,VaibhavMalviya,and Vivek Pandey[4]introducedanalternativeapproach.The authorofferedtwomethods.Whilethesecondstrategywas basedonmarketdata,suchasstockpriceatthetimeofnews release, close price, and change in indicator values were includedintheclassifierinput,thefirstapproachwasbased onthenewscontent.Wecouldgetmoreaccuratelabelsifwe examinedthemarketaroundthenews'srelease.
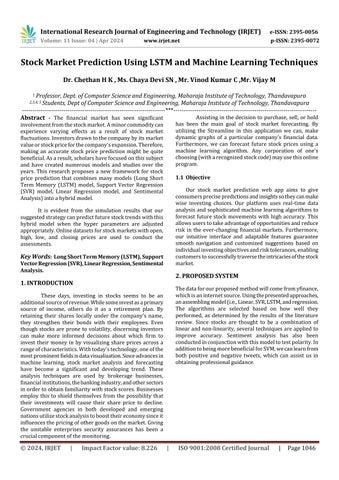
Implementationcontainsthefollowingsteps:
4.1 Data Pre-processing
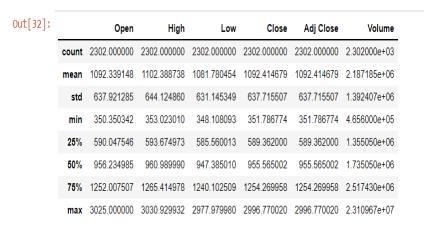
Wetookthedatasetfromyfinance(YahooFinance) andutilizeditformodeltestingandtraining.Ithadabout9 lakhrecordsforthatspecificcompany.Thevariablesthatwe tookintoaccountweretheopeningprice,closingprice,and pre-processingdate.
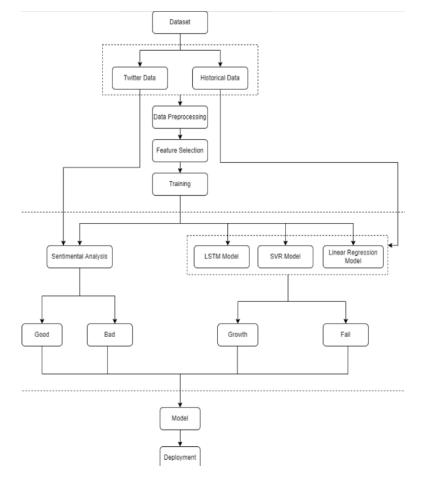
2: Company Description
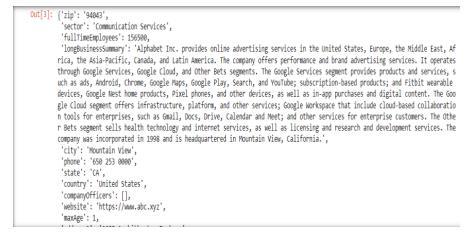
Theyfinancedatathatwasusedwasavailableincsvformat, whichthepandassoftwarewasusedtotransformintoadata frame. After sorting the data, the null Values were eliminated.
Fig 3: Data Pre-processing
International Research Journal of Engineering and Technology (IRJET) e-ISSN: 2395-0056
Volume: 11 Issue: 04 | Apr 2024 www.irjet.net p-ISSN: 2395-0072
4.2 Building and Training Model
We chose traits like RSI, volume, and closing price to be employedinthefeatureselectionprocessinordertopredict.
Two modules, a training dataset and a testing dataset, comprise the dataset. Three distinct methods are used to train the model: LSTM, Simple Vector Regression, linear regression.Thetrendinthestockofaspecificfirmwillbe forecasted with the aid of feature selection and the combinationofthethreealgorithms.
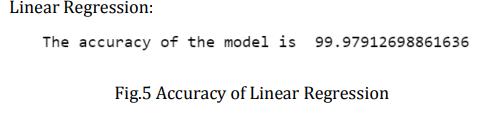
Theaccuracyofthemodelsareasfollows:
SVR: Fig 6 :Accuracy using SVR LSTM:
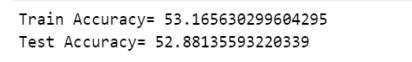
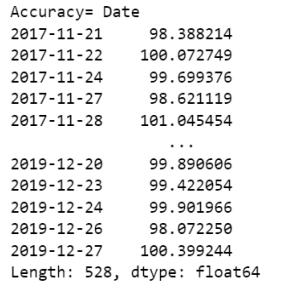
Fig 7:Accuracy using LSTM
Weutilizedsentimentanalysistobettertrainourmodel.The snscrapemodulewasusedtoextractthedatafromTwitter, usingadateofJanuary1,2019.Onehundredtweetsinall werecategorized.

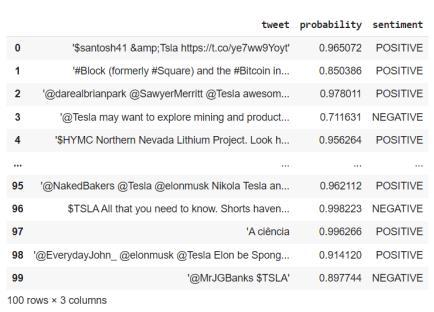
9:
4.3 Prediction
Hybrid algorithms are used to train the model used to predict future stock prices. By contrasting current stock prices with past stock prices, predictions will be made. Accuracyscoreisusedtodetermineaccuracy.
Inourmodel,thestockvalue,orthepredictedstocktrend, willbeshownasfollows:
PredictionusingLSTM:
International Research Journal of Engineering and Technology (IRJET) e-ISSN: 2395-0056
Volume: 11 Issue: 04 | Apr 2024 www.irjet.net p-ISSN: 2395-0072
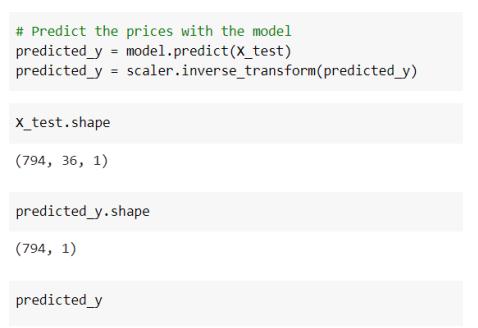
Fig 10: Prediction By LSTM
PredictionusingSVR:
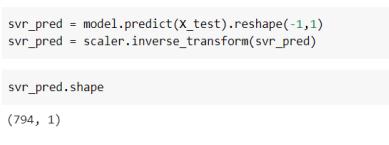
Fig 11:Prediction By SVR
4.4 Visualization
The stock graph is visualized using the Python matplotlib tool.Thegraph(Fig.12)belowisproducedbycontrastingthe connecting the expected price using the linear regression approachwiththerealprice.
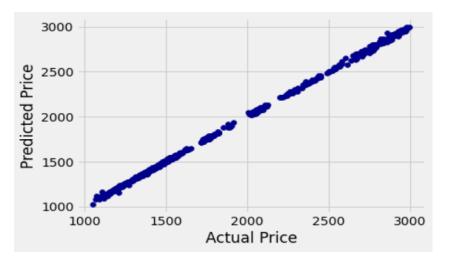
Fig 12:Graph Obtained using Linear Regression
The LSTM algorithm is used to compare the closing price withthedate,resultinginthegraph(Fig.13)below.
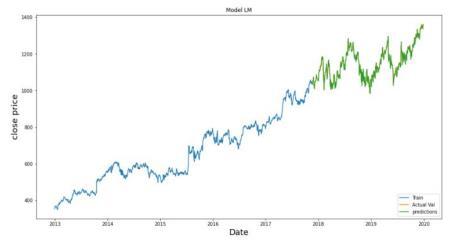
Fig 13:Graph Obtained using LSTM
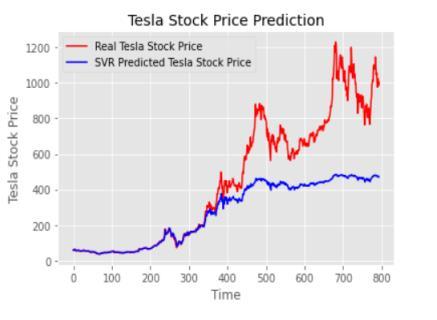
TheSVR methodwasusedtogeneratethegraph(Fig.14) below,whichcomparestheanticipatedandrealprices.
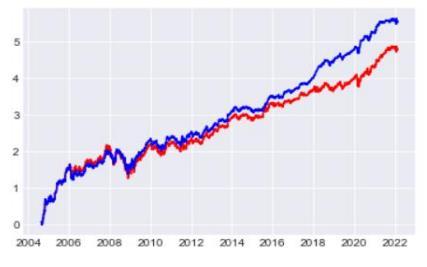
Fig 14: Graph Obtained using SVR
Thefollowingisavisualizationofourmodel'sfinaloutput: LSTMpredictioninahybridmodel:
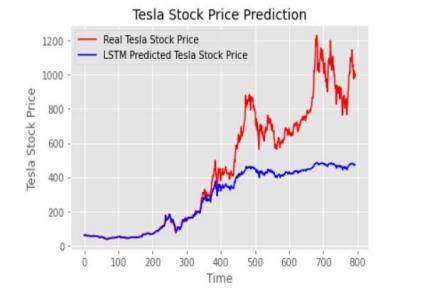
Fig 15: Prediction using hybrid model LSTM
International Research Journal of Engineering and Technology (IRJET) e-ISSN: 2395-0056
Volume: 11 Issue: 04 | Apr 2024 www.irjet.net p-ISSN: 2395-0072
SVRpredictioninahybridmodel:
15: Prediction using hybrid model SVR
5. CONCLUSION
This study shows that deep learning algorithms have a significant influence on the technologies used to create prediction models based on time series data. When comparedtootherregressionmodels,thesemethodsyield the highest accuracy level for stock prediction. This methodologycan assistastuteinvestors in making money whilepreservingahealthyatmosphereinthestockmarket. Puttingourhybridmodel'ssentimentanalysistogetherand turningitintoanAPIprovedtobechallenging.Inthefuture, we intend to get over these challenges by employing and combiningvariousalgorithmstoanalyzedatafromvarious marketsacrossvariouscategories.
[1]Nikita,S.,Abhijit,S.andAayush,S.,2021.STOCKMARKET PREDICTION USING LSTM. [online] Irjet.net. Available at: [Accessed30November2021].
[2] Mangalampalli, R., Khetre, P. and Malviya, V., 2021. STOCK PREDICTION USING HYBRID ARIMA AND GRU MODELS. [online] Ijert.org. Available at: [Accessed 30 November2021].
[3] Nikfarjam, A., Emadzadeh, E. and Muthaiyah, S., 2021. Textminingapproachesforstockmarketprediction.[online] https://www.academia.edu. Available at: [Accessed 30 November2021].
[4] Chonga, E., Hanb, C. and Park, F., 2021. Deep Learning Networks for Stock Market Analysis and Prediction: Methodology, Data Representations, and Case Studies. [online]durham-research-online.Availableat:[Accessed30 November2021].
© 2024, IRJET | Impact Factor value: 8.226 |