
International Research Journal of Engineering and Technology (IRJET) e-ISSN:2395-0056 Volume: 11 Issue: 04 | Apr 2024 www.irjet.net
International Research Journal of Engineering and Technology (IRJET) e-ISSN:2395-0056 Volume: 11 Issue: 04 | Apr 2024 www.irjet.net
1Ms. R. Poorani, 2Dr. J. Ramya
1 PG Scholar, Department of ECE, Hindusthan College of Engineering and Technology, Coimbatore.
2 Associate Professor, Department of ECE, Hindusthan College of Engineering and Technology, Coimbatore.
Abstract - Financial markets generate vast volumes of data, and within this data, anomalies or abnormal patterns can hold critical information for investors, regulators, and financial institutions. Identifying these anomalies is crucial for risk assessment, fraud detection, and informed decisionmaking. Leveraging the power of machine learning, this project presents an approach to detect anomalies in financial data. The project begins with the collection and preprocessing of financial data from various sources, ensuring data cleanliness and reliability. Exploratory data analysis techniques are applied to gain insights and engineer relevant features. Different anomaly detection techniques, including statistical methods and machine learning algorithms, are employed to identify deviations from normal behavior. The model's training phase involves data splitting and the selection of an appropriate anomaly detection algorithm. Threshold determination, which plays a vital role in detecting anomalies, is addressed, and the integration of domain knowledge is emphasized. Real-time monitoring systems are considered for applications that require continuous anomaly detection in streaming financial data. Case studies and real-world examples demonstrate how anomaly detection can benefit financial institutions by highlighting fraudulent activities, market irregularities,orunusualtradingbehaviors.Theprojectalso delves into the challenges and limitations associated with anomaly detection in financial data, along with strategies for model refinement. As transparency and interpretability become increasingly important, the project discusses approaches to explain model results to stakeholders. Additionally, it touches upon thecompliance and regulatory considerationsrelevanttofinancialdatahandling,including data privacy and security concerns. In conclusion, this project showcases the value of leveraging machine learning for anomaly detection in financial data. Identifying and addressing abnormal patterns, contributes to more informed decision-making, reduced risks, and enhanced securityinthecomplexworldoffinance.
KeyWords: Anomaly Detection, Financial Systems, Fraud Detection, Machine Learning.
In today's data-driven world, the role of data analysis and machine learning has become pivotal across variousdomains. Onearea wherethesetechnologieshave
madeasignificantimpactisanomalydetection.Anomalies, or deviations from expected patterns, often carry crucial insights, and their early detection can prove to be invaluablefordecision-makers.Thisjournalfocusesonthe fascinating and highly practical realm of "Anomaly Detection," a process of identifying and flagging unusual patterns, outliers, or irregularities within complex datasets.Anomalies,dependingonthecontext,cansignify opportunities,threats,inefficiencies,orerrors.Whetherin the context of finance, healthcare, cybersecurity, manufacturing, or any other field, the ability to identify and respond to anomalies is indispensable. Machine learning, with its power to handlevast datasets andlearn complex patterns, has emerged as a game-changer in anomaly detection. Leveraging a diverse array of algorithms and approaches, machine learning equips us with the means to sift through massive data streams, pinpointdeviations,anddistinguishmeaningfulanomalies from random noise. The synergy of data and algorithms opens doors to a multitude of use cases, from fraud detection and quality control to predictive maintenance andcybersecurity.
Machinelearning,asastudyofalgorithmstolearn regular patterns in data and their taxonomy, unnaturally includes supervised, unsupervised, and semi-supervised types. Supervised literacy assumes labeled data cases to learn from, which declares a model’s wanted affair. Depending on the algorithm in use, a model is acclimated to prognosticate classes or numerical values within a range. The supervised literacy type is the most common. The top difference in unsupervisedliteracyis the absence of markers that still can live in the original data but that aren't taken intoaccountas a point bythis typeof model. Affair from unsupervised models is grounded on the test data-related parcels understanding and findings, and the main thing is to prize data structure rather than specific classes. This includes distance and viscosity-grounded clusteringasasystemtogroupdatacasesintoboneswith analogous parcels. Association rules mining also belongs to the ultimate type. The selection of a machine literacy model typeforanomalydiscoverydependsonthevacuity of markers and being conditions for inferring unknown patterns. Anomaly discovery with supervised machine
literacy assumes labeled data. Each data case has its label whichisgenerallyamortalinputabouthowthealgorithm should treat it. double bracket means a dichotomous division of data cases into normal and anomalous, while multi-class bracket involves division by multiple types of anomalous cases and normal data cases. Classification problematization takes a major part( 67) out of all other dataminingtasksintheaccountenvironment,andamong the most habituated ML classifiers are logistic retrogression, support vector machines( SVM), decision tree-grounded classifiers, K- nearest neighbor( k- NN), naïve Bayes and neural networks. In the anomaly discovery process with unsupervised machine literacy, there'snotargettrait(marker)that'sconsideredduringa modelfittingprocess.It'santicipatedthatbysurveyingthe wholedataset,anautomaticliteracyprocesswill separate data cases that diverge from the normalcy perceived by the model. In a setting where there are no markers or theremaybeunknownanomalypatterns,itmaybelargely salutary.
a) Exploratory Data Analysis (EDA): This task involves exploring the distribution of stock prices and volumes over time for each company and visualizing trends,seasonality,andpatternsinthedata.
b) Correlation Analysis: The task is to investigate the correlations between the closing prices of different companiesandvisualizethecorrelationmatrices.
c) TopPerformersIdentification:Youaimtoidentifythe top-performing companies based on stock price growth and trading volumes over a specific time period.
d) Market Sentiment Analysis: This task involves performing sentiment analysis on news headlines related to each company to understand how news impactsstockpricesandvolumes.
e) VolatilityAnalysis:Youplantocalculatethevolatility of each company's stock prices using metrics like Standard Deviation or Bollinger Bands and compare theirvolatilitylevels.
a) Stock Price Prediction: This task involves predicting future stock prices for a particular company using time-series forecasting models and evaluating model performance.
b) Classification of Stock Movements: You aim to create a binary classification model to predict whether a stock will rise or fall, using historical data and technicalindicators.
c) Clustering Analysis: You plan to cluster companies based on their historical stock performance using unsupervised learning algorithms like K-means clustering.
d) Anomaly Detection: This task focuses on detecting anomalies in stock prices or trading volumes using techniqueslikeIsolationForestorOne-ClassSVM. e) Reinforcement Learning for Portfolio Optimization: The final task aims to formulate the stock market data as a reinforcement learning problem and optimize a portfolio's performance using algorithms likeQ-LearningorDQN.
Financial markets produce vast amounts of data, muchofwhichisintheformoftimeseries.Analyzingthis data often requires preprocessing the data information to ensureit'sinaconsistentandusableformat.Theprovided code snippet demonstrates an essential step in preparing financial data for time series analysis by processing the 'Date'column.
a) Create a DataFrame:
Infinancialanalysis,dataisoftenstoredintabular form. Here, we create a DataFrame named stocks_dataframeusingthePandaslibrary.Thisdataframe isa fundamental data structurethatallowsus toorganize andmanipulatethedataefficiently.
b) Convert the 'Date' Column to Datetime:
Financialdataoftencomeswithdateinformation, but the format can vary. To perform meaningful time seriesanalysis,weneedtoensurethatthe'Date'columnis correctly interpreted as a DateTime object. The code utilizes the pd.to_datetime function to convert the 'Date' column into a consistent datetime format. It accommodates two possible date formats: '%m-%d-%Y' and '%m/%d/%Y'. The errors='coerce' argument handles anyparsingerrorsbyreplacingthemwithNaNvalues.
c) Fill Missing Dates:
In financial datasets, it's common to encounter different date formats or missing values. To address this, the code employs the fillna method to replace any NaN values in the 'Date' column with dates parsed using the second date format ('%m/%d/%Y'). This ensures that all date entries in the 'Date' column are consistently formattedasdatetimeobjects.
d) Extract Date Without Time Component:
In time series analysis, it's often unnecessary to consider the time component of the datetime. To isolate the date component for analysis, the code creates a new Series named date_time_interval using the .dt.normalize() method. This operation sets the time component for each datetomidnight(00:00:00),makingiteasiertoworkwith dailydata.
e) Importance of Date Preprocessing:
Proper date preprocessing is crucial in financial analysis because it allows for consistent time-based comparisons, trend analysis, and forecasting. By ensuring that dates are uniformly formatted as DateTime objects, financialanalystscanperformvarioustimeseriesanalysis tasks,suchascalculatingreturns,measuringvolatility,and identifying patterns in historical financial data. This is particularly valuable for making informed investment decisions, risk management, and understanding market dynamics. The code lays the foundation for robust time seriesanalysisoffinancialdata.
Comparative Stock Performance refers to the practiceofevaluatingandcontrastingthehistoricaltrends, behavior, and outcomes of multiple stocks within a financial portfolioormarket.Thisanalysisisfundamental for investors, traders, and financial analysts seeking to make informed decisions regarding asset allocation, risk management, and investment strategies. It provides a valuable lens through which to assess the relative strengths, weaknesses, and potential of various stocks, sectors,ormarketsegments.
Key aspects of this comparative analysis include:
1. Identifying Top Performers: Comparative stock performance analysis allows investors to discern which stocks have demonstrated exceptional growth and resilience over a given period. This insight is instrumental for investors seeking stocks with consistent and robust performance, which may be suitableforlong-terminvestmentstrategies.
2. Evaluating Volatility: Volatilityisacriticalaspectof stock performance. By comparing multiple stocks, investorscangaugethedegreeofpricefluctuationin their investments. High volatility may indicate the potential for significant gains, but it also carries higherrisk.Lowvolatilitystocksmaybepreferredby risk-averseinvestors.
3. Sector Insights: Stocks within the same industry or sector may exhibit similar performance patterns due to shared market dynamics and economic factors. Comparative stock performance analysis extends to sector-level evaluations, enabling investors to spot trends, assess sector strength, and make strategic decisionsaboutindustryexposure.
4. Reading Market Sentiment: By comparing the performance of multiple stocks, analysts can detect shifts in market sentiment. Consistent declines in multiple stocks within the same sector may signal broader industry challenges, while synchronized uptrendsmaysuggestpositivemarketsentiment.
5. Divergence and Convergence: Comparativeanalysis uncovers instances of divergence, where similar stocks display differing trends, and convergence, where previously divergent stocks start moving in sync. These patterns may indicate changes in sector dynamicsorinvestmentopportunities.
6. Risk and Return Considerations: Investors weigh the risk-return tradeoff when assessing comparative stock performance. Stocks offering higher potential returnsoftencomewithhigherrisk.Thisbalanceisa crucial factor in constructing diversified and wellconsideredinvestmentportfolios.
7. Benchmarking: Comparativestock performance can involve benchmarking against market indices or specific benchmark stocks. Benchmarking helps investors understand how individual stocks or sectorsareperformingrelativetothebroadermarket, aidinginassetallocationdecisions.
8. Event Impact Analysis: Comparative stock performance can be instrumental in evaluating the impact of specific events on stock prices. It offers insights into how stocks react to economic reports, earnings releases, geopolitical events, or other market-movingoccurrences.
9. Investment Horizon: The analysis considers the investor's time horizon, whether focused on shorttermtradingopportunitiesorlong-terminvestments, enablingtailoreddecision-making.
Ultimately, comparative stock performance is a dynamic and data-driven approach to assess stocks attractiveness and growth potential within a diversified portfolio. It empowers investors with the insights necessary to make well-informed choices, optimize their portfolios,andachievetheirfinancialgoals.
Thelineplotillustratesthehistoricaltrendsinthe closingorlasttradingprices("Close/Last")oftendifferent stocksoveraspecifictimeperiod.

Fig 1. Close/Last Prices over Time
International Research Journal of Engineering and Technology (IRJET) e-ISSN:2395-0056
Volume: 11 Issue: 04 | Apr 2024 www.irjet.net
Each stock is represented by a unique line color, makingiteasytocomparetheirpricemovements.Theplot providesanoverviewofhowthesestockshaveperformed inrelationtooneanother,revealingpotentialinsightsinto their relative growth, volatility, or market behavior. Further analysis can uncover individual stock trends and investmentopportunitieswithinthisdiverseportfolio.
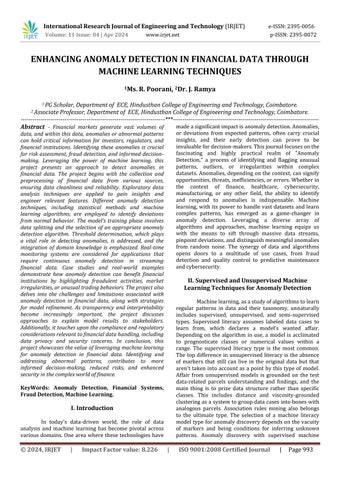
This line plot illustrates the historical trading volumeforthesametenstocksoverthesametimeperiod. Each stock is visually distinguished by a different line color, making it convenient to assess how trading volume varies for different stocks over time. The plot offers insightsintochangesinmarketactivity,potentialliquidity, andthelevelofinvestorinterestineachstock.
High trading volumes can signify periods of heightened volatility and potential risk. Investors can use this information to adjust their risk management strategies,includingsettingstop-lossordersandmanaging positionsizes.
Visualizations are generated to emphasize when and where anomalies occurred, facilitating a clearer understandingofthecontextandpotentialimplicationsof these deviations. The performance of the anomaly detection models is rigorously evaluated using appropriate metrics. If necessary, the models are finetunedtoenhanceaccuracyandminimizefalsealarms.
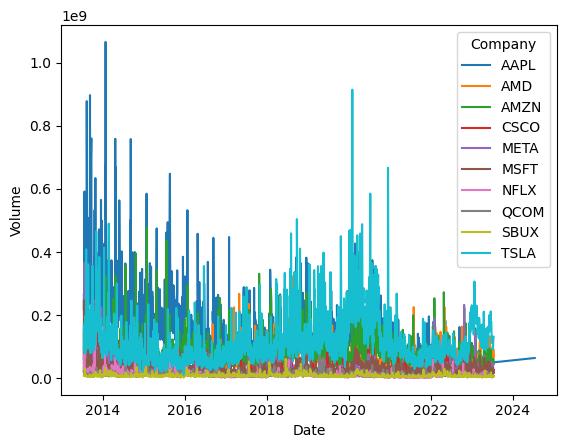
Line Chart for Advanced Micro Devices (AMD) Stock Prices Over Time:
Thissectionextractsandfocusesonthestockdata forAdvancedMicroDevices(AMD).Alinechartiscreated tovisualizethehistoricalclosingpricesofAMDstockover time.
The 'Date' is plotted on the x-axis, and the 'Close/Last'pricesareplottedonthey-axis.
The chart is colored in cyan and labeled 'Closing Price,' with appropriate axis labels and a title, making it clearthatthischartisspecifictoAMD.
The rotation of x-axis labels by 45 degrees enhances readability. Gridlines are added to assist with reading values on the chart. The chart provides a visual representationof howAMD'sstock priceshave fluctuated overtheselectedtimeperiod.
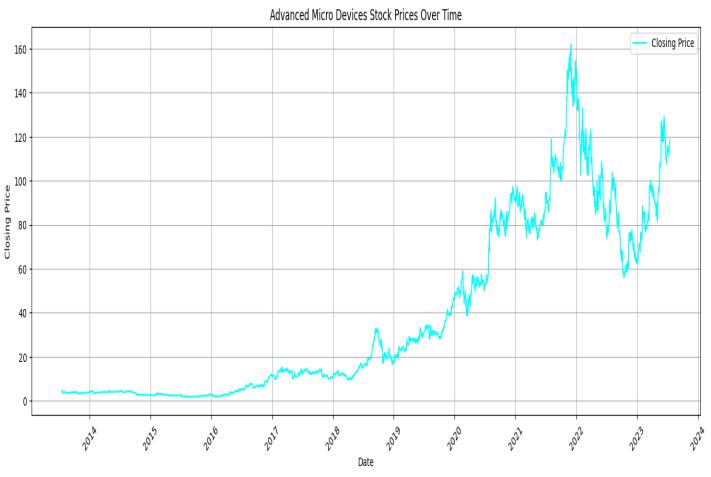
Bar Plot for Advanced Micro Devices (AMD) Trading Volumes over Time:
This part is dedicated to visualizing the trading volumes of AMD stock over time. A bar plot is used, with 'Date' on the x-axis and 'Volume' on the y-axis, representedinorange.
The chart is labeled 'Trading Volume' and includesappropriateaxislabelsandatitle.Itisspecifically focusedonthetradingvolumesofAMD.
The plot can be analyzed on different timeframes (e.g., daily, weekly, monthly) to identify trends and patterns. This can help identify long-term and short-term tradingsignalsandinsights.
Similar to the line chart, x-axis labels are rotated for better readability, and gridlines are included to
Volume: 11 Issue: 04 | Apr 2024 www.irjet.net
facilitate interpretation. This visualization helps users understand how the trading volumes of AMD stock have changed over the selected time frame, which can be valuableforassessingmarketactivity.
In this section, a correlation matrix is calculated for numeric columns in the entire stocks dataset, not just AMD.
A heatmap is used to visually represent the correlations between these numeric columns. Each cell in theheatmapisannotatedwithcorrelationvalues.
The color scheme is blue to green, with darker colors indicating higher positive correlations and lighter colorsrepresentingnegativecorrelations.
The heatmap is labeled 'Correlation Matrix,' and itstitledescribesitspurpose.
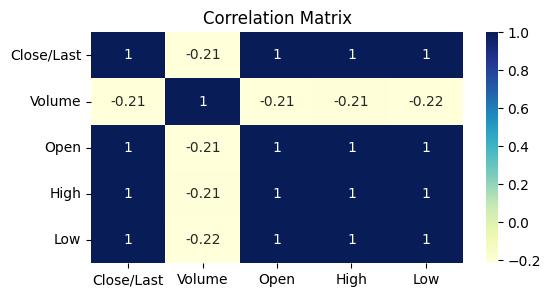
This visualization provides an overview of how variousnumericfeaturesarecorrelatedwithinthedataset. For example, it can reveal relationships between stock prices, trading volumes, or other numeric factors, which caninforminvestmentdecisionsordataanalysis.
Overall, these visualizations provide insights into AMD's stock performance (both prices and trading volumes) and the correlations between numeric features within the entire dataset. Each visualization serves a specificpurpose,helpingtobetterunderstandandanalyze thefinancialdata.
This project leverages machine learning and data analytics to provide financial institutions with a powerful tool for proactively managing risks, safeguarding against fraudulent activities, and making informed decisions based on anomalies detected within their data. The systematic approach and the ongoing monitoring system contribute to the long-term integrity of financial operations.
The Anomaly Detection in Financial Data: Leveraging Machine Learning project represents a
significant stride forward in the realm of financial data analysis and risk management. This project prioritized data purity and consistency, ensuring that the financial data under analysis was devoid of irregularities, standardized, and ready for advanced analysis. Through an exploratory data analysis phase, valuable insights into the data's underlying trends and patterns were obtained, bolstering the understanding of the dataset's characteristics. The deployment of robust machine learningmodels,includingIsolationForest,One-ClassSVM, and Autoencoders, enabled the effective identification of anomalies within the data. These models adeptly distinguished unusual behavior from normal patterns, enabling the detection of potentially risky events or activities.
The actionable outputs of this project translated detected anomalies into meaningful insights, creating alertsandreportsthatequippeddecision-makerswiththe ability to promptly respond to potential anomalies, thereby mitigating risks and addressing irregularities. Visualization played a pivotal role in this process, making anomaliescomprehensiblethroughvisualrepresentations thathighlightedwhenandwhereanomaliesoccurred.
The automated alerting system ensured the swift communicationof anomaliestothe relevantstakeholders, underlining the project's proactive approach to risk management. Continuous model evaluation and finetuning further solidified the precision and reliability of anomalydetection,reducingfalsepositivesandimproving theoveralleffectivenessofthesystem.
The core objective was to empower decisionmakers with actionable insights, facilitating the assessment of potential impacts of irregularities on financial operations and enabling informed choices regarding intervention or further investigation. The comprehensive documentation of the project, including detailedreportssummarizingfindingsandmethodologies, ensures transparency and regulatory compliance while serving as a valuable resource for future reference and learning.
This project's establishment of a robust system for continuous monitoring is paramount, contributing to the ongoing stability and security of financial operations. In essence, "Anomaly Detection in Financial Data: Leveraging Machine Learning" signifies a promising approach to addressing anomalies in financial data, enhancing security, and informing decision-making in the financial sector. It underscores the importance of a systematicanddata-drivenapproach,aswellassustained vigilance to adapt to emerging risks and challenges in the financialdomain.
International Research Journal of Engineering and Technology (IRJET) e-ISSN:2395-0056
Volume: 11 Issue: 04 | Apr 2024 www.irjet.net p-ISSN:2395-0072
[1]AneBlázquez-García,AngelConde,UsueMoriand Jose A Lozano, "A review on outlier/anomaly detection in time series data" in ACM Computing Surveys (CSUR), vol.54,no.3,pp.1-33,2021.
[2]Erdinc Akyildirim, Matteo Gambara, Josef Teichmann andSyangZhou,"Applicationsofsignaturemethodsto marketanomalydetection", arXivpreprint,2022.
[3]Kurbucz Marcell T, Péter Pósfay and Antal Jakovác, "Linear laws of markov chains with an application for anomaly detection in bitcoin prices", arXiv preprint, 2022.
[4]Shweta Tiwari, Heri Ramampiaro and Helge Langseth, "Machine learning in financial market surveillance: A survey", IEEEAccess,2021.
[5]Xiaochen Hu, Xudong Zhang and Lovrich. Nicholas P, "Forecasting identity theft victims: Analyzing characteristics and preventive actions through machinelearningapproaches", Victims&Offenders,vol. 16,no.4,pp.465-494,2021.
[6]Qingbai Liu, Chuanjie Wang, Ping Zhang and Kaixin Zheng, "Detecting stock market manipulation via machine learning: Evidence from china securities regulatory commission punishment cases", International Re-view of Financial Analysis, vol. 78,pp.101887,2021.
[7]Mohammad J Hamayel and Amani Yousef Owda, "A novel cryp-to currency price prediction model using grulstmandbi-lstmmachinelearningalgorithms", AI, vol.2,no.4,pp.477-496,2021.
[8]Samidha Khatri, Aishwarya Arora and Arun Prakash Agrawal,"Su-pervisedmachinelearningalgorithmsfor credit card fraud detection: a comparison", 2020 10th International Conference on Cloud Computing Data Science&Engineering(Confluence),pp.680-683,2020.
[9]"Anomaly Detection in Finance: A Machine Learning Perspective" Authors: Chandola, V., Banerjee, A., & Kumar, V. Published In: ACM Computing Surveys (CSUR),2019.
[10]Sirine Sayadi, Sonia Ben Rejeb and Zièd Choukair, "Anomaly detection model over blockchain electronic transactions", 2019 15th Inter-national Wireless Communications & Mobile Computing Conference (IWCMC),pp.895-900,2019.
[11]"Anomaly detection in finance: editors' introduction", KDD 2017 Workshop on Anomaly DetectioninFinance,pp.1-7,2018.
[12]Abhimanyu Roy, Jingyi Sun, Robert Mahoney, Loreto Alonzi, Stephen Adams and Peter Beling, "Deep learning detecting fraud in credit card transactions", 2018 Systems and Information Engineering Design Symposium (SIEDS), pp. 129-134, 2018.
[13]JiaWang,TongSun,BenyuanLiu,YuCaoandDegang Wang, "Financial markets prediction with deep learning", 2018 17th IEEE International Conference on MachineLearningandApplications(ICMLA),pp.97-104, 2018.
[14]Avraam Tsantekidis, Nikolaos Passalis, Anastasios Tefas, Juho Kanni-ainen, Moncef Gabbouj and Alexandros Iosifidis, "Using deep learning to detect price change indications in financial markets", 2017 25thEuropeanSignalProcessingConference (EUSIPCO), pp.2511-2515,2017.
[15]LoÏc Bontemps, Van Loi Cao, James McDermott and Nhien-An Le-Khac, "Collective anomaly detection based on long short-term memory recurrent neural networks", International conference on future data and securityengineering,pp.141-152,2016.