
International Research Journal of Engineering and Technology (IRJET) e-ISSN:2395-0056
Volume:11Issue:04|Apr2024 www.irjet.net p-ISSN:2395-0072
International Research Journal of Engineering and Technology (IRJET) e-ISSN:2395-0056
Volume:11Issue:04|Apr2024 www.irjet.net p-ISSN:2395-0072
VenkataSireesha
Information Technology
Institute of Aeronautical Engineering Hyderabad,India
BakkaArunKumar
Information Technology
Institute of Aeronautical Engineering Hyderabad,India
AbhishekBashetty
Information Technology
Institute of Aeronautical Engineering Hyderabad,India
Abstract Numerous initiatives to rely on new renewable energy sources, such solar electricity, have been sparked by the increased interest in global warming. With an increase in home photovoltaic (PV) panels that are available to the public, more precise calculations of energy generation are now possible. Segmenting satellite images offers a straightforward and inexpensive way to categorize solar panels..This worksuggestsamethodforclassifyingandsegmenting solar panels that combines the watershed algorithm with deep learning approaches. First, a Convolutional Neural Network (CNN) architecture with the ResNet, EfficientNet, and Inception architectures is used for classification. Through the fine-tuning of pre-trained networks on a heterogeneous dataset of solar panels, transfer learning improves performance. The categorization model recognizes solar panels in a variety of settings with accuracy, making maintenance and monitoring easier. After classification, the watershed method uses intensity gradients to precisely delineate solar panels from the background. Taskslikedefectdetectionandlayoutoptimizationare made easier when deep learning-based classification and watershed segmentation are combined. The outcomes of the experiments show how well the suggested method performs in terms of segmenting and classifying solar panels under various circumstances. A flexible automated solar panel management solution is provided by the combination of deep learning and the watershed algorithm, which promotes increased sustainability and efficiency in solarenergysystems.
Keywords renewable energy; photovoltaic (PV); Satellite image; segmenation; watershed method; deep learing
In the current era, the spotlight on sustainability and renewable energy sources has led to a surge in the utilization of solar panels, marking a significant stride towards a more eco-friendly future. Solar energy, drawn from the boundless radiance of the sun, emerges as a
DheninnChowdariAmbadipudi
Information Technology
Institute of Aeronautical Engineering Hyderabad,India
pivotal solution in combatting climate change while diminishingrelianceonfinitefossilfuels.Thissurgeinsolar panel adoption owes much to advancements in technology, heightened environmental consciousness, and compelling economic incentives. Advancements in solar panel technology have revolutionized the renewable energy landscape, rendering solar power more accessible and efficient than ever before. Breakthroughs in photovoltaic cell design, battery storage systems, and manufacturing techniques have notably enhanced the efficacy and affordability of solar panels, rendering them a feasible choice for residential as well as commercial applications. Additionally, the modular nature of solar panel setups allows for scalability, permitting users to tailor systems accordingtotheirenergyrequirementsandavailablespace. Nevertheless, despite the remarkable strides made in solar technology, the initial costs associated with solar panel installationsremainasignificantconsiderationforpotential adopters. Estimating the capacity and cost of solar panel systems conventionally involves intricate calculations and evaluations, often necessitating specialized expertise and knowledge. Factors such as geographical location, solar irradiance, shading, and system configuration all exert considerable influence on determining the optimal size and output of a solar installation. Traditional methods of estimatingsolarpanelcapacitytypicallyentailutilizingsolar irradiance data, conducting site surveys, and undertaking engineering analyses to evaluate the solar potential of a particular location. This process demands meticulous planning and assessment to ensure optimum performance andcost-effectiveness.Furthermore,thefinancialaspectsof solar installations, encompassing incentives, rebates, and financing options, must be carefully evaluated to gauge the overall return on investment. In this regard, the proliferation of online solar calculators and software tools has streamlined the process of estimating solar panel capacity and costs for consumers and businesses alike. These tools harness geographic data, system specifications, and energy consumption patterns to generate precise projectionsofsolarenergyproductionandfinancialreturns. Byempoweringuserstoassessthefeasibilityandeconomic viability of solar investments more efficiently, these tools are propelling further adoption of solar energy across diverse markets. In conclusion, the escalating deployment
International Research Journal of Engineering and Technology (IRJET) e-ISSN:2395-0056
Volume:11Issue:04|Apr2024 www.irjet.net p-ISSN:2395-0072
of solar panels heralds a seismic shift in the global energy panorama, presenting a sustainable alternative to conventional power sources. While upfront costs and capacity estimations have historically posed formidable barriers to adoption, technological advancements and the availability of sophisticated analysis tools are rendering solar energy more accessible and economically feasible than ever before. As societies continue to prioritize environmental preservation and energy autonomy, solar power emerges as a cornerstone in sculpting a cleaner, brighterfutureforgenerationstocome.
Withgreateraccuracyandrecallthan90%inrecollections, the writers identified and calculated the dimensions of solarPVinstallations.Witha recall rateofmorethan90%, the authors accurately located and calculated the dimensions of solar PV systems in both residential and non-residential settings. Yuan et al. also employed a CNN tomapsolarpanelsonabroadscaleusinghigh-resolution aerial photos (Yuan et al.,2016). They put forth a network architecture that records semantic information at several levels and allows for prediction at the pixel level. By employing this method, the writers were able to attain 0.873 completeness, 0.855 correctness (San Francisco), 0.84 completeness, and 0.812 correctness (Boston). SolarNet was created by Hou et al. to locate and map solar PV systemsacrossChina.
Thegoal oftheongoing effortistoautomaticallyidentify solar PV systems and their potential energy output in a particular geographic area using a novel artificial intelligence approach. In order to forecast power based on a particular satellite image, the ensemble model combining (resent, Inception, efficient net) was trained on the high resolution satellite photos of PV panels that werecollectedfromtheKagglewebsite.
3.1DataCollection:
There aren't many publicly accessible datasets for the classification of satellite photos of solar power panels in different regions. The dataset is divided into five groups according to different types of solar power panel configurations and satellite photographs of the sun. We use labels for power generation and photos of solar panelsasfeatures.
3.2Pre-Processing:
Pre-processing is a technique used to improve image quality and boost visualization. Image processing is an important step in the solar panel dataset that helps to enhance the image quality. This may be one of the most important elements in getting accurate and good outcomes in the next stages of the suggested process.
Images of solar panels may have several problems that causetheimagetobepoorlyvisualized.Inadequateorlowquality photos could produce disappointing outcomes. We carried out backdrop removal, removing unnecessary blood supplies, image improvement, and noise removal duringthepreprocessingstage.
3.3Train-TestSplitand
We now separate the training and testing data in our dataset.Thepurposeofthissplitistoevaluateourmodel's performanceonunknowndata andascertainthe extent to whichourmodelhasgeneralizedontrainingdata.Amodel fitting, which is a crucial stage in the model-building process,comesnext.
3.4ModelEvaluationandPredictions:
This last stage evaluates the model's performance on testing data using a variety of scoring measures; I have chosen to use the 'accuracy score' to do this. The process begins with the creation of a model instance. Next, the training data is fitted to the model using the fit method. Finally,predictionsaremadeon thetestingdata,orx_test, using the predict method. The predictions are then saved in a variable named y_test_hat. The y_test and y_test_hat will be fed into the accuracy_score function for model assessment, and the results will be stored in a variable named test_accuracy, which will hold the testing accuracy of our model. For a range of classification algorithm models, we performed these procedures and obtained correspondingtestaccuracyscore.
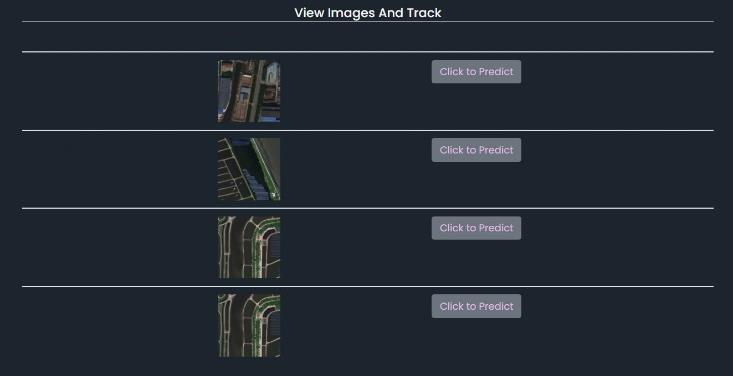
3.5Flaskwebapp:
we develop a webapp using flask framework and mysql database. User can register login, upload solar satellite image and under view images click predict to get power generationofsolarpanelsatthatlocation.
3.6Algorithms:
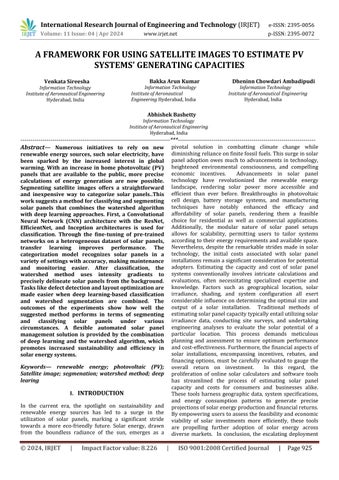
3.6.1CNNArchitectureProcess&Inputs:
CNNs use a variety of layers to convert an image into output that the model can comprehend. Convolutional layer:appliesafilterthatscanstheimagemanypixelsata timetobuildafeaturemap.
Figno:3.6.1
International Research Journal of Engineering and Technology (IRJET) e-ISSN:2395-0056
Volume:11Issue:04|Apr2024 www.irjet.net p-ISSN:2395-0072
In order to efficiently store the information produced by theconvolutionallayer,thepoolinglayerreducesitssize. Theoutputsareflattenedintoasinglevectorbythefully connected input layer.Applying weights to the inputs produced by the feature analysis is the fully connected layer. The output layer that is fully connected produces thefinalprobabilitiesneededtoidentifytheimageclass.
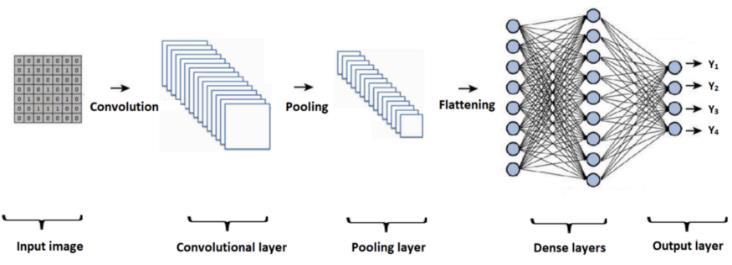
3.6.1.1Process:
Allofthenetwork'strainingsamplesareiteratedthrough both forward and backward propagation until the ideal weights are found and only the strongest and most predictive neurons are turned on to provide predictions.Every time it trains, the model goes through several epochs, going through all of the training samples onceforwardandoncebackward.
Figno:3.6.1.1
Forward propagation compares the difference between the actual and expected target for each tagged image, computingthelossandcostfunctions.Gradientdescentis a technique used in backward propagation to update the weights and bias of individual neurons, giving greater weight to the neurons with the highest predictive power until it reaches the ideal combination of activations. The loss measure decreases when the model learns to anticipate the target more accurately as it encounters moreexamples.Theaverageloss overall samples,which indicates overall performance, is taken by the cost function.
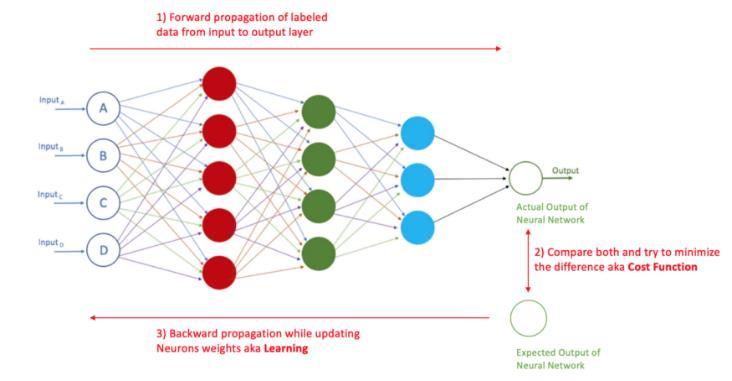
3.6.1.2Inputs:
The inputs for the model must always be in a 4D array withthedimensionsof(batch_size,height,width,depth). The quantity of training samples in a single epoch is known as the batch size; the larger the batch size, the more memory you will require. Length & Breadth: The image's pixel dimensionsDepth: Black & White (1), Red, Green,orBlue(3)
Figno:3.6.1.2
3.7SystemArchitecture:
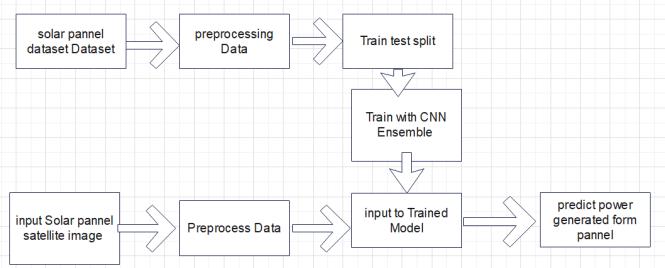
Figno:3.7
Afterbeingprocessedandturnedintoprocessingdata,the solarpaneldatasetistransformedintoatraintestsplit.Itis currently being processed or trained using CNN ensemble.On the other hand, as illustrated in Figure No. 3.7, the input solar panel image is preprocessed before being fed into the trained model, which yields the predictedvalue.

Figno:4.1
International Research Journal of Engineering and Technology (IRJET) e-ISSN:2395-0056
Volume:11Issue:04|Apr2024 www.irjet.net p-ISSN:2395-0072
Thefigureno:4.1demonstratesthesystem'sinterface whereregistrationisrequiredforthenextstep.

Figno:4.2
The login page is used to specify the particular person's data,andthisistheinterfaceofthatpage,asshowninFig no:4.2

Figno:4.3
Thereisaninterfaceforthesolarpanelsatelliteimageto getpowergenerationfromitasshowninfigno:4.3
Figno:4.4
Thisistheuploadedimageasshowninfigno:4.4
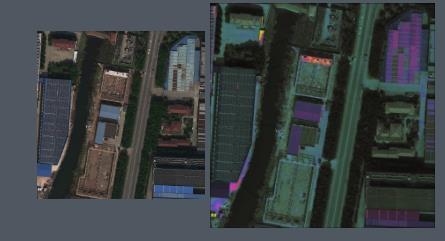
Figno:4.5
Thefigno:4.5showstheimageoftheuploadedimage andtheprocessedimage.

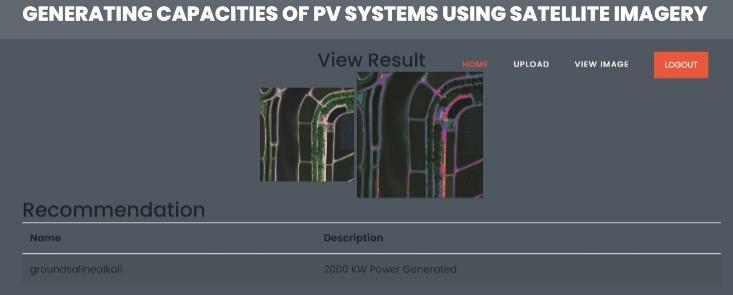
Figno:4.6
ThevalueofthePVsystemgeneratedisshowninFigno: 4.6

Figno:4.7
ThevalueofthePVsystemgeneratedisshowninFigno: 4.7
Figno:4.8
ThevalueofthePVsystemgeneratedisshowninFigno: 4.8
5.1Accuracy:
A comparison of the validation and taining accuracy is shown in Figure 5.1. illustrating the variation between then and now. While the x axis displays the epoch, the y axisdisplaysaccuracy.
International Research Journal of Engineering and Technology (IRJET) e-ISSN:2395-0056 Volume:11Issue:04|Apr2024 www.irjet.net p-ISSN:2395-0072
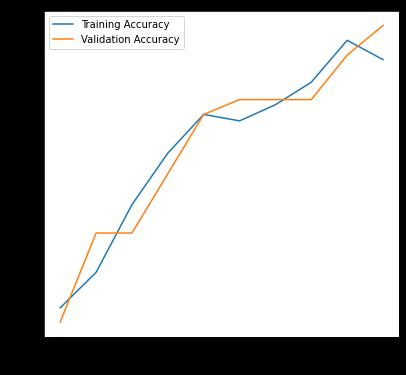
Figno:5.1
Despite rising raw material prices, solar PV manufacturing is growing significantly and is now a major energy component in many countries. Massive installations of solar PV systems in homes and businesses, however, are posing new difficulties for a variety of stakeholders, including network and market operators. Central databases for distributed solar PV may be inaccurate or out-of-date, and rooftop solar PV systems' precise locations and capacities are sometimes not recorded. The use of satellite and aerial images to automaticallydeterminethepositionsandcapabilitiesof solar PV systems over wide areas is therefore becoming moreandmorepopular.WithCNNasthebackbone,this study presents a method for evaluating the technical potential energy generating output utilizing the CNN Ensemble model (resent, efficient net, inception). The findings demonstrate that the CNN-based Ensemble approaches are capable of accurately estimating solar energy generation by exactly calculating the area of photovoltaic panels using satellite photos. The results imply that this strategy could work with more development.
Onthebasisofsuchshortcomings,somesuggestionsare proposed and discussed, which are believed to achieve goodresultsinthefuture.WecanuseRCNNalgorithmto segmentposition defectsolarpanelsandshowresult..
[1] “Renewable energy statistics 2013,” Korea Ministry of Trade, Industryand Energy, November, 2014, http://www.motie.go.kr
[2] “List of photovoltaic power stations larger than 50 megawatts (MW),”http://enwikipediaorg/wiki/List of photovoltaicpowerstations
[3] J. Marcos, L. Marroyo, E. Lorenzo, D. Alvira, and E. Izco, “Poweroutput fluctuations in large scale PV plants: one year observationswith one second resolution and a derived analytic model,” Progress inPhotovoltaics:ResearchandApplications,vol.19, no.2,pp 218–227,2011.
[4] J Kleissl, Solar energy forecasting and resource assessment.AcademicPress,2013.
[5]S. Pelland, J Remund,J Kleissl,T. Oozeki,andK De Brabandere,“Photovoltaic and solar forecasting: stateoftheart,”IEAPVPS,Task,vol 14,2013.
[6] A. Hammer, D. Heinemann, E. Lorenz, and B. L¨uckehe, “Short-termforecasting of solar radiation: a statistical approach using satellite data,”Solar Energy,vol 67,no.1,pp.139–150,1999.
[7] A Hammer, D. Heinemann, C Hoyer, R Kuhlemann, E Lorenz,R Muller, and H. G Beyer, “Solar energy assessment using remotesensing technologies,” Remote Sensing of Environment, vol. 86, no. 3,pp. 423–432,2003.
[8]Z.Peng,S.Yoo,D.Yu,andD.Huang,“Solarirradiance forecastsystem based on geostationary satellite,” in proc ofIEEEInternationalConferenceonSmartGrid Communications (SmartGridComm), 2013,pp 708–713.
[9] H. Breitkreuz, M Schroedter-Homscheidt, T. HolzerPopp, and S. Dech,“Short-range direct and diffuse irradiance forecasts for solar energyapplications based on aerosol chemical transport and numerical weathermodeling,” Journal of Applied Meteorology andClimatology,vol.48,no.9,pp.1766–1779,2009
[10] Y Kaufman, D. Tanr´e, H. Gordon, T Nakajima, J Lenoble,R Frouin,H.Grassl,B Herman,M King,and P. Teillet, “Passive remote sensingof tropospheric aerosol and atmospheric correction for the aerosoleffect,” Journal of Geophysical Research: Atmospheres (1984-2012),vol 102, no. D14, pp. 16 815–16830,1997.
[11] H. G. Beyer, C. Costanzo, and D. Heinemann, “Modifications of theheliosat procedure for irradiance estimates from satellite images,” SolarEnergy,vol.56,no.3,pp.207–212,1996.
[12] E Lorenz, A Hammer, and D. Heinemann, “Short termforecastingofsolarradiationbasedonsatellite data,” in EUROSUN2004 (ISES EuropeSolar Congress),2004,pp.841–848.
International Research Journal of Engineering and Technology (IRJET) e-ISSN:2395-0056
Volume:11Issue:04|Apr2024 www.irjet.net p-ISSN:2395-0072
[13] R Marquez and C F Coimbra, “Intra-hour DNI forecasting based oncloud tracking image analysis,” SolarEnergy,vol 91,pp.327–336,2013