
International Research Journal of Engineering and Technology (IRJET) e-ISSN: 2395-0056
Volume: 11 Issue: 04 | Apr 2024 www.irjet.net p-ISSN: 2395-0072
International Research Journal of Engineering and Technology (IRJET) e-ISSN: 2395-0056
Volume: 11 Issue: 04 | Apr 2024 www.irjet.net p-ISSN: 2395-0072
Chethan D M 1, Dr B Santhaveerana Goud 2
1 PG Student, Department of Civil Engineering, UVCE, Bengaluru University, Bengaluru, Karnataka.560056 Email: 2 Professor, Department of Civil Engineering, UVCE, Bengaluru University, Bengaluru, Karnataka.560056
Abstract - Rapid increase in industrialization and urbanization is a threat to the public health because of adverse impact on the quality of air caused by the accumulation of unwanted particles. Studies conducted in Delhihavealsodocumentedthelevelsofdifferentpollutantsin the air have reached an alarming heights. From past few decades Bengaluru is also growing in an exponential way causedconcernabout the quality ofair, it happens to be sixth mostpollutedcityinIndia.Hencethepresentstudyfocusedon predicting PM10 concentrations at four different air quality monitoring stations of Bengaluru by the application of Artificial neural network models(ANN). An attempt also is being made to assess the efficiency of models in the predictions.SixyearsdailyaveragePM10 datawasusedforthe study, Four different ANN models namely Feed forward back propagation neural network(FFBP), ELMAN neural network, Recurrent neural network(RNN) and Nonlinear Autoregressive with Exogenous input(NARX) were used in predictions. The assessment of efficiency was based on the correlationcoefficient(R)andMeanSquaredError(MSE).The results have shown that NARX model was found to be better than other models with a correlation coefficient of 0.88774 and Mean Squared Error of 0.008094. Hence for the city of Bengaluru NARX model may found to be more suitable for prediction of PM10 concentrations.
Key Words: Particulatematter;Artificialneuralnetwork; feedfarwardbackpropagation;Recurrentneuralnetwork; NonlinearAutoregressiveexogenousinput
In the midst of rapid increase in industrialization and urbanization,citiesindevelopingcountriesarewitnessing unprecedented population growth. Urban expansion, coupled with the surge in industrial activities, increased automobiles poses a grave threat to the natural environment, including vital resources such as air, water, andsoil.TheContinuousadditionofharmfulsubstancesinto theatmosphere,collectivelyknownasatmospherepollution, emerges as a pressing concern with far-reaching implications for human health, property, and ecological balance https://www.afro.who.int/health-topics/airpollution. Among the myriad forms of environmental pollution, air pollution stands out as a critical global
challenge,Thetermencompassesanyphysical,chemical,or biologicalagentthatdisruptsthenaturalcompositionofthe atmosphere, thereby deteriorating its quality and posing health risks to inhabitants. Nowhere this issue is more pronounced than in metropolitan hubs like Bengaluru, where the Air Quality Index (AQI) fluctuates dramatically witheachpassingseason,reflectingthealarminglevelsofair pollution prevalent in the region (Gurjar et al.2016). Bengalururanks6thamongthemostpollutedcitiesinIndia, withtheAirqualityIndex101arefoundtobeatalarming levelsatsomeseverelypollutedareas.
Theseplacesaredispersedthroughoutthecity,represent focal points of heightened air pollution, where concentrations of harmful pollutants exceed permissible limits. The immediate impact of such pollutants on respiratorysystemsunderscorestheurgencyofdeveloping accurate prediction models to serve as early warning systems,safeguardingpublichealthandwell-being. While manypredictionmodelsattempttocorrelateairpollutant concentrations with meteorological conditions. The complexity of these interactions necessitates advanced methodologies.
Traditional deterministic models often fall short in predicting extreme pollutant concentrations and require extensive computational resources, thereby limiting their practicalutility(Marjoviet.al2016;Wang2017).Incontrast, statistical approaches, such as Multiple Linear Regression (MLR) and Auto Regressive Moving Average (ARMA) methods,struggletocapturenon-linearpatternsandmay proveinadequateforextremeconcentrationscenarios(Li,X Pengetal.2016).Recognizingtheselimitations,researchers haveincreasinglyturnedtoartificialneuralnetwork(ANN) models, appreciating their efficiency and predictive accuracy. Artificial neural networks offer a versatile frameworkcapableofeffectivelymanagingnonlinearities, data distortions, and missing values inherent in environmental datasets (Chaloulakou et al. 2003). ComparativestudiesbetweenANNmodelsandconventional techniquesconsistentlydemonstratethesuperiorpredictive capabilities of neural networks across various domains (Jiang2004;Ghazietal2009.Gundogdu2009).
International Research Journal of Engineering and Technology (IRJET) e-ISSN: 2395-0056
Volume: 11 Issue: 04 | Apr 2024 www.irjet.net p-ISSN: 2395-0072
ThispaperfocusingonthepredictionofPM10concentrations an indicator of air quality at different monitoring stations within Bengaluru, India. Using four ANN models namely NARX, RNN, FFBP, and ELMAN, my study endeavors to identifythemosteffectivepredictivemodeltopredictPM10 concentrationinBengalurucity.Byharnessingthepowerof neuralnetworks,weaimtoassessrobustpredictionmodels capable of accurately predicting PM10 concentrations, therebyaidingpolicymakersandstakeholdersinformulating proactive measurestocombatairpollutionandsafeguard publichealth.
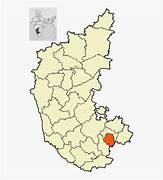
BangaloreCityLocatedontheDeccanPlateauinsouthern peninsularIndia,Bengaluru(formerlyBangalore),thecapital ofKarnatakastate,isthesecond-fastest-growingmetropolitan cityinthecountry.AccordingtotheCensusofIndia(2011), Bengaluru’spopulationisabout96,45,551anditislocatedat latitudeof12058’18’’Nandlongitudeof77035’37’’E.Itisthe nation’s leading information technology exporter and is popularlyknownasthe“SiliconValleyofIndia”andalsothe “GarmentcapitalofIndia”.Bengaluruissituatedatanaltitude of~920mabovemeansealevel.Theclimateoftheregionis classifiedasseasonaldrytropicalsavannaclimate,withthree distinctseasons:summer(MarchtoMay),monsoon(Juneto September),andwinter(OctobertoFebruary),City’sannual averagerainfallis970mm.andannualaveragetemperature variesfrom220cto340c.
FourairqualitymonitoringstationsestablishedbyCentral Pollution Control Board at different locations in Bengaluru namely Bapuji Nagar, Hebbal, Jayanagara, and Hombegowdanagara.ThedetailsareasshowninTable1and Figure1
Table1DescriptionofSelectedlocations
Name of the place
Bapuji nagar
Hebbal
Jayanagar (5th block)
Hombegow danagar
12°57'24’’N 77°32'22''E Residential
13°02'80'’N 77°35'49''E Industrial and Commercial
12°55'1''N 77°35'10''E Residential and Commercial
12°56'15'N 77°35'47''E Residential

3.0 METHODOLOGY FOLLOWED
3.1 Artificial neural networks
Foreachstation,fourneuralnetworkmodelswereusedall of them have different architecture. A series of training algorithms were considered, including error back propagation, conjugate gradient descent and levenbergMarquardtalgorithms.TheLevenberg-Marquardtalgorithm provedtobethemostefficientinourcase.Thisalgorithmwas designed toapproachsecond-order trainingspeed without computing hessian matrix. Back Propagation is used to calculatetheJacobianofperformancew.r.t.weightandbias variables.EachvariableisadjustedaccordingtoLevenbergMarquardtmethod.
International Research Journal of Engineering and Technology (IRJET) e-ISSN: 2395-0056
Volume: 11 Issue: 04 | Apr 2024 www.irjet.net p-ISSN: 2395-0072
Theearlystoppingtechniquewasimplementedduringthe trainingofdifferentANN models.Thetrainingprocesswas finalized when the selected Mean Squared Error (MSE) reachedaminimum.Thenumberofhiddennodeswasvaried and the corresponding value of the error function was calculated.Thenumberofnodesfortheminimumerrorwas selected.Betterresultswereobtainedwhenusinghyperbolic tangentfunctionsinthehiddenandoutputlayers,insteadof logistictransferandlineartransferfunctions.
FeedforwardBackpropagation(FFBP):
FFBP is a type of artificial neural network where information flows in one direction, from input to output layers.Itconsistsofaninputlayer,oneormorehiddenlayers, and an output layer. Each neuron is connected to every neuroninthesubsequentlayer.FFBPissuitableformaking predictionswhenthereisnotemporaldependencyamongthe inputdata.Itexcelsintaskssuchasimagerecognition,where eachinputcanbetreatedindependently.FFBPislimitedin predicting time-series or sequential data since it doesn't inherentlycapturetemporaldependencies.
RecurrentNeuralNetwork(RNN):
RNNsaredesignedtocapturesequentialinformationby introducingconnectionsbetweenneuronsthatformdirected cycles. Each neuron has a hidden state that retains information about previous inputs, allowing it to capture temporaldependencies.RNNsarewell-suitedforsequential prediction tasks, such as time series forecasting, natural languageprocessing,andvideoanalysis.Theycaneffectively modelsequencesofdataandmakepredictionsbasedonthe contextprovidedbypreviousinputs.RNNscansufferfromthe vanishingorexplodinggradientproblem,limitingtheirability tocapturelong-termdependencies.Additionally,traditional RNNs may struggle with capturing very long-term dependenciesduetotheirarchitecture.
ElmanNetwork:
Elman networks are a type of RNN with a simple architecture. They consist of an input layer, a hidden layer withrecurrentconnections,andanoutputlayer.Thehidden layer maintains a state that represents information from previous time steps.Elmannetworksare suitable for tasks requiring short-term memory, such as predicting the next valueinatimeseriesbasedonrecentobservations.Theycan captureimmediatedependenciesbetweenconsecutiveinputs. WhileElmannetworksareeffectiveforcapturingshort-term dependencies, they may struggle with capturing long-term dependenciesduetolimitationsintheirarchitecture.
NonlinearAutoregressivewithexogenousinputs(NARX):
NARXmodelscombineelements offeedforwardneural networkswithtime-delayedfeedback.Theyhavebothfeed forwardandfeedbackconnections,allowingthemtocapture dynamicdependenciesindata.NARXmodelsaresuitablefo
predictingtimeserieswithcomplextemporaldependencies. Byincorporatingfeedbackconnections,theycancapturethe effectsofpastinputsandoutputsonfuturepredictions.NARX models offer a more flexible architecture compared to traditional feed forward and recurrent networks. They are capable of capturing both short-term and long-term dependencies in data, making them well-suited for a wide rangeofpredictiontasks.
The software applications used in the present study is MATLABwhichisusedasapowerfultoolandcapabilitiesfor utilizingartificialneuralnetwork(ANN)modelsinprediction tasksacrossvariousdomains.ANNmodels,inspiredbythe structureandfunctionofthehumanbrain,arewidelyusedfor predictive modeling due to their ability to learn complex patterns and relationships from data. MATLAB's comprehensivesuiteoffunctions,toolboxes,andvisualization capabilities makes it an ideal platform for developing, training,anddeployingANNmodelsforpredictiontasks.
3.3
Datacollection
Data Preprocessing
Data Normalization
Prediction of PM10 using ANN models
FFBP
ELMAN RNN NARX
Sensitivity analysis
To evaluate the performance of NN models
Comparison of ANN models with respect to these prediction results
Fig 2.Flowchartformethodology
ThemethodologyfollowedincludesDatacollection,Data preprocessing,DataNormalization,PredictionofPM10using ANNmodels,Sensitivityanalysis,EvaluationofANNModel Performance, Comparison of ANN Models and Finding the BestPredictionModel.
1.
DailyaveragePM10dataforsixyearsperiodfrom1stJanuary 2018 to 31st December 2023 were collected from CPCB websitewereusedforthestudy.
Five meteorological variables namely Wind speed, Wind direction, Atmospheric Temperature, Relative humidity,
International Research Journal of Engineering and Technology (IRJET) e-ISSN: 2395-0056
Volume: 11 Issue: 04 | Apr 2024 www.irjet.net p-ISSN: 2395-0072
arometric pressure were considered as influencing parametersforPM10concentrations.Thedatarelatingtoall thefivemeteorologicalparametersforsixyearsperiodwere used for the study. The data was collected from CPCB Website.
The concise dataset underwent random partitioning into separatesubsets(Comrie,1997;Kolehmainenetal.,2001; Perez and Reyes, 2002) to facilitate the development and evaluation of models. The neural networks were trained usingthemajorityofthedataset(3/4),whiletheremaining caseswereevenlydistributedintovalidationandtestsets
Early stopping regularization was implemented on the validation set during network training to enhance generalization capabilities. The independent test set remained untouched throughout the training process and was exclusively utilized for statistically comparing the performance of different models. This method, known as split-sample or hold-out validation, is widely employed in numerousrelevantresearchstudiesutilizingearlystopping tomitigateoverfitting(GardnerandDorling,1999;Gardner andDorling,2000;Chaloulakouetal.,2003b,c).
2. Data Preprocessing:
MissingPM10datawereestimatedbysimpleinterpolation beforenormalization.
3. Data Normalization
Normalizationisaprocessusedtoscalenumericdatatoa standard range, usually between -1 and +1. It helps in comparingdifferentfeatureswithdifferentscalesandalso aidsmachinelearningalgorithmsinconvergingfaster.There arevariousnormalizationtechniques,Inpresentwork the commonformulaformin-maxnormalizationisused.Which scalesdatatotherange[-1,+1].Theformulaisgivenbelow
Xnew=(X-Xmax )/(Xmax-Xmin)……….(1)
WhereXmax =Maximumvalueoftheparameter,
Xmin =Minimumvalueoftheparameter
Xnew=Normalizedvalueoftheparameter
This formula ensures that the minimum value in the datasetisscaledto-1andthemaximumvalueisscaledto1, whileothervaluesarescaledproportionallyinbetween.
Four different artificial neural network (ANN) models wereusednamelyFeedforwardBackPropagation(FFBP), ELMANNeuralNetwork,RecurrentNeuralNetwork(RNN), and Non-linear Autoregressive with Exogenous input (NARX),wereusedtopredictPM10concentrationsbasedon theanalyzeddata.
Sensitivity analysis was conducted to evaluate the predictedresultsusingtheANNmodels.Thisinvolvesfinding the Correlation Coefficient (R) and Mean Squared Error (MSE)forthepredictedresultstoactualresults,whichare importantmetricsforassessingtheaccuracyandreliability ofthemodels.
The predicted results using different neural networks were analyzed using sensitivity analysis. The parameters selectedforthecomparisonwere:
Correlation Coefficient (R): Correlationisastatistical association it refers to how a pair of variables is linearly related. Correlation Coefficient (R) was calculated by the followingEq.
Where,Oc=observedconcentrations,
Oe=estimatedconcentrations,
Mc=Meanofobservedconcentration,
Me=meanofestimatedconcentration.
Mean Squared Error (MSE): Itmeasurestheaverageof thesquaresoftheerrors.Theequationusedforcalculationof MSEisasfollows:-
MSE= ……………………(3)

WhereOc=observedconcentrations,
Oe=estimatedconcentrations,
N=Totalnumberofdatasets.
The performance of the ANN models was evaluated to assesstheireffectivenessinpredictingPM10concentrations. Assessing the models' ability to capture the underlying patternsinthedataset.
The ANN models were compared with respect to their predictionresults.Thisstepinvolvedanalyzingthestrengths andweaknessesofeachmodelandidentifyingthevariations intheirpredictiveperformance.
Basedonthecomparisonandevaluation,thestudyaimed toidentifythebestpredictionmodelamongtheANNmodels forforecastingPM10concentrations.Thissteplikelyinvolved selectingthemodelthatdemonstratedthehighestaccuracy andreliabilityinpredictingPM10levels.
International Research Journal of Engineering and Technology (IRJET) e-ISSN: 2395-0056
Volume: 11 Issue: 04 | Apr 2024 www.irjet.net p-ISSN: 2395-0072
Thestudyinvolvedassessingtheperformanceofseveral Neural Network models, including FFBP, Elman Network, RNN,andNARX,forfourairqualitymonitoringstationsthey arediscussedwithresultsbelow.
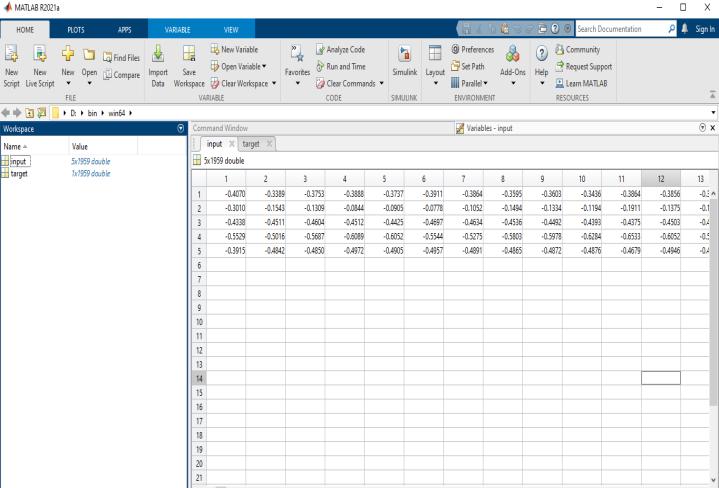
Fig.3.WindowShowingWorkspacewithInputandTarget data
CreatingworkspacewithInputandTargetDataisshown infigurethisisdonetoimportthedatafromworkspaceto neuralnetworktoolbox.Beforewefeedinputandtargetdata into workspace it has to be normalized between -1 to +1. Herewecanseeintheabovefigurethatfiveinputvariables of Normalized meteorological data and Normalized PM10 concentration data as target variable are feed into the workspace.
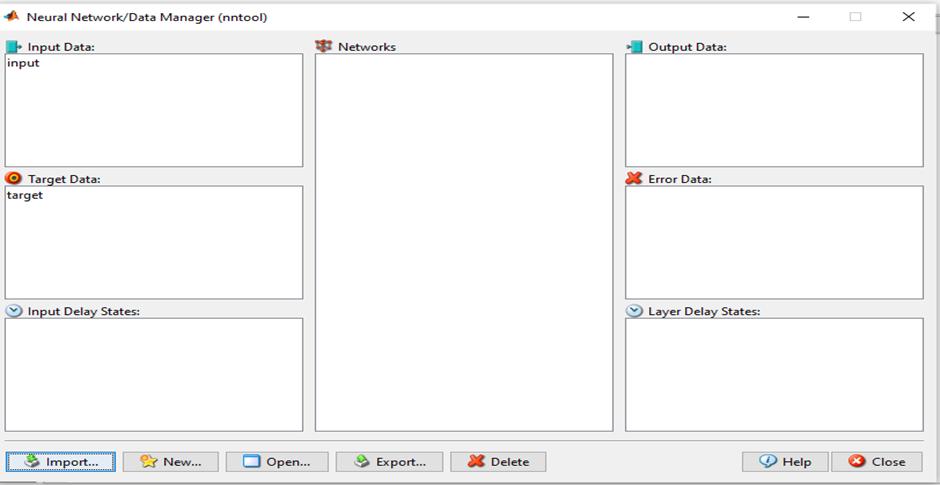
Fig.4.windowshowingimporteddataofinputand targetdatatonntoolbox
Inneuralnetworktoolbox,importInputandtargetdata into it and then click on New then create a network type whichwearegoingtouseasmodelsinourresearchwork.So thisasdoneforallfourmonitoringstationsdataseparately.
Theresultsforthefourdifferentmodelsforfoursites arediscussedonebyonebelowatfirst
a)NAMEOFTHEMONITORINGSTATION:BAPUJINAGAR i)FeedforwardBackpropagationneuralnetwork
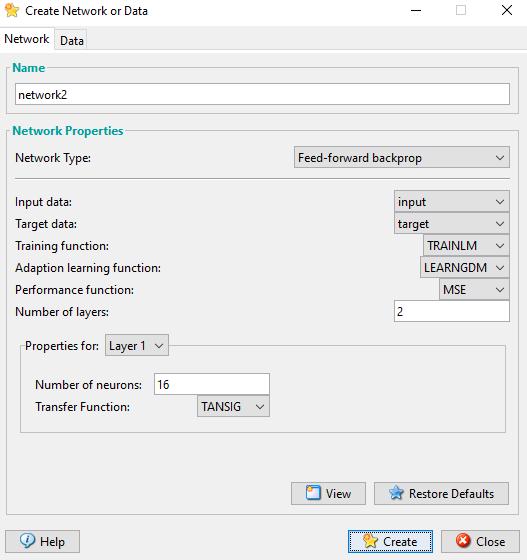
Fig.5.ShowingtheFFBPnetworkproperties
Here after creating network there opens an network properties window where we used to select network type that means which model weare going to use and thenwe shouldselectinputandtargetdataandTRAINLMastraining functionandLEARNGDMasadaptionlearningfunctionand performanceasMSEandtransferfunctionasTANSIG(tan sigmoidfunction)andnumberofneuronsareselectedbased ontrialanderrormethodwhichneurongivesbetterresult thatasbeenselected.Ithasbeendonebasedonsensitivity analysisthatisRandMSEvalues.
Forallthemodelsithastobedoneinthesamewaythe onlythingthatneedtobechangedisthattheNetworktype andthenumberofneuronsforwhichitgivesbetterresult.
International Research Journal of Engineering and Technology (IRJET) e-ISSN: 2395-0056
Volume: 11 Issue: 04 | Apr 2024 www.irjet.net p-ISSN: 2395-0072
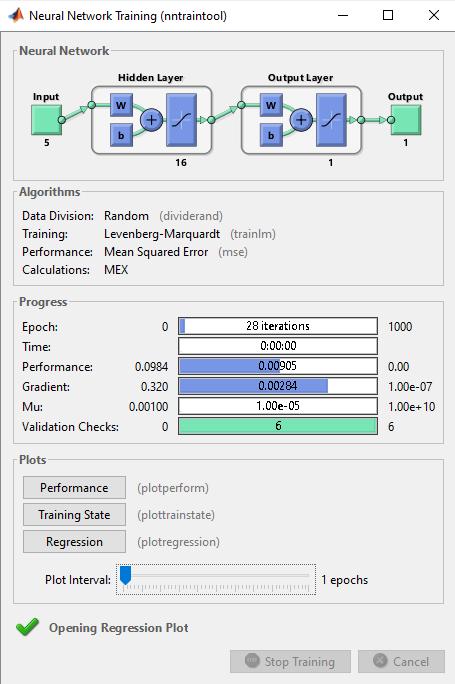
Fig.6.Showingperformancewindow
Here therandomdatadivisionandLevenbergmarquardt training function as been used and also progress of the algorithmwhereitstoppedtheepochs,timetaken,gradient, performance,validationchecksetcareshowninthefigure and also shows the plots of performance and regression wherewecanfindtheaccuracyofthepredictionmodel.And alsowecanseethearchitectureofthemodelwhereweused fiveinputvariablesandonetargetvariablesalongwiththe numberofneuronsinthehiddenlayer.Thewindowobtained will besameforallthemodelsforallthestationsonlythe changeisthattheperformanceofeachmodels.
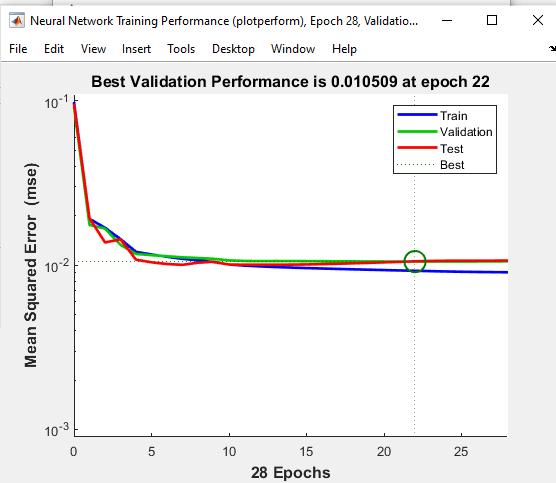
Fig.7.Graphshowsthebestvalidationperformanceof FFBPwithMSEvalue0.010509
Herethegraphshowsmeansquarederroras0.010509for theperformanceofFFBPfor28iterationsandinthegraphwe
can see that the line of training validation and testing are graduallydecreasedthismeansthatitwaslearninglikethe above we get graphs for MSE values for all stations for different models by subtracting actual data from predicted data and squaring the obtained value, summing up the obtained valueand dividingby number of output or target values thishas to be done for all stations for fourdifferent models.
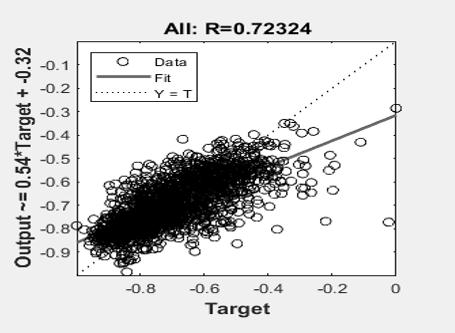
Fig.8.GraphshowstheRvalueofFFBPwithvalue 0.72324
Here the graph shows overall R value for training, validation and testing as 0.72324 this is obtained by determining the correlation between actual PM10 concentrationandpredictedPM10concentrationlikethis wayithastobedoneforallthemodelsforfourstationsso basedonthisRvalueandearliermentionedMSEvalues wecanabletodeterminetheperformanceofthemodels.
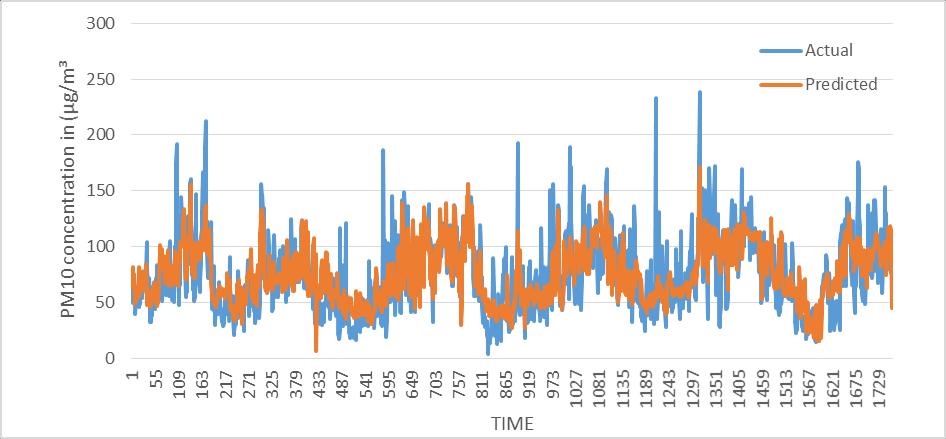
Fig.9.Graphshowsactualandpredicted concentrationofPM10
Figure shows the actual and predicted concentration of PM10 Here the best performance of FFBP network was
International Research Journal of Engineering and Technology (IRJET) e-ISSN: 2395-0056
Volume: 11 Issue: 04 | Apr 2024 www.irjet.net p-ISSN: 2395-0072
obtainedfor16numberofneuronswithRvalue0.72324and MSE value 0.010509. In actual data the maximum PM10 concentration was 238.66μg/m³ and minimum was 3.42μg/m³itcanalsobeshowninthefigureandforpredicted datawegetmaximumPM10obtainedwas171.26μg/m³and minimumwas6.618892μg/m³.
ii)ELMANNeuralnetwork
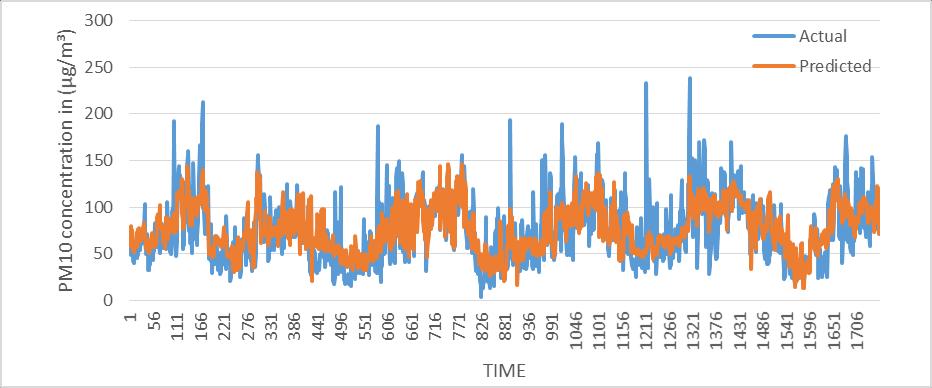
Fig.10.Graphshowsactualandpredictedconcentration ofPM10
Figure shows the actual and predicted concentration of PM10 Here the best performance of ELMAN network was obtainedfor14numberofneuronswithRvalue0.71951and MSEvalue0.009175.InactualinputdatathemaximumPM10 concentration was 238.66 μg/m³ and minimum was 3.42 μg/m³ it can also be shownin the figure and for predicted datawegetmaximumPM10obtainedwas146.7433μg/m³and minimumwas12.77304μg/m³.
iii)RecurrentNeuralnetwork(RNN)
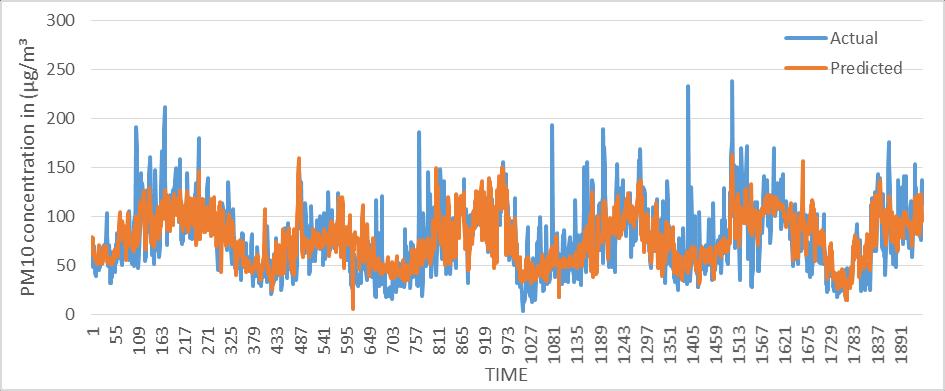
Fig.11.Graphshowsactualandpredictedconcentration ofPM10
Figure shows the actual and predicted concentration of PM10 Here the best performance of RNN network was obtainedfor15numberofneuronswithRvalue0.73031and MSEvalue0.008962.InactualinputdatathemaximumPM10 concentration was 238.66 μg/m³ and minimum was 3.42 μg/m³ it can also be shownin the figure and for predicted datawegetmaximumPM10obtainedwas162.7514μg/m³and minimumwas6.003182μg/m³.
iv) Nonlinear Autoregressive network with exogenous Inputs(NARX)
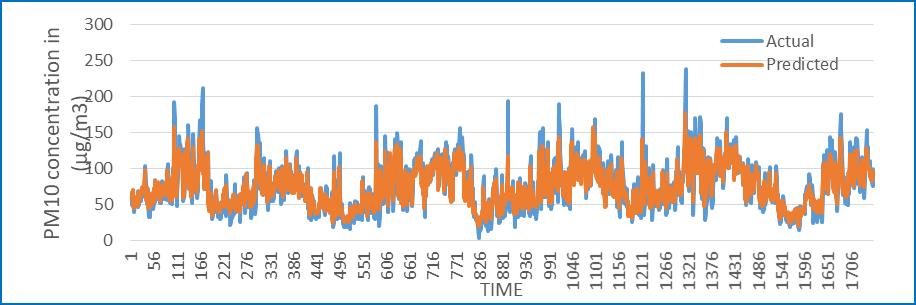
Fig.12Graphshowsactualandpredictedconcentration ofPM10
Figure shows the actual and predicted concentration of PM10 Here the best performance of NARX network was obtainedfor16numberofneuronswithRvalue0.82174and MSEvalue0.0070605.InactualinputdatathemaximumPM10 concentration was 238.66 μg/m³ and minimum was 3.42 μg/m³ it can also be shownin the figure and for predicted datawegetmaximumPM10obtainedwas177.1803μg/m³and minimum was 19.26022μg/m³.so this model gives PM10 concentrationnearlytoactualmeasuredPM10
b)NAMEOFTHEMONITORINGSTATION:HEBBAL
i)FeedforwardBackpropagationneuralnetwork
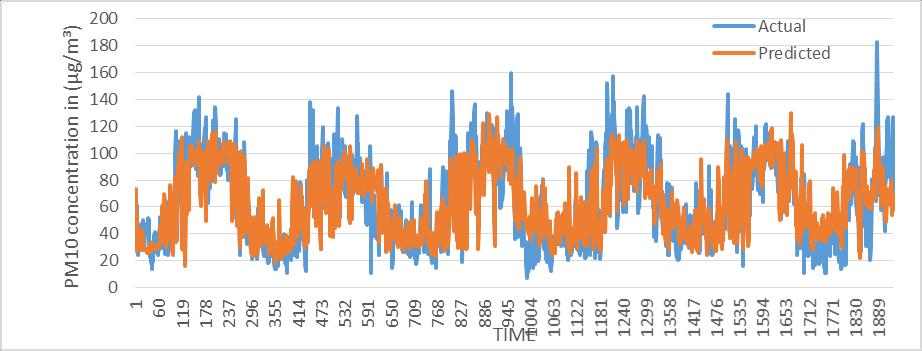
Fig.13Graphshowsactualandpredictedconcentrationof PM10
International Research Journal of Engineering and Technology (IRJET) e-ISSN: 2395-0056
Volume: 11 Issue: 04 | Apr 2024 www.irjet.net p-ISSN: 2395-0072
Figure shows the actual and predicted concentration of PM10 Here the best performance of FFBP network was obtainedfor13numberofneuronswithRvalue0.78264and MSEvalue0.014841.InactualinputdatathemaximumPM10 concentration was 182.82μg/m³ and minimum was 7.32μg/m³itcanalsobeshowninthefigureandforpredicted datawegetmaximumPM10obtainedwas129.5209μg/m³and minimumwas15.76931μg/m³.
ii)ELMANNeuralnetwork
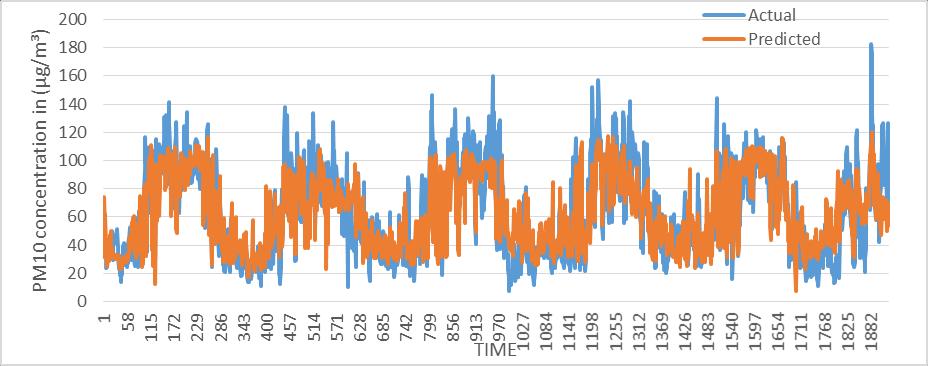
Fig.14Graphshowsactualandpredictedconcentration ofPM10
Figure shows the actual and predicted concentration of PM10 Here the best performance of ELMAN network was obtained for15 number ofneurons withR value 0.787782 andMSEvalue0.012606.Inactualinputdatathemaximum PM10 concentration was 182.82μg/m³ and minimum was 7.32μg/m³itcanalsobeshowninthefigureandforpredicted datawegetmaximumPM10obtainedwas119.9033μg/m³and minimumwas7.690726μg/m³.
iii)RecurrentNeuralnetwork(RNN)
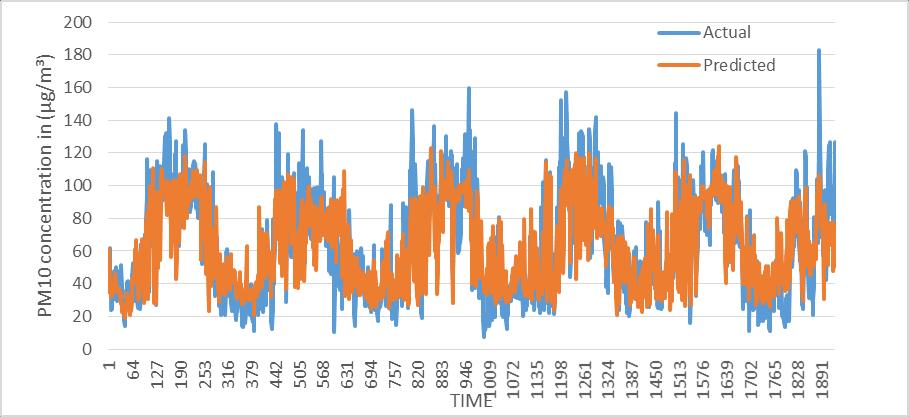
Fig.15Graphshowsactualandpredictedconcentration ofPM10
Figure shows the actual and predicted concentration of PM10 Here the best performance of RNN network was obtainedfor12numberofneuronswithRvalue0.79093and MSEvalue0.010779.InactualinputdatathemaximumPM10 concentration was 182.82μg/m³ and minimum was 7.32μg/m³itcanalsobeshowninthefigureandforpredicted datawegetmaximumPM10obtainedwas124.4375μg/m³ andminimumwas18.72366μg/m³.sothismodelgivesPM10 concentrationnearlytoactualmeasuredPM10
iv) Nonlinear autoregressive network with exogenous Inputs(NARX)
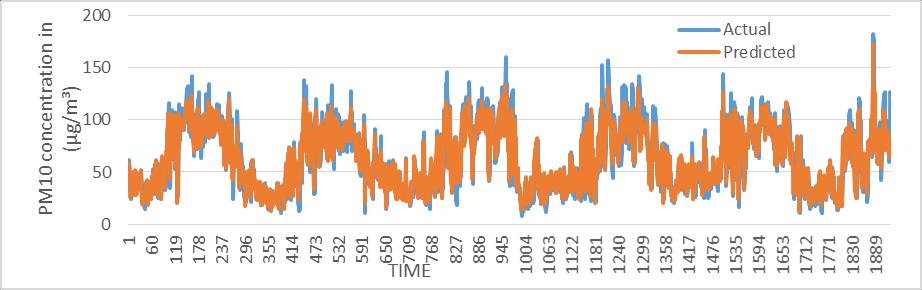
Fig.16Graphshowsactualandpredictedconcentration ofPM10
Figure shows the actual and predicted concentration of PM10 Here the best performance of NARX network was obtainedfor12numberofneuronswithRvalue0.84914and MSEvalue0.008126.InactualinputdatathemaximumPM10 concentration was 182.82μg/m³ and minimum was 7.32μg/m³itcanalsobeshowninthefigureandforpredicted datawegetmaximumPM10obtainedwas173.1163μg/m³and minimum was 11.25515μg/m³.so this model gives PM10 concentrationnearlytoactualmeasuredPM10.
C)NAMEOFTHEMONITORINGSTATION:JAYANAGAR i)FeedforwardBackpropagationneuralnetwork
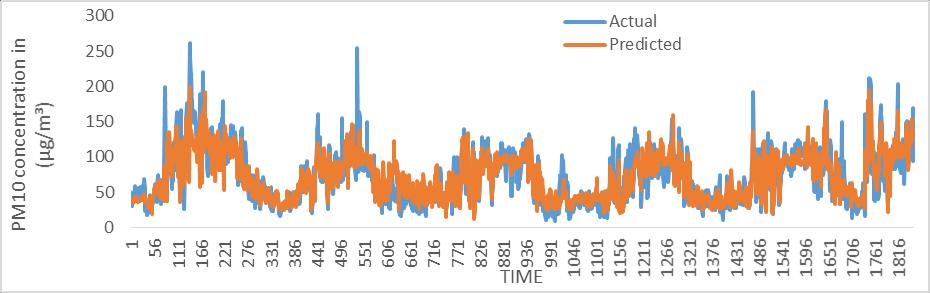
Fig.17.Graphshowsactualandpredictedconcentration ofPM10
International Research Journal of Engineering and Technology (IRJET) e-ISSN: 2395-0056
Volume: 11 Issue: 04 | Apr 2024 www.irjet.net p-ISSN: 2395-0072
Figure shows the actual and predicted concentration of PM10 Here the best performance of FFBP network was obtainedfor19numberofneuronswithRvalue0.81314and MSEvalue0.007445.InactualinputdatathemaximumPM10 concentration was 261.88μg/m³ and minimum was 9.52μg/m³itcanalsobeshowninthefigureandforpredicted datawegetmaximumPM10obtainedwas199.2321μg/m³and minimumwas12.54594μg/m³.
ii)ELMANNeuralnetwork
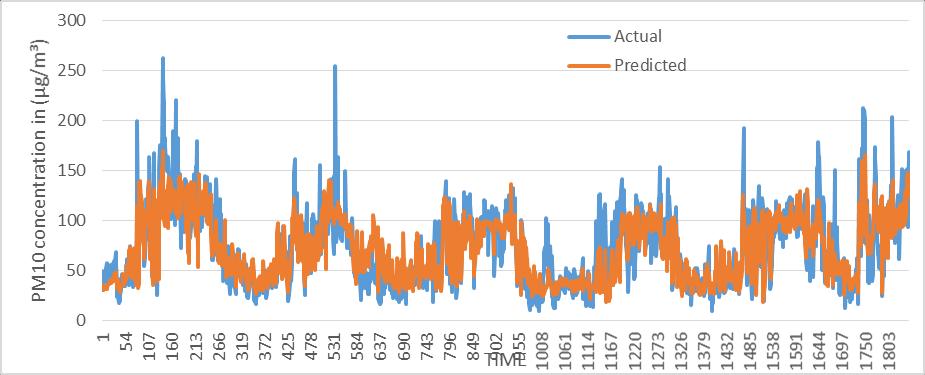
Fig.18Graphshowsactualandpredictedconcentration ofPM10
Figure shows the actual and predicted concentration of PM10 Here the best performance of ELMAN network was obtainedfor17numberofneuronswithRvalue0.80989and MSEvalue0.006919.InactualinputdatathemaximumPM10 concentration was 261.88μg/m³ and minimum was 9.52μg/m³itcanalsobeshowninthefigureandforpredicted datawegetmaximumPM10obtainedwas169.8613μg/m³and minimumwas19.2103μg/m³.
iii)RecurrentNeuralnetwork
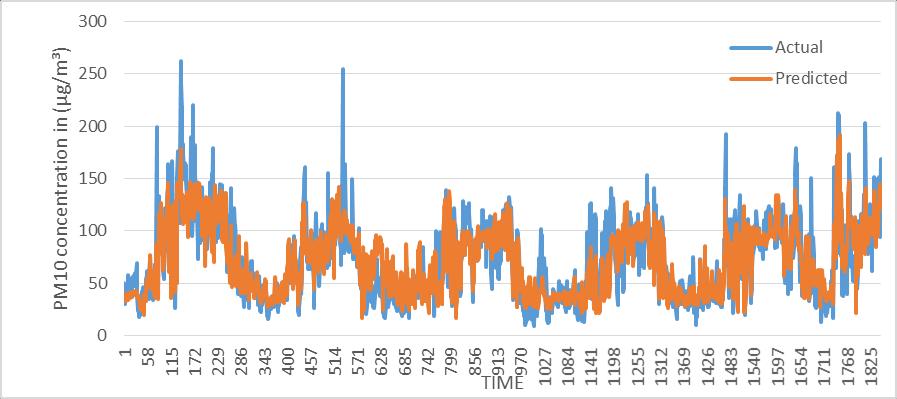
Fig.19Graphshowsactualandpredictedconcentration ofPM10
Figure shows the actual and predicted concentration of PM10 Here the best performance of RNN network was obtained for20 number ofneurons withR value 0.823453 andMSEvalue0.0080737.Inactualinputdatathemaximum PM10 concentration was 261.88μg/m³ and minimum was 9.52μg/m³itcanalsobeshowninthefigureandforpredicted datawegetmaximumPM10obtainedwas191.7104μg/m³and minimumwas16.62357μg/m³.
iv)NonlinearautoregressivenetworkwithexogenousInputs (NARX)
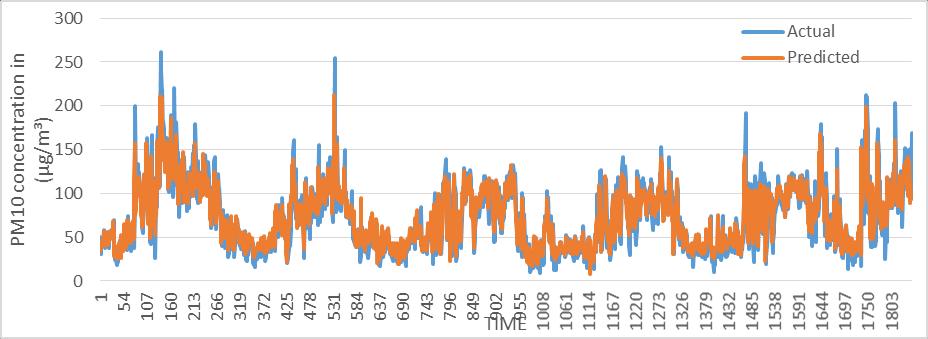
Fig.20.Graphshowsactualandpredictedconcentration ofPM10
Figure shows the actual and predicted concentration of PM10 Here the best performance of NARX network was obtainedfor20numberofneuronswithRvalue0.87773and MSEvalue0.006025.InactualinputdatathemaximumPM10 concentration was 261.88μg/m³ and minimum was 9.52μg/m³itcanalsobeshowninthefigureandforpredicted datawegetmaximumPM10obtainedwas212.3756μg/m³and minimum was 7.94313μg/m³.so this model gives PM10 concentrationnearlytoactualmeasuredPM10.
d)NAMEOFTHEMONITORINGSTATION:HOMBEGOWDA NAGAR
i)FeedforwardBackpropagationneuralnetwork
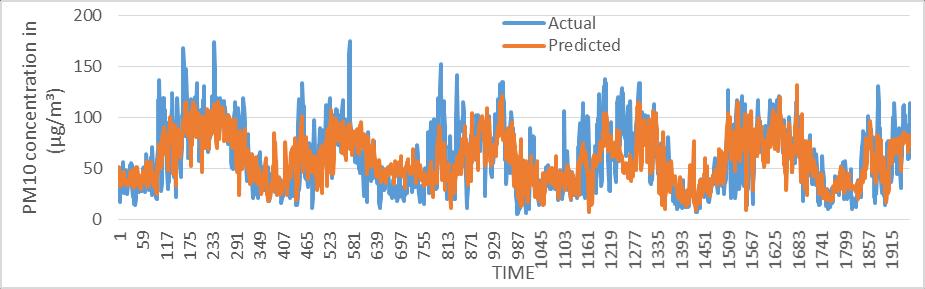
Fig.21Graphshowsactualandpredictedconcentration ofPM10
International Research Journal of Engineering and Technology (IRJET) e-ISSN: 2395-0056
Volume: 11 Issue: 04 | Apr 2024 www.irjet.net p-ISSN: 2395-0072
Figure shows the actual and predicted concentration of PM10 Here the best performance of FFBP network was obtainedfor17numberofneuronswithRvalue0.7456and MSEvalue0.015902.InactualinputdatathemaximumPM10 concentration was 174.92μg/m³ and minimum was 5.65μg/m³itcanalsobeshowninthefigureandforpredicted datawegetmaximumPM10obtainedwas131.4208μg/m³and minimumwas6.94414μg/m³.
ii)ELMANNeuralnetwork
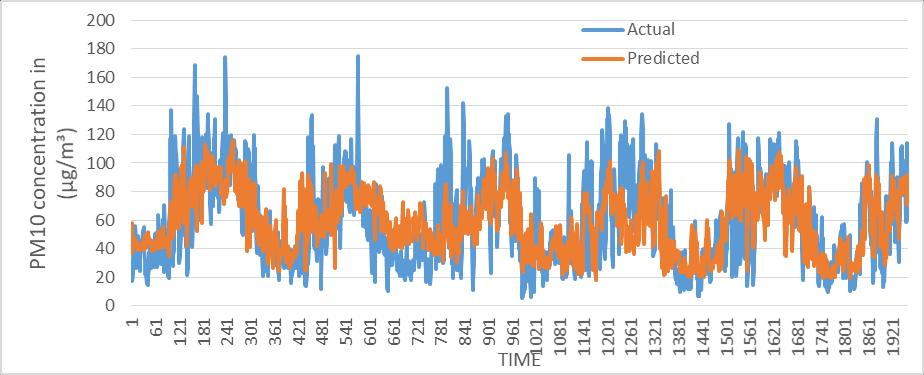
Fig.22Graphshowsactualandpredictedconcentration ofPM10
Figure shows the actual and predicted concentration of PM10 Here the best performance of ELMAN network was obtainedfor16numberofneuronswithRvalue0.71411and MSEvalue0.014244.InactualinputdatathemaximumPM10 concentration was 174.92μg/m³ and minimum was 5.65μg/m³itcanalsobeshowninthefigureandforpredicted datawegetmaximumPM10obtainedwas116.3685μg/m³and minimumwas18.44614μg/m³.
iii)RecurrentNeuralnetwork
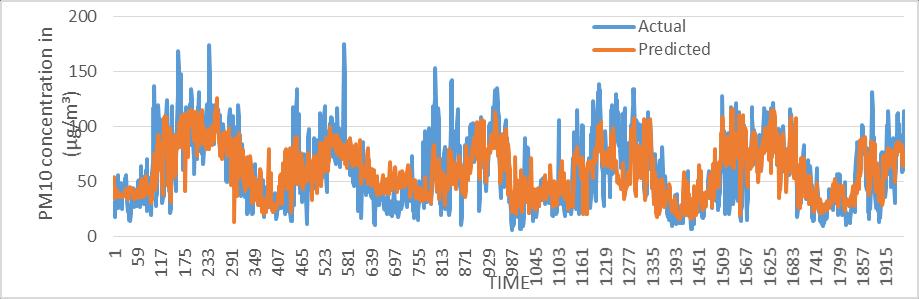
Fig.23Graphshowsactualandpredictedconcentration ofPM10
Figure shows the actual and predicted concentration of PM10 Here the best performance of RNN network was obtainedfor15numberofneuronswithRvalue0.73513and
MSEvalue0.013311.InactualinputdatathemaximumPM10 concentration was 174.92μg/m³ and minimum was 5.65μg/m³itcanalsobeshowninthefigureandforpredicted datawegetmaximumPM10obtainedwas125.9095μg/m³and minimumwas13.54332μg/m³.
iv) Nonlinear autoregressive network with exogenous outputs(NARX)
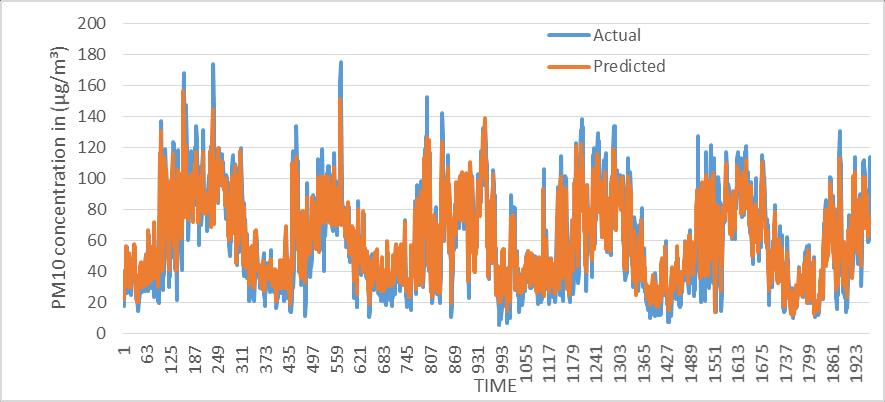
Fig.24Graphshowsactualandpredictedconcentration ofPM10
Figure shows the actual and predicted concentration of PM10 Here the best performance of NARX network was obtainedfor16numberofneuronswithRvalue0.88774and MSEvalue0.008094.InactualinputdatathemaximumPM10 concentration was 174.92μg/m³ and minimum was 5.65μg/m³itcanalsobeshowninthefigureandforpredicted datawegetmaximumPM10obtainedwas156.3969μg/m³and minimum was 12.00921μg/m³.so this model gives PM10 concentrationnearlytoactualmeasuredPM10.
Notably,itwasconsistentlyfoundthatemployingtheTan sigmoidactivationfunctionyieldedthemostfavorableresults acrossallmonitoredstations.
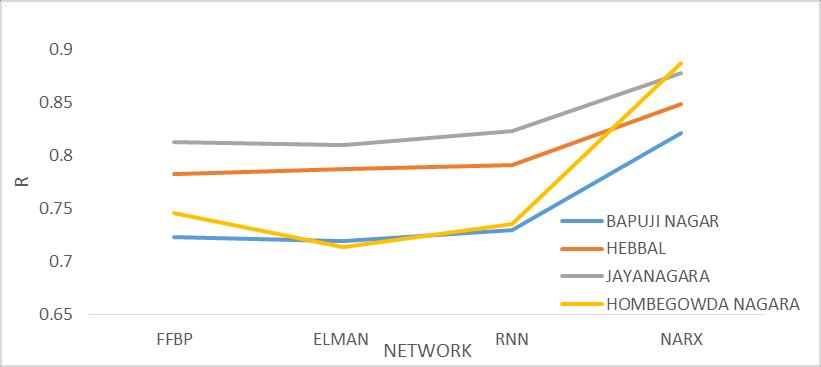
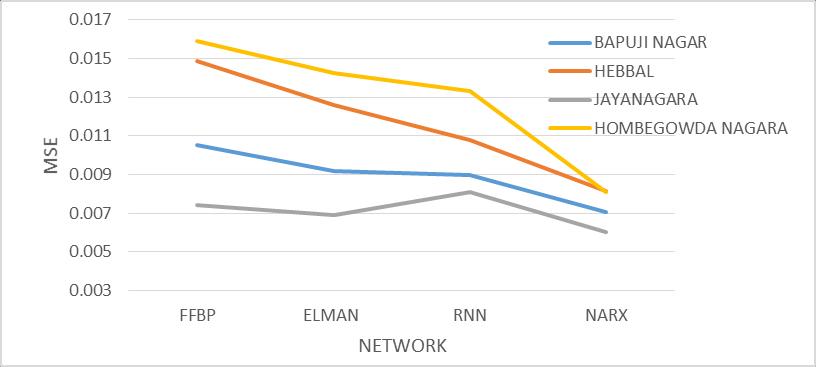
A comprehensive breakdown of the outcomes for each neural network at every designated stations is outlined in Table2.
International Research Journal of Engineering and Technology (IRJET) e-ISSN: 2395-0056
Volume: 11 Issue: 04 | Apr 2024 www.irjet.net p-ISSN: 2395-0072
Table2ValuesofRandMSEforeachnetworkforselected stations
Networks Optimum neurons R MSE
BAPUJINAGAR
FFBP 16 0.72324 0.010509
ELMAN 14 0.71951 0.009175
RNN 15 0.73031 0.008962
NARX 16 0.82174 0.007060
HEBBAL
FFBP 13 0.78264 0.014841
ELMAN 15 0.78778 0.012606
RNN 12 0.79093 0.010779
NARX 12 0.84914 0.008126
JAYANAGARA
FFBP 19 0.81314 0.007445
ELMAN 17 0.80989 0.006919
RNN 20 0.82345 0.008073
NARX 20 0.87773 0.006025
HOMBEGOWDANAGARA
FFBP 17 0.74560 0.015902
ELMAN 16 0.71411 0.014244
RNN 15 0.73513 0.013311
NARX 16 0.88774 0.008094
InTable2,theMeanSquaredError(MSE)andR(correlation coefficient) values are presented for selected stations for differentneuralnetworks.ThestationswiththehighestR valueof0.88774andthelowestMSEvalueof0.0080947is obtainedforHombegowdaNagarstation.Theseresultsare graphically depicted in Figures 25 and 26. However, the Elman Network exhibits comparatively poor performance acrossallsites,withanRvalueof0.714113andMSEvalueof 0.014244 for HombegowdaNagar. Similarly, the Feed forward Back propagation (FFBP) Network performs inadequatelyforBapujiNagar,withanRvalueof0.72324 andMSEvalueof0.010509.Thisdiminishedperformanceof theElmanandFFBPnetworkscanbeattributedtotheirhigh sensitivity to architectural configurations and parameter choices.
Thestudyfocusedonpredictingparticulatematter(PM10) concentrationinBengaluruusingartificialneuralnetworks, specificallyNARX,RNN,FFBP,andELMANmodels.Dataon PM10 concentration and meteorological parameters were collected from four stations in Bengaluru. The results indicated that the NARX network outperformed the other neuralnetworkmodelsinpredictingPM10 concentrationat these sites. This finding underscores the significance of accurate prediction models for PM10 concentration in addressingairpollutioninBengaluru.Thecomparisonsof differentANNmodelsprovideinsightsintothestrengthsand weaknessesofeachmodel,offeringvaluableinformationon theireffectivenessinpredictingairpollutionlevels.Overall, the research contributes to the understanding of the potential of artificial neural networks in predicting PM10 concentration and emphasizes the importance of robust predictionmodelsincombatingairpollutioninurbanareas likeBengaluru.
International Research Journal of Engineering and Technology (IRJET) e-ISSN: 2395-0056
Volume: 11 Issue: 04 | Apr 2024 www.irjet.net p-ISSN: 2395-0072
Utilizingmeteorologicalparametersasinputandpollutant concentrations,notablyPM10,astargetdata,diverseneural network models were executed. The precision of these predictivemodelsrendersthemvaluableasearlywarning systemsforgovernmentalauthorities.Byleveragingthese models,governmentscanformulateoradaptpoliciesaimed atenhancingairqualitywithinspecificregions.Moreover, suchmodelsservetoraiseawarenessamonglocalresidents regardingtheconcerningdegradationofairquality.
Chaloulakou, A., Saisana, M., Spyrellis, N., 2003b. Comparativeassessmentofneuralnetworksandregression models for forecasting summertime ozone in Athens. The ScienceoftheTotalEnvironment313,1–13.
Chaloulakou,A.,Grivas,G.,Spyrellis,N.:Neuralnetworkand multipleregressionmodelsforPM10predictioninAthens:a comparative assessment. J. Air Waste Manage. Assoc. 53(10),1183–1190(2003).
Comrie, A.C., 1997. Comparing neural networks and regressionmodelsforozoneforecasting.JournaloftheAir& WasteManagementAssociation47,653–663.
Gardner,M.W.,Dorling,S.R.,1999.Neuralnetworkmodeling and prediction of hourly NOx an NO2 concentrations in urbanairinLondon.AtmosphericEnvironment31,709–719.
Gardner,M.W.,Dorling,S.R.,2000.Statisticalsurfaceozone models:animprovedmethodologytoaccountfornon-linear behaviour.AtmosphericEnvironment34,21–34.
Ghazi,S.,Khadir,M.T.:Recurrentneuralnetworkformultisteps ahead prediction of PM10 concentrations. J. Autom. Syst.Eng.3,13–21(2009)
Gündo˘gdu,S.:ComparisonofstaticMLPanddynamicNARX neural networksforforecastingofatmosphericPM10and SO2concentrationsinanindustrialsiteofTurkey.Environ. Forensics21,1–12(2020)
Gurjar,B.R.:Khaiwal Ravindra andAjaySinghNagpur,Air pollutiontrendsoverIndian Megacities and their local-to-global implications. Atmos. Environ.142,475–495(2016).
Jiang, D., Zhang, Y., Xiang, H., Zeng, Y., Tan, J., Shao, D.: ProgressindevelopinganANNmodelforairpollutionindex forecast.Atmos.Environ.38(40),7055–7064(2004).
Kolehmainen, M., Martikainen, H., Ruuskanen, J., 2001. Neural networks and periodic components used in air qualityforecasting.AtmosphericEnvironment35,815–825.
Li, X., Peng, L., Yuan, H., Shao, J., Chi, T.: Deep learning architectureforairquality
Predictions.Environ.Sci.Pollut.Res.23(22),22408–22417 (2016).
Marjovi, A., Arfire, A., Martinoli, A.: High-resolution air pollutionmapsinurbanenvironmentsusingmobilesensor networks. In: International Conference on Distributed ComputinginSensorSystems,Fortaleza,pp.11–20(2015).
Perez, P., Reyes, J., 2002. Prediction of maximum of 24-h averageofPM10concentrations30hinadvanceinSantiago, Chile.AtmosphericEnvironment36,4555–4561.
Wang,D.,Wei,S.,Luo,H.,Yue,C.,Grunder,O.:Anovelhybrid modelforairqualityindexforecastingbasedontwo-phase decompositiontechniqueandmodifiedextremelearning machine.Sci.TotalEnviron.580,719–733(2017).
https://www.afro.who.int/health-topics/air-pollution https://www.thehansindia.com/karnataka/bengalururanks-6th-among-10-most-polluted-cities755086?infinitescroll