
International Research Journal of Engineering and Technology (IRJET) e-ISSN: 2395-0056 p-ISSN: 2395-0072

Volume: 11 Issue: 04 | Apr 2024 www.irjet.net

International Research Journal of Engineering and Technology (IRJET) e-ISSN: 2395-0056 p-ISSN: 2395-0072
Volume: 11 Issue: 04 | Apr 2024 www.irjet.net
B.Nancharaiah1 , M.V.Subrahmanyam2 , R.Manasa3,J.snehitha4,K.Jagan Mohan Achari5
1B.Nancharaiah:Professor, Dept. of Electronics and Communication Engineering, Usharama College of Engineering and Technology,Telaprolu,Andhra Pradesh-521109,India.
2M.V.Subrahmanyam,3R.Manasa,4J.Snehitha,5K.Jagan Mohan Achari- Students of Usharama College of Engineering and Technology,Telaprolu,Andhra Pradesh-521109,India.
Abstract - We present a novel approach for hyperspectral image classification, utilizing a dual-branch architecture for concurrent spatial and spectral feature extraction. Prior to feature extraction, we employ principal component analysis (PCA) to reduce data dimensionality, with varying degrees of downsampling across the two branches. Spatial information is captured through a multiregion piecewise Gaussian pyramid downsampling method, generating multiscale and multiresolution image data. Enhanced ResNet networks are then employed to extract spatial features, enabling the extraction of contextually specific features inherent to hyperspectral images. Meanwhile, spectral information is processed using a unique imaging spectral data technique, involving initial PCA-based dimensionality reduction followed by expansion intoN×N images.AdedicatedResNetnetwork,tailoredwith a distinct number of layers, is utilized for spectral feature extraction, addressing the challenge of variations in spectral data. Subsequently, the spatial and spectral features extracted from the dual-branch network are integrated and fed into a fully connected network for classification, resulting in significantly enhanced classification accuracy. Experimental validation on two benchmark datasets demonstrates the effectiveness of our proposed method, showcasing substantial improvements in classifieraccuracycomparedtoexistingapproaches.
Keywords:Deep learning, Gaussian pyramid, hyperspectral image (HSI) classification, multiscale featureextraction.
With the continuous advancements in science and technology, hyperspectral imaging, also referred to as imaging spectroscopy, has experienced rapid progress. This technology involves remote sensing satellites capturing tens of thousands of narrow spectral bands emitted or reflected from a given area. This capability enables the acquisition of more detailed spatial and spectralinformationcomparedtotraditionalpanchromatic and multispectral remote sensing images, allowing for improveddifferentiationbetweenvariousmaterials.Due to its advantages in attribute recognition, hyperspectral

image (HSI) processing technology has seen significant development and widespread application in various domains as rural planning, environmental monitoring, urban planning, vegetation coverage assessment, mineral extraction, national defense infrastructure and precision agriculture.
Consequently,classification techniques in the realm of hyperspectralimageryhavealsoadvancedrapidly,playing a crucial role in remote sensing applications. HSI classification, a focal point of recent research, entails assigningspecificclasslabelstoindividualpixelsbasedon their spatial and spectral characteristics. However, the complexity of HSIs, characterized by numerous spectral bands with high correlation information redundancy, posescomputational challenges. Moreover,distinguishing between different materials with similar or identical spectrafurthercomplicates classificationtasks.
Currently, methods for hyperspectral image (HSI) classification can be broadly categorized into those leveraging spectral information alone and those incorporating joint spatial–spectral features. Spectral information-basedclassificationmethodsrelysolelyonthe spectral dimension of HSIs, disregarding spatial pixel correlations. Examples include support vector machine, random forest, sparse representation, and similar techniques. In contrast, approaches integrating joint spatial–spectral features have shown improved classificationperformance,utilizingmethodssuchasedgepreserving filtering, multiscale adaptive strategies, lowrankGaborfiltering,andhierarchicalguidedfilteringwith nearest-neighborregularizationsubspaces.However,these methodsheavilyrelyonmanuallycraftedfeatures,leading tolimitedclassificationperformanceastheymaynotfully capturethecomplexcontentwithinHSIs.Incomparisonto traditionalshallowmethods,deeplearningtechniquesoffer enhanced representation and generalization capabilities, capableofextractingdeeperimagefeaturesandachieving more discriminative representations. Consequently, deep learning methods have gained significant traction in HSI classification, including convolutional neural networks (CNNs), two-channel networks, spectral spatial attention networks, and related approaches. Despite their

International Research Journal of Engineering and Technology (IRJET) e-ISSN: 2395-0056 p-ISSN: 2395-0072
Volume: 11 Issue: 04 | Apr 2024 www.irjet.net
effectiveness, CNN-based models often suffer from redundancy in spatial dimension information, affecting performance. To address this, some researchers have proposed innovative solutions like the octave convolution networkforpreprocessinghyperspectraldata,followedby spectral and spatial attention networks for feature extraction, fusion, and softmax classification. Additionally, effortssuchasthespectral–spatialunifiednetwork(SSUN) combinedeepandshallowconvolutionallayerstomitigate informationloss,whiletechniqueslikethedeformableHSI classification network (DHCNet) introduce adaptively adjustable deformable convolution sampling positions. Other methodologies like the contextual deep CNN (CDCNN) optimize local contextual information exploration, andmethodslikeR-PCAandCNN-PPFincorporateCNNsfor spectralandspatialinformationencodingandclassification tasks.Meanwhile,approachessuchasmultiscaleCNN(MSCNN)andthoseemployingsupportvectormachines(SVMs) andrandomfeatureselection(RFS)aimtosynergizehighdimensional data and multimodal classes. These methods encompass both unsupervised and supervised learning paradigms, with deep neural networks witnessing rapid advancements, especially in feature extraction and classificationtaskswithinHSIanalysis.
In recent years, the widespread adoption of deep learning methods, facilitated by rapid advancements in hardware,hasrevolutionizedvariousfields.
Following the introduction of convolutional neural networks (CNNs), neural networks have experienced remarkable progress in image processing, giving rise to a multitude of CNN-based image classification models. This surge in deep learning has significantly advanced image classificationcapabilitiesandhasinspired the exploration of intelligent and efficient hyperspectral classification methodsdiscussedinthispaper.Unliketraditionalmachine learningalgorithms,whichtypicallyfocusonlearninglowlevel features such as object outlines or textures, deep learning excels in capturing complex, high-dimensional featuresessentialforhyperspectralclassificationtasks.As such, deep learning emerges as the optimal choice for addressing the intricate demands of hyperspectral classification, where precise recognition of numerous featuresisparamount.Deeplearningnotonlyencompasses the learning of low-level features but also extends to capturing subtle nuances of target objects, presenting a robust foundation for hyperspectral classification tasks. Moreover, hyperspectral imaging (HSI) data exhibit highdimensional spectral characteristics with distinct waveband responses. Leveraging the residual network architecture, which effectively addresses the challenge of network degradation as networks deepen, allows for the extraction of profound features. This makes residual networks particularly well-suited for capturing the
intricate features present across various hyperspectral
bands. Additionally, the residual network's inherent capacity to handle increasingly complex data representations enables it to effectively navigate the rich and diverse spectral information inherent in HSI datasets. This capability enhances the model's ability to discern subtledifferencesamongspectralsignatures,consequently bolstering the accuracy and reliability of hyperspectral classification outcomes.In addition to its prowess in capturingsubtlefeaturesoftargetobjects,deeplearning's applicationinhyperspectralclassificationbenefitsfromthe unique characteristics of spectral data within hyperspectral images (HSIs). These datasets are distinguished by their high dimensionality, often comprising hundreds of narrow spectral bands, each exhibiting distinct waveband response features. The residual network architecture, known for its ability to mitigate the challenge of degradation in deep networks, proves highly advantageous in this context. By leveraging residual connections, which enablethedirectpropagation of information across network layers, residual networks excel in extracting deep-level features from hyperspectral bands. This capability is particularly valuable in hyperspectral analysis, where discerning nuanced variations in spectral signatures is crucial for accurate classification. Furthermore, the adaptability of residual networks to intricate data representations facilitates the exploration of complex hyperspectral datasets, empowering the model to uncover subtle patterns and distinctions across spectral bands. As a result, the integrationofdeeplearningtechniques,especiallythrough architectures like residual networks, offers a promising avenue for enhancing the precision and robustness of hyperspectral classification methodologies.The extensive arrayofspectralbands,characterizedbytheirnarrowness and multitude, poses challenges in hyperspectral imaging (HSI).
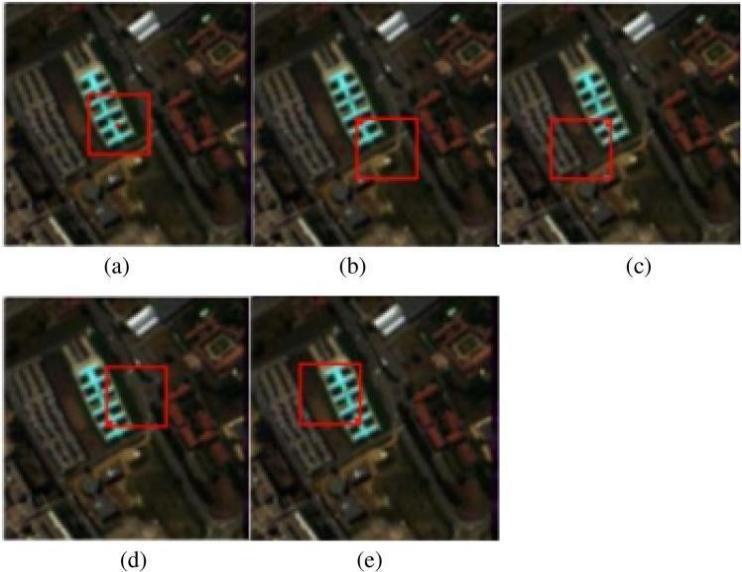
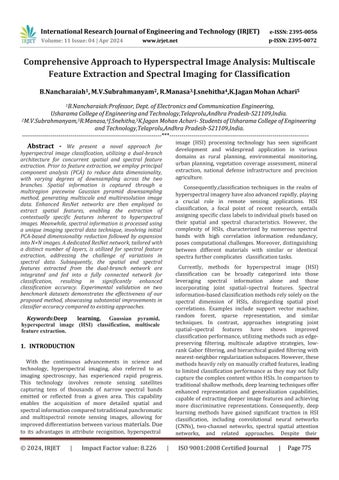
Fig. 1. Diverse regions of a pixel of interest. (a) Global region. (b) Upper-left region. (c) Upper-right region. (d) Bottom-leftregion.(e)Bottom-rightregion.

International Research Journal of Engineering and Technology (IRJET) e-ISSN: 2395-0056 p-ISSN: 2395-0072
Volume: 11 Issue: 04 | Apr 2024 www.irjet.net
2. Gaussianpyramidstructure.
These challenges include the high correlation among adjacent bands, resulting in information redundancy, as well as the substantial volume of HSI data necessitating computationally intensive operations. Employing data dimensionalityreductiontechniquesbecomesimperative in mitigating these challenges. Notably, such techniques not only alleviate data redundancy but also curtail the computational burden associated with processing largescaleHSIdatasets.
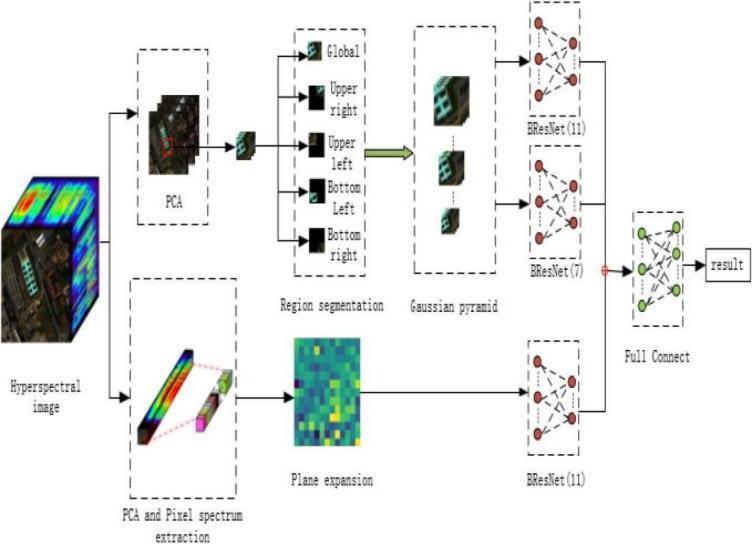
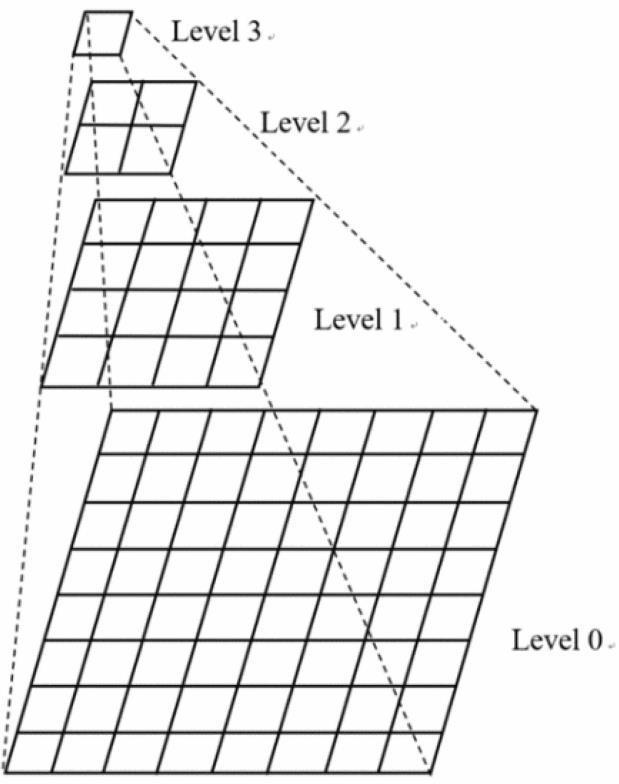
Fig. 3. OverallflowchartoftheproposedDRB-ResNet.
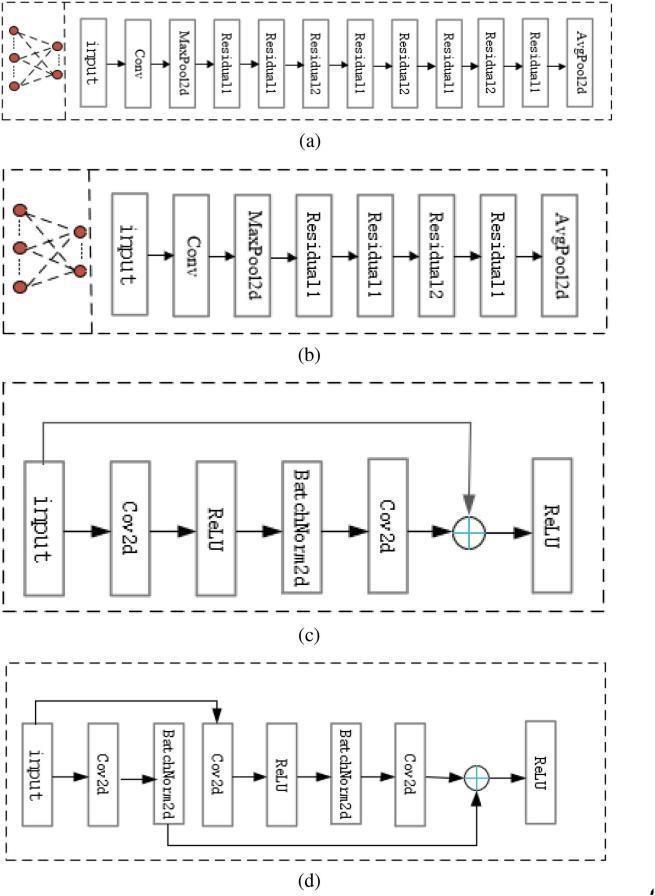
Fig. 4. DRB-ResNetstructureandresidualblock structure.(a)DRB-ResNet(11).(b)DRB-Resnet(7).(c) Residualblock1.(d)Residualblock2.
Additionally, hyperspectral imaging (HSI) presents numerouschallengingissues,includingbandredundancy and significant noise interference. To address these challenges, various dimensionality reduction techniques havebeendevelopedtoextractpertinentinformationfrom images while simultaneously reducing computational complexity. These methods encompass linear principle analysis, probabilistic principal component analysis (PPCA),kernel principal componentanalysis(KPCA),and neighbor-independent component analysis (ICA). In this study, we opted for the PCA method, a widely utilized dimensionalityreductionapproach.PCAtransformsaset of potentially correlated variables into a set of linearly uncorrelatedvariablesthroughorthogonaltransformation, withtheresultingvariablestermedprincipalcomponents. Notably,PCA stands outas one of the simplestand most efficient dimensionality reduction methods available. Hence, this paper employs the PCA algorithm to achieve dimensionalityreductioninHSIprocessing.
Furthermore, there exists a significant correlation betweenadjacentpixelsin animage, encompassing both texture and grayscale levels. Objects with small sizes or low contrasts often necessitate higher resolutions for
International Research Journal of Engineering and Technology (IRJET) e-ISSN: 2395-0056 p-ISSN: 2395-0072
Volume: 11 Issue: 04 | Apr 2024 www.irjet.net
accurate observation, whereas larger objects or those with high contrasts may suffice with lower resolutions. Such variations are commonplace in hyperspectral images (HSIs), necessitating multiresolution processing strategies. Gaussian pyramids, a type of multiscale representation in images, offer an effective and intuitivelysimpleframeworkforanalyzingimagesacross multiple resolutions. Initially employed in machine vision and image compression, an image pyramid comprises a series of images arranged in a hierarchical structure with progressively decreasing resolutions, all derived from the same original image collection. This hierarchical structure is achieved through iterative downsampling until a predefined termination condition is met. At the base of the pyramid lies a high-resolution representation of the image, while the apex corresponds to a low-resolution approximation. Analogously, each layer of the pyramid can be likened to a tier, with a higher number of layers yielding smaller images and lower resolutions. Gaussian pyramids facilitate the scaling of images to obtain multiscale representations, enabling subsequent multiscale analyses.To address the high-dimensional nature of features in hyperspectral images (HSIs), we can employ the PCA technique to reduce the dimensionality of the data before engaging GaussianpyramidsformultiscaleprocessingofHSIdata.
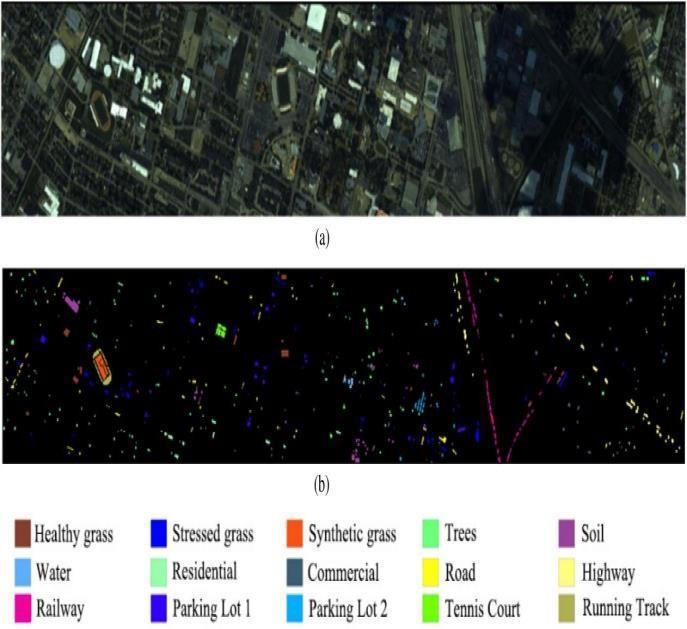
Fig. 5. For experimental datasets. (a) False-color image oftheHoustondata.(b)GroundtruthoftheHoustondata.
We employ Gaussian pyramids and multiregion pixel segmentationtopreprocesstheoriginaldata.Initially,asmall rectangularareatraversestheoriginalimage,ensuringthat pointsforclassificationresideatthecenterofeachrectangular
area. By moving the rectangulararea to positionthe points at the corners, five rectangular images are generated. Subsequently, Gaussian pyramid processing is applied to the segmented regionstoyieldmultiscaleimagedataacrossdifferentregions.For spectral data, we utilize the PCA algorithm to reduce data dimensionalitytoapredefinedlevelbeforeexpandingitintoa2-D image format. Notably, we introduce spectral imaging methodology for the first time to represent spectral data as image data, followed by spectral feature extraction via convolutional networks. Moreover, employing multiregion segmentation and Gaussian pyramids allows for the extractionof spatial information from pixels, facilitating the fusion oflocaland global spatial features to capture more nuanced spatial characteristics. The classification of HSIs using this approach demonstrates outstanding performance. The primary contributionsof thisstudycan besummarizedasfollows:Firstly,we partitionthedataintomultipleregions tocapturediversespatial informationcorresponding to the same pixel across theseregions. Subsequently,weapply the Gaussian pyramiddownsampling method to the segmented data, enabling the extraction of multiscale data and spatial information across differentscales. For spectral data processing, we introduce a novel spectral imagingtechnique,transformingspectraldataintoimageformat, and utilize a feature extraction network to extract intricate spectral details effectively. Secondly, we introduce a dual-branch feature extraction network architecture, leveraging two separate branches to extract spectral and spatial features, respectively. This dual-branch approach enhancestheclassificationaccuracyandrobustnessofthenetwork by enabling the extraction of distinct features through parallel pathways.Theabovepartiscombinedwiththeextractedfeatures ofthebelowpartandmadeasthefully connectedlayerand giventotheclassifiertoenhancetheclassificationaccuracyof theclassifier.
Our hyperspectral image (HSI) classification method comprises two key components. The first component employsthePCAalgorithmtoreducethedimensionality of the original data and subsequentlydivides the resulting dataintofiveregions.Pixelsdesignated for classification are positioned at the center of rectangular areas, while additional pixels forclassification are placed at the four corners of each rectangular area upon movement. Gaussian pyramiddownsampling is then applied to the resulting image data from the five rectangular areas, yielding multiscale and multiresolution image data.The second component begins with PCA dimensionality reductionontheoriginal data. Subsequently, spectraldata for each pixel slated for classification is extracted and expanded intoanimageformat.Distinct ResNet networks with varying structures are utilized to extract spatial andspectral features, respectively. Finally, the spatial and spectralfeatureextractionnetworksarecombined,and
International Research Journal of Engineering and Technology (IRJET) e-ISSN: 2395-0056 p-ISSN: 2395-0072
Volume: 11 Issue: 04 | Apr 2024 www.irjet.net
the resultant features are fed into a fully connected network to obtain the final classification result.The proposed DRB-ResNet model leverages the aforementioned five regions as input, extracting spatial and spectral features via the "multiscale" module within a meticulously designed ResNet network and the "spectral imaging" module. This innovative approach enhances feature extraction capabilities, ultimately improving classification accuracy and robustness DetailsaredescribedinthefollowingSectionII-A–C.
2.1. Multiscale Feature Extraction of Multiregion Gaussian Pyramid.
WeemploythePCAalgorithmtoreducethedimensionality of hyperspectral image (HSI) data. PCA extracts the primary feature components from the data while discarding redundant information, thereby reducing data dimensionality.Thisprocessisessentialformitigatingthe curseofdimensionalityandenhancingdatadensity.
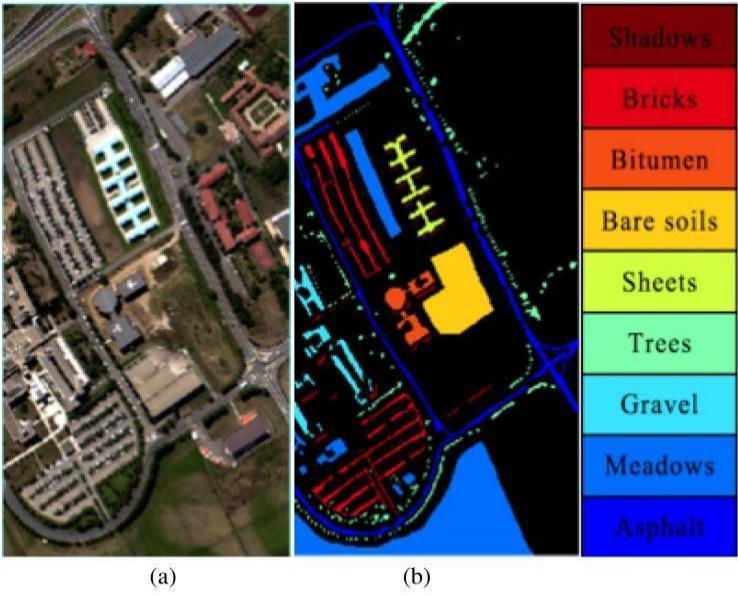
Fig. 6. Forexperimentaldatasets. (a) False-colorimage oftheUniversityofPaviadata.(b)Groundtruthofthe UniversityofPaviadata.
Particularly in the presence of noise,PCA identifies eigenvectors associated with smallest eigenvalues which often corresponds to noise components.By discarding theseeigenvectors,PCAeffectivelyreducesthenoiselevels in the data.Furthermore,PCA not only compress the data intolowerdimensionsbutalsoensuresthatthefeaturesof the data,post dimensionalityreduction mutually independent.Dimensionality reduction serves to preserve the most essential features within high-dimensional data whilefilteringoutnoiseandirrelevantfeatures,leadingto enhanced data processing efficiency. In practical applications,reducingthedimensionalityofdatawithinan acceptable range of information loss can significantly reducestoragecostsand processing time.Following PCA
dimensionality reduction, each pixel designated for classification undergoes segmentation, wherein a small area of 11×11 centered around the pixel is extracted. Subsequently, these segments are repositioned within a square bounding box, ensuring that the pixels to be classified occupy the upper-left, upper-right, lower-left, and lower-right corners of the box, along with the inclusion of the initially extracted global block. This approach facilitates the extraction of spatial information fromhyperspectralimaging(HSI)data.Forregionalblocks indifferentdirections,moredetailedspatialrelationships canbeobtained,andeventhedissimilaritiesorsimilarities between different categories shown in the Fig. 1(a) indicates the global segmentation area of the pixels to be classified,Fig.1(b)indicatesthatthepixelstobeclassified areintheupper-leftcorner ofthesegmentationarea,Fig. 1(c)indicatesthatthepixelstobeclassifiedareplacedinthe upper-right of the segmentation area corner, Fig. 1(d) indicates that the pixels to be classified are placed in the lower-leftcorner,andFig.1(e)indicatesthatthepixelsto be classified are placed in the lower-right corner of the segmentationarea.
size.
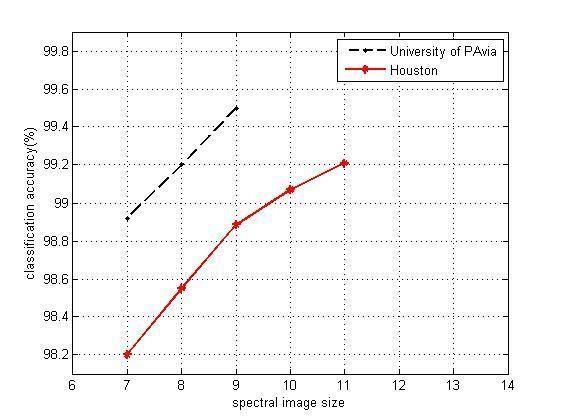
8. Classificationaccuracy(%)ofthreedatasetsat differentspectral imagingsizes.
International Research Journal of Engineering and Technology (IRJET) e-ISSN: 2395-0056 p-ISSN: 2395-0072
Volume: 11 Issue: 04 | Apr 2024 www.irjet.net
By situating the feature extraction network in this manner, it can acquire heightened spatial intricacies around individual pixels, particularly those residing at the interface of two distinct classes. Pixels belonging to different categories at these boundaries often exhibit highsimilarity.However,throughtheimplementationof multiregion segmentation, disparities between pixels within various regions are accentuated, thereby facilitating the network's ability to discern differences between the two categories. Although multiregion segmentation does impose an increased computational load, it concurrently enhances classification accuracy.Gaussian pyramid decomposition entails generating a sequence of images using a low-pass samplingfilter,resultinginprogressivelylowersampling densities compared to the preceding image. In this context, Gaussian filtering and downsampling are applied to the data derived from the PCA algorithm to diminish dimensionality and segment the initial hyperspectral imaging (HSI) data. Initially, the base image is convolved with a Gaussian kernel, followed by downsampling to produce the subsequent higher-level image. Subsequently, this image serves as input for further iterations of convolution and downsampling operations,yieldingsuccessivehigher-levelimages.
The Guassian pyramid is formed through repeated iterations.AsshownintheFig.2,itisaGaussianpyramid structure.The overall structure of the image is obtained byperformingthesamestepsfordownsamplingtoobtain the processed image. The same processing is applied to theHSIsothattheHSIcan beanalyzedatmultiplescales, anddifferentspatialfeaturescanbeavailableatdifferent scales.It classifies with different layers of the ResNet Network. Each layer of the pyramid is produced by the followingformulaL1representstheupperlayerthathas tobegeneratedandLl-1 isthelowerpartofthepyramid iscalculatedbytheF functiontoobtain theupperlayer representation.Iteratively calculate the value of the imagepixel bythefollowingformula:
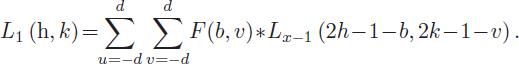
The*istheconvolutionoperation. x ∈{1, 2, 3, ·· ·,X}, X isthetotalamountoflayersoftheGaussianpyramid. F (b,v)is(2d +1)×(2d +1)Gaussianwindow,whichcan bedefined
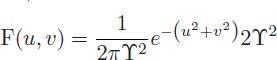
where Υ is the variance of the Gaussian filter in the Gaussianpyramidoperation.TheGaussianpyramidis formed by stacking one picture of different scales {L1, L2, L3, ···,Ll},whichisgeneratedbytheaboveequation
Spectral feature changes cannot reflect the similarity betweenfeaturesordistinguishtheboundariesoffeatures, and multiscale feature analysis can effectively solve this problem and improve the accuracy of HSI classification. The Gaussian pyramid can effectively transform the HSI into a multiscale structure, which can extract features at multiple scales by stepwise sampling or downsampling. We obtain multiscale images by performing Gaussian pyramid processing on each segmented area, and then arrange the images of the same scale into a new dataset, andfinallyputthemintothefeatureextractionnetworkfor multiscalefeatureextraction.
Each material exhibits distinct spectral characteristics in terms of absorption, reflection, and radiation. Objects within the same spectral region manifest varying degrees ofreflectionandabsorptionofradiationspectra,andeven identical objects exhibit noticeable differences in reflection across different spectra. Furthermore, environmental conditions such as sunlight angles contribute to variations in reflection and absorption spectra for the same object at different times and locations. During satellite sensor imaging processes, practical factors such as uncompensated atmospheric effects, sensor errors, and solar zenith angles can induce alterations in hyperspectral imaging (HSI) spectra . Additionally, biological dynamics represent another significant factor. For instance, benthic organisms inhabiting underwater environments may display differing reflectance spectra in water . Moreover, the presence of pests and diseases can also cause distinct spectral variations in otherwise similar crops. In these cases,evenwhenthesensorisutilizedtoimage
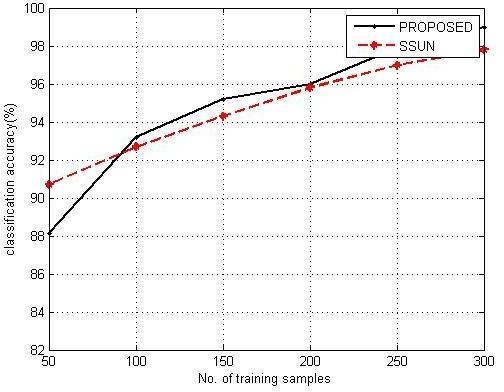
Fig. 9. Classificationaccuracy(%)ofdifferentmethodsin theHoustondatasetoverdifferentnumbersoftraining samples
mayvary.Forthiskindofproblem,thisarticledivideseach pixelinthedatasetinto 1×1×L (L representsthenumberof bands) and then performs the dimensionality
International Research Journal of Engineering and Technology (IRJET) e-ISSN: 2395-0056 p-ISSN: 2395-0072
Volume: 11 Issue: 04 | Apr 2024 www.irjet.net
reduction. Expand the reduced image into a picture. By unfoldingitintoapicture,discretespectraofsimilarcrops duetoanomaliesincertainspectralbandscanbeavoided. And by unfolding it into a picture, the network model can ignore some features that are unique in the spectrum of similar crops owing to spectral anomalies, which can improve its robustness and accuracy. Expand it into a picture, make each band value the value of a pixel on the picture, and then extract features through a feature extractionnetwork.Featureextractioninmultipleregions canreducetheincidenceofabnormalspectralsegmentson classification,therebyimprovingclassificationaccuracy.
This study utilizes a residual network model augmented with batch normalization. This technique standardizes batch data distribution, averting gradient vanishing and expediting calculations. It adjusts activation means towards 0 and standard deviations towards 1. The formulaisasfollows:
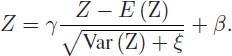
Among them, Z represents the output after batch normaliza- tion, E (Z) and Var (Z) represent the expectation and variance of Z, respectively, and γ and β are the hyperparameters that need to be learned to get thebest.ForHSIdata withdifferentwindowsizes,DRBResNet networks with different structures are used. After multiscale processing of the data in a Gaussian pyramid,imagesofdifferentsizesaregenerated.Inorder to prevent the use of the same network structure, the obtained features cannot be changed due to the small size of the picture, and different network structures are usedforpicturesofdifferentsizes.Forlarge-sizedimages, a deeper network is used to extract features, while for small-sized images, a shallower network is used to extractfeaturestopreventthenetworkfromoverfitting.
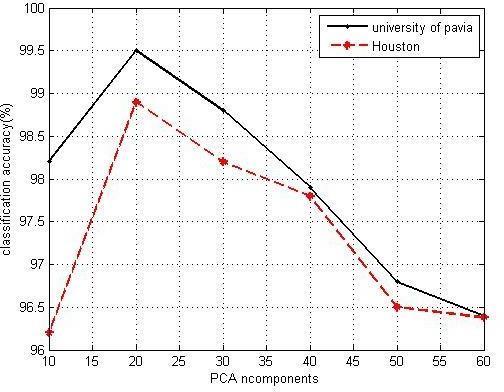
Fig. 10. Classificationaccuracy(%)ofthreedatasetsat different n_componentsofPCA.
This article mainly uses two networks of different depths.TheoverallnetworkstructureisshowninFig.3. The upper part performs PCA dimensionality reduction onselectedpartsoftheoriginaldataandthendividesthe dataintoregions.Thepixelsthatneedtobeclassifiedare placedinthefourcornersandthecenteroftheselected size area, and finally, a multiscale image is obtained throughGaussianfilteringanddownsampling.Imagesof the same size are sequentially arranged into a DRBResNet network with a specified depth for training, the feature extrac- tion data of each region are added, and finally,theresultsareoutputthroughthefullyconnected network.Thisarticleuses afour-layerGaussianpyramid formultiscaleanalysis.Thefirstandsecondlayersuse a deep network, such as Fig. 4(a), the third layer uses a shallow network, such as Fig. 4(b), the last layer is directlyconnectedtotheoutputbecausetheimagesizeis toosmall.Thelowerhalfoftheentirenetworkisusedto extract spectral features. First, the spectral information of each pixel to be classified is dimensionally reduced, and then expanded into N×N pictures, and then put into thedeepDRB-ResNetnetworkforfeatureextraction,and finally combined The feature extraction results of the upper half and the lower half is used to obtain the final classificationresultusingthefullyconnectednetwork.Fig. 4(a) and (b) are deep and shallow feature extraction networks used to extract features, consisting of two residualsinFig.4,whicharecombinedfrom(c)and(d). In practical scenarios, orientation-based regions exhibit minimalcancellationowingtotheexistenceofpositional anisotropy properties. Nonetheless, it's evident that classificationoutcomesvarysignificantlyacrossdifferent block types, suggesting diverse contextual distributions possess varying generalization capabilities for classification tasks. The experimental findings on fusion strategies undeniably highlight potential for improvement.Thus,theproposedDRB-ResNetmodelcan enhance accuracy by providing a more resilient feature representation, considering multiple potential distributions.
In this section, we validate the effectiveness of our pro- posed DRB-ResNet on two generic datasets and compare it with contemporary state-of-the-art HSI classification methods. The experiments in our study utilize Python for programming, with network models constructedusingthePyTorchdeeplearningframework withinthePythonenvironment.PyTorchisawidelyused open-source machine learning library known for its flexibility and efficiency in customizing deep learning models.
International Research Journal of Engineering and Technology (IRJET) e-ISSN: 2395-0056 p-ISSN: 2395-0072
Volume: 11 Issue: 04 | Apr 2024 www.irjet.net
ABLE 2-NUMBEROFTRAININGANDTESTINGSAMPLESFORTHE PAVIADATASET

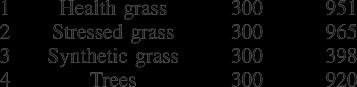
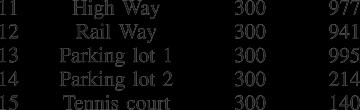
To validate the effectiveness of our proposed method, we verified the classification performance of our proposed DRB- RESNET on three generic datasets (theHoustondataset,Uni-versityofPavia dataset,and), as shown in Figs. 5 and 6. The pseudocolor maps, label maps, and their category representation colors for the two datasets. For these two datasets. the Houston dataset consists of 349 × 1905 pixels. Houston dataset, providedbythe2013IEEEGRSSDataFusion
Competition, was acquired on the University of Houston campus and adjacent areas with a compact airborne spectral imager (manufactured by ITRE Canada). It collects a dataset of 144 spectral channels covering0.364–1.046 μm.Forthe15differentclassesin the Houston dataset, the sample sizes for the training andtestsetsareshowninTableI.
The second dataset (University of Pavia) was acquired by the ROSIS sensor. It has 610×340 pixels and the sensor has a total of 115 bands. after processing, the University of Pavia dataset contains 103 bands with a coverageof0.43–0.86 μmandaspatialresolutionof1.3m.
About 42 76 pixels in the dataset have been labeled and dividedintoninecategories,asshowninTableII.
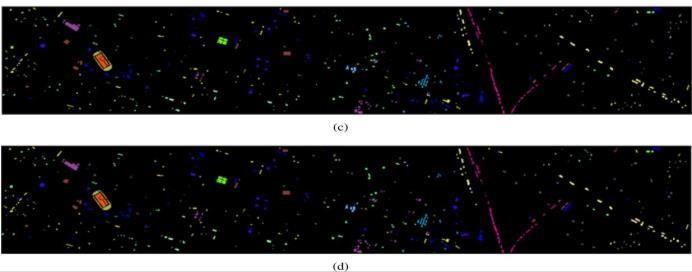
Fig. 11. ClassificationmapsfromtheproposedDRBRESNETandthebaselinesontheHoustonData. (c)SSUN: 97.21%.(d)DRB-RESNET:99.34%.
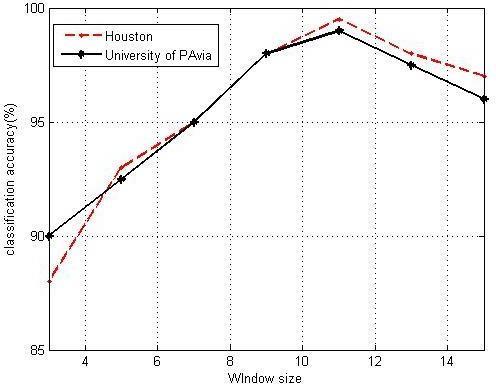
Forthepixelsusedfortrainingandtesting,wetakea range of rectangular regions around them. The training andtestingpixelsareplacedinthecenteroftherectangle, and on this basis, the rectangular area is moved to place the training and testing pixels in the four corners of the rectangle, to extract the spatial features around the pixels,andfinally,themulti- regionimageisputintothe convolutional layer for featureextraction, and the size of the region will affect the final classification performance of our proposed DRB-ResNet, so we empirically set in this article, we empirically set the region size to 11×11, and finally discuss the effect of different size rectangles on the performance of DRBResNet,asshowninFig.7.
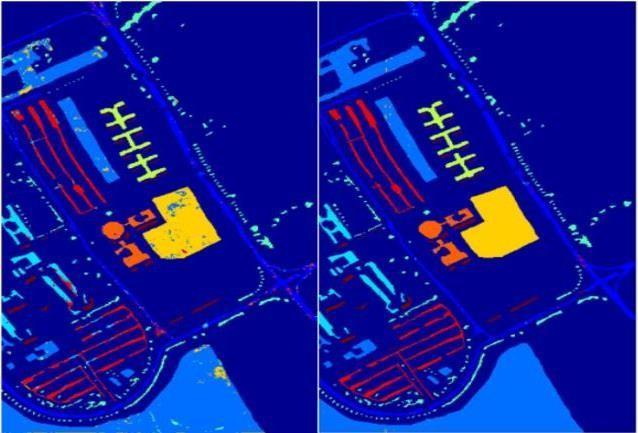
Fig. 12.ClassificationmapsfromtheproposedDRBRESNETandthebaselinesontheUniversityofPaviaData (a)SSUN:99.45%.and (b)DRB-RESNET:99.63%.
In addition, the optimizer in this article uses Adam, which combines the updated ideas of adaptive learning strategiesAda-gradandMomentum.TheAdamalgorithm is derived from traditional gradient descent. All weights are updated at a single learning rate. The rate does not change during the training process, and Adam designs
International Research Journal of Engineering and Technology (IRJET) e-ISSN: 2395-0056 p-ISSN: 2395-0072
Volume: 11 Issue: 04 | Apr 2024 www.irjet.net
independent adaptive learning al- gorithms for different parameters by combining the first-order moment estimationwiththesecond-ordermomentestimationofthe gradient.TheauthoroftheAdamalgorithmdefinesitastwo kinds of gradient descent. An extended collection of advantages.Inthisarticle,wesettheinitiallearningrateto 0.001 and different batch sizes. Fig. 7 shows the classification performance of the rectangular area under differentwindowsizes.Thatisfrom3×3to15×15.
When the window size is 11×11, the performance tends to be satisfactory. When the window size is 11×11, itisnotthebestwindowsizeforallexperimentaldatasets. For example, the red curve indicates that the square area 11×11 is the best window size of the University of Pavia dataset,andthebluecurveindicatesthatthebestwindow sizeoftheHoustondatasetis11×11,andWhenconverting spectral data into pictures, the best picture size of the Houston dataset is 11×11, and the best picture size of the UniversityofPaviadatasetis9×9.Thenumberofbandsin the two datasets in this article is different, the expansion size and the classification effect of different sizes are also different. For example, the Pavia dataset can only be expanded to 9×9, and the Houston dataset can only be expanded to 11×11, as shown in Fig. 8. Therefore, we choosearelativelylargesize(forexample,11×11,whilethe Pavia dataset expands to 9×9) among the allowed hardware resources to prevent the waste of hardware resourcesandbeyondthescopeofhardwareuse.
TABLE 3-COMPARISONOFTHECLASSIFICATIONACCURACY(%) AMONGTHEPROPOSEDMETHODANDTHEBASELINESUSINGTHE HOUSTONDATA
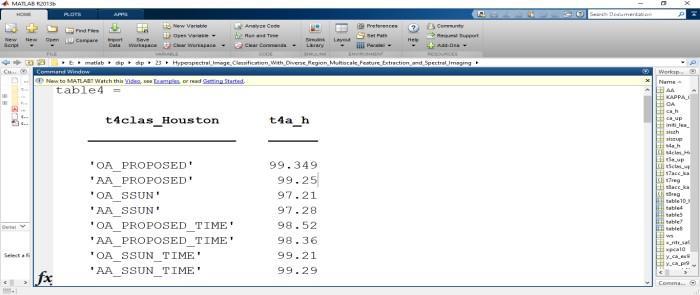
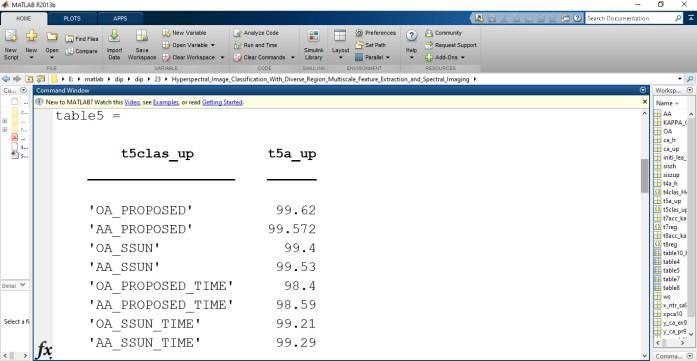
TABLE 4-COMPARISONOFTHECLASSIFICATIONACCURACY(%) AMONGTHEPROPOSEDMETHODANDTHEBASELINESUSINGTHE UNIVERSITYOFPAVIADATA
We tested different initial learning rates on the Houstondatasetforthetrainedhyperparametriclearning rates,asshowninTableX,wecanseetheperformanceof different initial learn- ing rates for OA, AA, and Kappa Coefficient. We can conclude that the size of the initial learning rate has quite a big impact on the final results, and too large a learning rate will reduce the final classificationresults.Inthisarticle,thelearningrateisset to 0.001 for the best classification performance. Therefore,inthesubsequentexperiments,ourproposed DRB-ResNetwilluse0.001aslearningrate.
Theexperimentalresultsofthefourmethodsbasedon the Houston dataset are shown in Fig. 9 The number of initialtraining samples for each class ranges from 50 to 300, with a pairwise interval of 50. We can get that, for all methods compared, the classification accuracy increases as the number of training samples increases. Whenthe number oftrainingsamplesisinthe rangeof 150–300, our method can always maintain the best classificationperformance.
We conducted experiments on the parameter n_components (dimension reduction) of the PCA algorithm in three datasets, as shown in Fig. 10, we foundthatasthedata dimensionincreasedfrom10to 20, the data classification accuracy also increased, but when the data dimension increased from 20 to 60, the data classification accuracy begins to decrease. Therefore, when reducing the dimensionality of the dataset,setthen_componentsparameterto20.
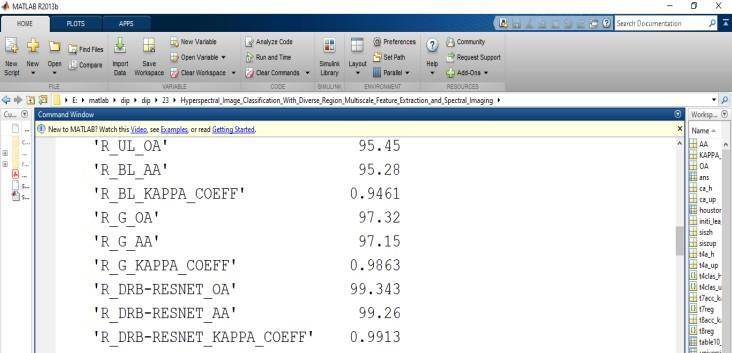
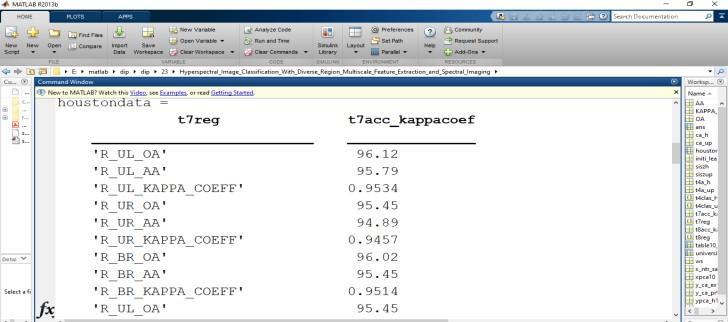
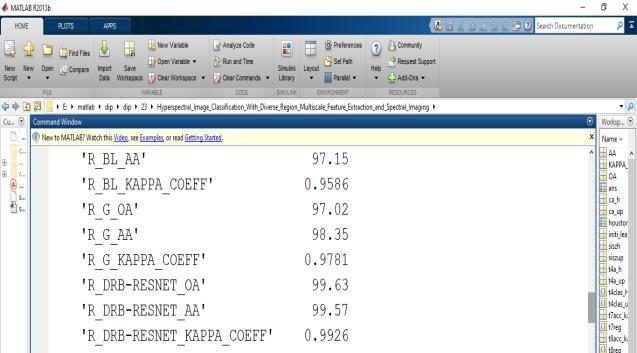
Tables VII–IX list the overall accuracy(OA), average accu- racy (AA), and Kappa coefficients using different regions and the proposed fusion strategy. RUR represents the region of upper right, RUL represents the region of upper left, RBR represents the region of bottom right, RBL representsthe region of bottomleft, and RG representstheregionofglobal.Theresultsshow that due to the existence of positional anisotropy, the performance of single-region-based classification is very limited, and it is obvious that the classification results have great differences in different regions, whichindicatesthatvariouscontextdistribu-tionshave differentgeneralizationcapabilitiesforclassification.As to which region classification works better, it largely dependsontheactualdistributionofthedata,andour experimental results using the fusion strategy can definitely be improved. Therefore, the proposed DRBResNet achieves the best accuracy as it has a more robust feature representation considering multiple possibledistributions.
OurproposedDRB-RESNETmethodiscomparedwith cur- rent advanced HSI classification method, such as SSUN OA,andAAindicatetheclassificationperformance
International Research Journal of Engineering and Technology (IRJET) e-ISSN: 2395-0056 p-ISSN: 2395-0072
Volume: 11 Issue: 04 | Apr 2024 www.irjet.net
of different methods on several datasets. Among them, the “Proposed (NS)” represents that the data without spectral imaging is input into a two-branch feature extractionnetwork.Andthe“Proposed”representsthatwe spectral and spatial features.And selection method for dataset segmentation,for each category of data we randomlyselectdifferentdatafortrainingandremaining data for testing.The experimental results we obtained showthattheclassificationaccuracybasedonjoint

spatialandspectralfeaturesishigherthanthatusingonlyone of these features,and our proposed DRB-Resnet model out performsotherclassifiersintermsofclassificationaccuracy.
And selection method for dataset segmentation,for each category of data we randomly select different data for trainingandremainingdatafortesting.The experimental resultsweobtainedshowthattheclassificationaccuracy basedonjointspatialand spectralfeaturesishigherthan that using only one of these features,and our proposed DRB-Resnet model out performs other classifiers in terms of classification accuracy. we can obtain the accuracy of our proposed DRB-ResNet as 99.76%, which is about 2.13% higher compared to SSUN (97.21%). A similar performance also exists for experiments conducted on other datasets. The classification performance of our proposedmethodontheUniversity of Pavia dataset, Houston, is approximately 2%, 1% betterthantheotherclassificationmethodscomparedto the other methods.Figs. 4–5 show the graphs of the classificationresultsforeachclassifier,andthe graphs showthattheclassificationresultsareconsistentwith the classification results in Tables IV and V. By the presentation of the images, we can visually see that compared with SSUN our proposed DRB-ResNet classification result graph has significantly fewer points of classification errors in many regions, so we can conclude that our DRB - ResNet classification method performs better than other classification methods.
Thisarticleproposesainnovativedual-branchnetwork utilizing multiscale multiregion Gaussian pyramid and spectral information imaging for hyperspectral image (HSI) classification. Initially, the image undergoes multiregion segmentation, followed by Gaussian pyramid processing on the graph to extract features across multiple scales. Subsequently, the dimensionality of each spectral data type is reduced to a predefined level and then expanded into an image. Thisprocesshelpsmitigatetheinfluenceofanomalous
spectral data on classification outcomes. The dualbranch network is adept at extracting both spatial and spectral information effectively. Experimental findings demonstrate superior performance of the proposed dual-branch method, leveraging multiscale multiregion
International Research Journal of Engineering and Technology (IRJET) e-ISSN: 2395-0056 p-ISSN: 2395-0072
Volume: 11 Issue: 04 | Apr 2024 www.irjet.net
Gaussian pyramid and spectral information imaging, compared to other state-of-the-art approaches across two datasets.
[1]D.Landgrebe,“Hyperspectralimagedataanalysis,” IEEE SignalProcess.Mag.,vol.19,no.1,pp.17–28,Jan.2002.
[2]X.Zheng, Y. Yuan,and X.Lu, “Dimensionality reduction by spatial spectral preservation in selected bands,” IEEE Trans. Geosci. Remote Sens., vol. 55, no. 9, pp. 5185–5197, Sep.2017.
[3]H. Li, Y. Song, and C. L. P. Chen, “Hyperspectral image classification based on multiscale spatial information fusion,” IEEE Trans. Geosci Remote Sens., vol. 55, no. 9, pp. 5302–5312,Sep.2017.
[4]L.LinandX.Song,“UsingCNNtoclassifyhyperspectral data based onspatial-spectral information,”in Advances in Intelligent Information Hiding and Multimedia Signal Processing, J.-S. Pan, P.-W. Tsai, and H.-C.Huang, Eds., Cham,Switzerland:Springer,2017,pp.61–68.
[5]L. Zhang, W. Wei, Y. Zhang, C. Shen, A. van den Hengel, andQ.Shi,“Clustersparsityfield:Aninternalhyperspectral imagery prior for reconstruction,” Int. J. Comput. Vis., vol. 126,no.8,pp.797–821,2018.
[6]S. Li, Q. Hao, G. Gao, and X. Kang, “The effect of ground truth on per formance evaluation of hyperspectral image classification,” IEEE Trans. Geosci. Remote Sens.,vol.56,no. 12,pp.7195–7206,Dec.2018.
[7]W.Wei,L.Zhang,Y.Jiao,C.Tian,C.Wang,andY.Zhang, “Intracluster structured low-rank matrix analysis method for hyperspectral denoising ” IEEE Trans. Geosci. Remote Sens.,vol.57,no.2,pp.866–880,Feb.2019.
[8]Z. Wu, Y. Li, A. Plaza, J. Li, F. Xiao, and Z. Wei, “Parallel and distributed dimensionality reduction of hyperspectral data on cloud computing architectures,” IEEE J. Sel. Top. Appl. Earth Observ. Remote Sens., vol. 9, no. 6, pp. 2270–2278,Jun.2016.
[9]K. Berger, C. Atzberger, M. Danner, M. Wocher, W. Mauser, and T. Hank, “Model-based optimization of spectral sampling for the retrieval of crop variables with the PROSAIL model,” Remote Sens., vol. 10, no. 12, 2018, Art.no.2063.
[10]I. Aneece l and P. Thenkabail, “Accuracies achieved in classifying five leading world crop types and their growth stages using optimal earth observing-1 hyperion hyperspectranarrowbands on Google Earth engine,”Remote Sens.,vol.10,no.12,2018,Art.no.2027.
[11]A. Marcinkowska-Ochtyra, A. Jaroci ´nska, K. BzdÄZga, and B. Tokarska-Guzik, “Classification of expansive grassland speciesindifferentgrowthstagesbasedonhyperspectraland lidardata,” RemoteSens.,vol.10,no.12,2018,Art.no.2019.
[12]A. Marcinkowska-Ochtyra, K. Gryguc, A. Ochtyra, D. Kope´c, A. Jaroci ´nska, and Ł. Sławik, “Multitemporal hyperspectral data fusion with topographic indicesimproving classification of natura 2000 grassland habitats,” Remote Sens.,vol.11,no.19,2019,Art.no.2264.
[13]C.Pelletier,S.Valero,J.Inglada,N.Champion,C. M.Sicre, and G. Dedieu, “Effect of training class label noise on classification performances for land cover mapping with satelliteimagetimeseries,” Remote Sens.,vol.9,no.2,2017, Art.no.173.
[14]Y. Zhong and L. Zhang, “An adaptive artificial immune network for supervised classification of multi-/hyperspectral remote sensing imagery,” IEEE Trans. Geosci. Remote Sens., vol.50,no.3,pp.894–909,Mar.2012.
[15]B. Tu, X. Yang, N. Li, C. Zhou, and D. He, “Hyperspectral anomaly detection via density peak clustering,” Pattern Recognit. Lett., vol. 129, pp. 144–149, 2020. [Online]. Available: https://www.sciencedirect.com/science/article/pii/S0167 865519303423
[16]J. Sun et al., “Deep clustering with intraclass distance constraint for hyperspectral images,” IEEE Trans. Geosci. RemoteSens.,vol.59,no.5,pp.4135–4149,May2021.
[17]X. Xu, W. Li, Q. Ran, Q. Du, L. Gao, and B. Zhang, “Multisource remote sensing data classification based on convolutional neural network,” IEEE Trans. Geosci. Remote Sens.,vol.56,no.2,pp.937–949,Feb.2018.
[18]Ham, Y. Chen, M. Crawford, and J.Ghosh,“Investigation of the random forest framework for classification of hyperspectral data,” IEEE Trans. Geosci. Remote Sens., vol. 43,no.3,pp.492–501,Mar.2005.
[19]M. Belgiu and L. Dr˘agu¸t, “Random forest in remote sensing: A review of applications and future directions,”ISPRS J. Photogrammetry Remote Sens., vol. 114, pp.24–31,2016.
[20]Y. Xu, B. Du, F. Zhang, and L. Zhang, “Hyperspectral imageclassificationviaarandompatchesnetwork,” ISPRSJ. PhotogrammetryRemoteSens.,vol.142,pp.344–357,2018.
[21]X. Kang, S. Li, and J. A. Benediktsson, “Spectral-spatial hyperspectral image classification with edge-preserving filtering,” IEEE Trans. Geosci.RemoteSens.,vol.52,no.5,pp. 2666–2677,May2014.
© 2024, IRJET | Impact Factor value: 8.226 | ISO 9001:2008 Certified Journal | Page785
International Research Journal of Engineering and Technology (IRJET) e-ISSN: 2395-0056 p-ISSN: 2395-0072
Volume: 11 Issue: 04 | Apr 2024 www.irjet.net
[22]L.Fang,S.Li,X.Kang,andJ.A.Benediktsson,“Spectralspatial hyperspectral image classification via multiscale adaptivesparserepresentation,” IEEETrans. Geosci. Remote Sens.,vol.52,no.12,pp.7738–7749,Dec.2014.
[23]L.He,J.Li,A.Plaza,andY.Li,“Discriminativelow-rank Gabor filtering for spectral-spatial hyperspectral image classification,” IEEE Trans. Geosci. Remote Sens., vol. 55, no. 3,pp.1381–1395,Mar.2017.
[24]D. Xu et al., “Hyperspectral image classification based on hierarchical guidance filtering and nearest regularized subspace,” Acta Photonica Sinica, vol. 49, no. 4, pp. 197–209,2020.
[25]B. Xiaojun and Z. Zengyu, “Hyperspectral image classification algorithm based on two-channel generative adversarialnetwork,” Acta OpticaSinica,vol.39,no.10, pp. 297–308,2019.
[26]E. Pan et al., “Spectral-spatial classification of hyperspectralimagebased ona jointattentionnetwork,”in Proc. IGARSS IEEE Int. Geosci. Remote Sens. Symp., 2019,pp. 413–416.
[27]R. Li, S. Zheng, C. Duan, Y. Yang, and X. Wang,“Classification of hyperspectral image based on double- branch dual-attention mechanism network,” RemoteSens.,vol.12,no.3,2020,Art.no.582.
[28]X.Tang etal.,“Hyperspectralimageclassificationbased on 3-D octave convolution with spatial-spectral attention network,” IEEETrans.Geosci.RemoteSens.,vol.59,no.3,pp. 2430–2447,Mar.2021.
[29]L.Mou,P.Ghamisi,andX.X.Zhu,“Deeprecurrentneural networks for hyperspectral image classification,” IEEE Trans. Geosci.RemoteSens.,vol.55,no.7,pp.3639–3655,Jul.2017.
[30]Y. Chen et al., “Drop an octave: Reducing spatial redundancy in convolutional neural networks with octave convolution,” in Proc. IEEE/CVF Int. Conf. Comput. Vis., 2019, pp.3435–3444.
[31]Y. Chen, H. Jiang, C. Li, X. Jia, and P. Ghamisi, “Deep feature extraction and classification of hyperspectral images based on convolutional neural networks,” IEEE Trans. Geosci. RemoteSens.,vol.54,no.10,pp.6232–6251,Oct.2016.
[32]Y. Xu, L. Zhang, B. Du, and F. Zhang, “Spectral–spatial unifiednetworksforhyperspectralimageclassification,” IEEE Trans. Geosci. Remote Sens., vol. 56, no. 10, pp. 5893– 5909, Oct.2018.
[33]J.Zhu,L.Fang,andP.Ghamisi,“Deformableconvolutional neural net works for hyperspectral image classification,” IEEEGeosci.RemoteSens.Lett.,vol.15,no.8,pp.1254–1258, Aug.2018.
[34]H. Lee and H. Kwon, “Going deeper with contextual CNN for hyperspectral image classification,” IEEE Trans. Image Process.,vol.26,no.10,pp.4843–4855,Oct.2017.
[35]K. Makantasis, K. Karantzalos, A. Doulamis, and N. Doulamis, “Deep supervised learning for hyperspectral data classificationthroughconvolutionalneuralnetworks,”in Proc. IEEEInt.Geosci.RemoteSens.Symp.,2015,pp.4959–4962.
[36]W. Li, G. Wu, F. Zhang, and Q. Du, “Hyperspectral image classification using deep pixel-pair features,” IEEE Trans. Geosci.RemoteSens.,vol.55,no.2,pp.844–853,Feb.2017.
[37]B. Waske, S. van der Linden, J. A. Benediktsson, A. Rabe, and P. Hostert, “Sensitivity of support vector machines to random feature selection in classification of hyperspectral data,” IEEE Trans. Geosci. Remote Sens.,vol. 48, no.7, pp. 2880–2889,Jul.2010.
[38]S. Prasad and L. M. Bruce, “Limitations of principal components analysis for hyperspectral target recognition,” IEEE Geosci. Remote Sens. Lett.,vol.5,no.4,pp.625–629,Oct. 2008.
[39]S. Li, Q. Hao, X. Kang, and J. A. Benediktsson, “Gaussian pyramid based multiscale feature fusion for hyperspectral image classification,” IEEE J. Sel. Top. Appl. Earth Observ. RemoteSens.,vol.11,no.9,pp.3312–3324,Sep.2018.
[40]G.A.ShawandH.K.Burke,“Spectralimagingforremote sensing,” LincolnLab.J.,vol.14,no.1,pp.3–28,2003.
[41]S. Jay et al., “Hyperspectral remote sensing of shallow waters:Consider ing environmental noise and bottom intraclass variability for modeling and inversion of water
reflectance,” Remote Sens. Environ., vol. 200, pp. 352–367, 2017.
[42]Y. Tarabalka, M. Fauvel, J. Chanussot, and J. A. Benediktsson, “SVM-and MRF-based method for accurate classificationofhyperspectralimages,” IEEE Geosci. Remote Sens.Lett.,vol.7,no.4,pp.736–740,Oct.2010.
[43]S. Mei, J. Ji, J. Hou, X. Li, and Q. Du, “Learning sensorspecific spatial spectral features of hyperspectral images via convolutional neural net works,” IEEE Trans. Geosci. RemoteSens.,vol.55,no.8,pp.4520–4533,Aug.2017.
[44]W. Hu, Y. Huang, L. Wei, F. Zhang, and H. Li, “Deep convolutional neural networks for hyperspectral image classification,” J.Sensors,vol.2015,2015,Art.no.258619
|