
International Research Journal of Engineering and Technology (IRJET) e-ISSN: 2395-0056
Volume: 11 Issue: 04 | Apr 2024 www.irjet.net
p-ISSN: 2395-0072
International Research Journal of Engineering and Technology (IRJET) e-ISSN: 2395-0056
Volume: 11 Issue: 04 | Apr 2024 www.irjet.net
p-ISSN: 2395-0072
Sindhu K N 1, Dr Rekha H B 2
1 MTech student, Department of Civil Engineering, UVCE, Bangalore University, Bengaluru
2Associate Professor Department of Civil Engineering, UVCE, Bangalore University, Bengaluru
Abstract - Drought is a natural disaster which impact lives in various ways andleads to great harm. Droughts are of four categories namely agricultural, hydrological, socioeconomic, and meteorological droughts. There are various types of indices that are being used worldwide to effectively monitor andassessdroughts.Thestudyaddressesthedifficultiesposed by droughts through the development of a meteorological drought index using fuzzy logic and adaptive neuro-fuzzy inference model. Various combinations of input variables, including maximum temperature, mean temperature, precipitation, and potential evapotranspiration, for the Ramanagara district of Karnataka state was used for model development.ResultsrevealedthattheRainfallAnomalyIndex (RAI) performed best among traditional indices, showing the highest correlation (0.862) with upper soil moisture, a key drought indicator. On the other hand, the average of the topperforming fuzzy logic (FL3) model surpassed all traditional indices, exhibiting a correlation of 0.983 with upper soil moisture. Notably, when the average output of the topperforming FL models has been utilized for training, the optimal ANFIS model achieved a correlation of 0.926 with upper soil moisture. To determine the developed models, drought assessments were conducted in four taluks across different seasons. The validation results indicated that the developed models performed comparably to the bestperforming traditional drought index (RAI) in most cases. In summary,thesoftcomputingdroughtindicesdevelopedinthis study, on the basis of fuzzy logic and ANFIS, outperformed traditional techniques, contributing significantly to more accurate drought prediction and mitigation actions.
Key Words: Drought, Fuzzy logic, ANFIS, Pearson correlation,meteorologicaldrought,conventionaldrought incices,soft-computingmodels.
Inrecentyears,theimpact ofclimatechangehasgaineda hugeneedformoresophisticatedtoolsandmethodologiesto assess and manage water resources. One of the critical effects of the climate change is drought, which pose a significant threat to agriculture, ecosystems, and human populationsworldwide.Traditionalmeteorologicaldrought indiceshaveprovenvaluable,yetthereremainsacompelling needforinnovativeapproacheswhichenhancesthecapacity tocharacterizeandgiveresponsetodroughtconditionswith greaterprecision.
Thestudy wastodevelopa Meteorological DroughtIndex (MDI)utilizingthefuzzylogic.Fuzzylogic,acomputational paradigminspiredbyhumanreasoning,hasgainedinterest in various scientific domains for its ability to handle uncertaintyandimprecisioninherentinreal-worlddata.By incorporating fuzzy logic into the realm of meteorological drought assessment, this research aims to offer a more nuancedperspectiveonthecomplexinteractionsbetween atmospheric variables that contribute to drought monitoring,assessment,andforecasting.
Conventional drought indices, including PDSI (Palmer DroughtSeverityIndex)andSPI(StandardizedPrecipitation Index),haveplayedcrucialrolesindroughtmonitoringand prediction (Mhamd Saifaldeen Oyounalsoud et.al. 2022). However,theseindicesoftenhavelimitationsincapturing the multifaceted nature of meteorological droughts, especiallywhenfacedwithirregularitiesanduncertaintiesin climatic data. The proposed MDI seeks to overcome these challengesbyharnessingtheflexibilityandadaptabilityof fuzzy logic, enabling a more dynamic representation of drought conditions that considers the inherent vagueness andambiguitywithinmeteorologicaldata.
Numerous researches have embraced soft computing techniques for drought monitoring and forecasting. For example,Abbasietal.(2019)usedtheGEP(GeneExpression Programming)modelinconjunctionwiththeStandardized Precipitation Evapotranspiration Index (SPEI) to forecast drought over a range of periods. The findings revealed an improvement in accuracy of model from 60.1% at SPEI1 (one-month scale) to 92.3 percent at SPEI48 (48-month scale), underscoring the enhancement in overall accuracy with increasing SPEI scale. Similarly, Keskin et al. (2009) employed the Standardized Precipitation Index (SPI) alongsideanadvanceddroughtanalysismodelincorporating FL(FuzzyLogic)andAdaptiveneurofuzzyinferencesystem (ANFIS)techniquesformeteorologicaldroughtassessment acrossninestationsinTurkeyatvaryingtimescales.Their findingshighlightedthehighefficacyofANFISinassessment ofdrought.Furthermore,Malik etal.(2020)presentedthe CANFIS (Co-active Neuro-Fuzzy Inference System), a contemporaryFLmodeldesignedtoforecastSPIatsixsites intheIndianstateofUttarakhandoverseveraltimescales. Conventional artificial intelligence models and regression were compared, and the outcomes demonstrated that the
International Research Journal of Engineering and Technology (IRJET) e-ISSN: 2395-0056
Volume: 11 Issue: 04 | Apr 2024 www.irjet.net p-ISSN: 2395-0072
CANFIS model performed better in SPI prediction as comapred to other 2 models. Rezaeian-Zadeh and Tabari (2012) discovered that heuristic techniques offer accurate prediction and can capture the fluctuations of SPIs irrespective of time scales, as Kuriqi et al. (2023) have reportedintheirresearch.Salloom(2022)suggestedaPID (Proportional-Integral-Derivative) control strategy to improve the neural network models' multi-step-ahead periodictimeseriespredictionperformance.
However, the study's focus was restricted to modeling conventional drought indexes. The newly developed AI models could only match the performance of the conventionalindicesemployedintheirformation,giventheir trainingdatacomprisedofactualoutputsfromconventional drought indices. Furthermore, there was not much associationobservedbetweentheperformanceofAImodels andotherindicesofenvironmentalandhydrologicaldrought.
In the study, a meteorological drought index based on FL rules that describe drought and major meteorological features relations was established. This approach aims to address the limitations from previous studies by incorporating a broader range of environmental and hydrological drought indicators into the modeling framework.
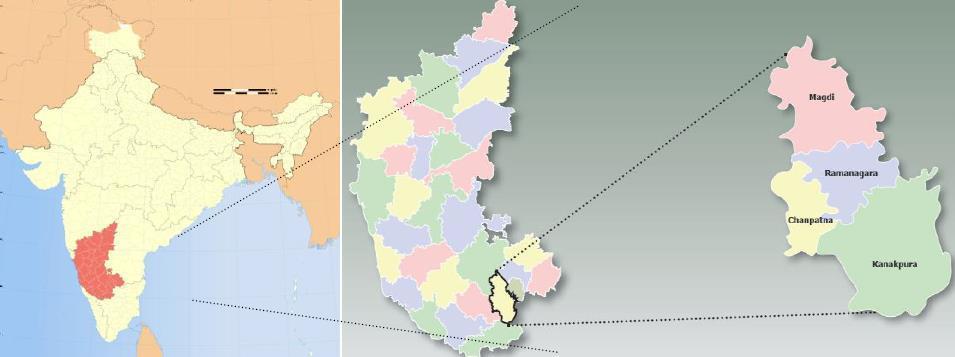
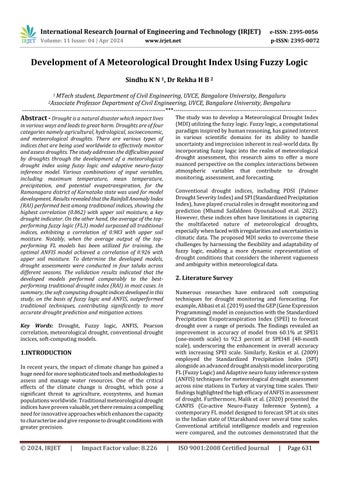
Fig-1: LocationMapandDistrictMapofRamnagara
Ramanagara district in the southern part of Karnataka covers3,410squarekilometers,belongstosemi-aridregion whichispronetodroughtduetopoorpercolationofrainfall through the soil. The location map of the study region is displayed in Fig. 1 (Srinivasareddy, 2018). In present research the four taluks of Ramanagara district were selectedwhichhavetheraingaugestationslocatedwithin thecoordinateslistedintable.1.
The Karnataka State Natural Disaster Monitoring Center provided the data. For every taluk, statistics on mean temperatures, maximum and monthly precipitation, and years1992to2022wereavailable Inadditiontothedata previouslyprovided,theindicatorsofdroughtincludeddata onrootzonesoilmoisture,deepsoilmoisture,andtopsoil moisture. For every taluk under study, once-a-month drought indicator data from 1992 to 2022 was obtained fromNASAPowerAcess.
Table-1: LatitudeandLongitudeoftheTaluksof Ramanagaradistrict.
Sl.No Taluk
1. Channapatna 12°39’ 77°12’
2. Kanakapura 12°33’ 77°25’
3. Magadi 12°57’ 77°13’
4. Ramanagara 12°43’ 77°16’
The goal of the study was toestablishan ANFIS and fuzzy logicmodelformonitoringofdroughtandassessment.Fig.2 givesthesummaryofthemethodologyfollowed.Theinput data like precipitation, maximum/mean temperature and PET were used. Three levels of soil moistures data were takenasdroughtindictors,thesewereuppersoilmoisture, rootzonesoilmoistureaswellaslower/deepsoilmoisture for the selected taluks. PET was estimated employing the hargreavesmethodusingDrincusingdatalikemaximumand minimumtemperatureandlatitude
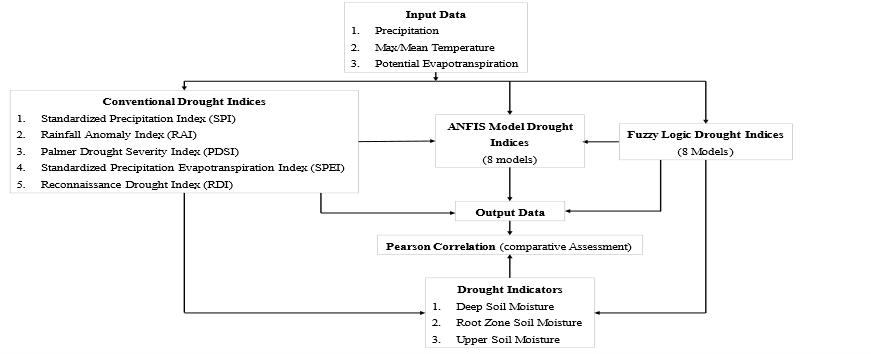
Fig-2: Flowchartofthemethodology.
International Research Journal of Engineering and Technology (IRJET) e-ISSN: 2395-0056
Volume: 11 Issue: 04 | Apr 2024 www.irjet.net p-ISSN: 2395-0072
TheDrincsoftwareaswellasRprogramwereusedinthe study to calculate five conventional drought indices: the PDSI, RDI (Reconnaissance Drought Index), RAI (Rainfall AnomalyIndex), SPI,andSPEI. Acomparativeassessment betweentheconventionaldroughtindexvaluesanddrought indicators(likedeepsoilmoisture,rootzonesoilmoisture and upper soil moisture) was done using Pearson correlation. Ultimately, the correlation was utilized to develop and assess the ANFIS and FL models, two soft computing models The ANFIS model was developed to improvethecapabilitiesoftheFLmodelusingtrainingand testingdata duringtheselectedperiods.
From 1992to 2022,fourtaluks inthestudyarea received conventionaldroughtindices,asstatedinthesectionabove. Inordertoevaluatetheextentanddurationofthedroughtin theresearchregion,thisstepwasrequired.Foreachindex,a differentsetofinputdatawasemployed.Thestudy'susageof droughtindicesissummarizedinTable2.
Table-2: Summarized listoftheconventionaldrought indices.
Conventional Drought Indices Input Range
StandardizedPrecipitation (SPI) P -3.00to 3.00
StandardizedPrecipitation EvapotranspirationIndex (SPEI)
PalmerDroughtSeverity Index(PDSI)
T,and PET
T,AWC, andL
to 2.00
to 4.00
Many applications requiring time-series data systems for control, classification, and prediction are examined in relationtoFLalgorithms(Wilbiketal.,2012).FLisfrequently utilizedintheliterature'sdroughtinvestigations(Ozgeretal., 2012; Sobhani et al., 2019). These research have demonstrated that FL is a suitable tool for analyzing and evaluating drought. The fuzzy inference engine, output, database,fuzzyinferenceengine,rulebase,defuzzifierunit, and input unit are among the various FL structure componentsdepictedinFig.3.Thelinguisticvariablesand termsareinitiallydefinedbythealgorithm.Totranslatethe measurementintofuzzyterms,forexample,ifthevariableto bemeasuredisprecipitation,arangeofdegreesmustbeset
[0,1].Fortheprocessesoffuzzificationanddefuzzification, membership functions must be developed. The non-fuzzy inputvaluesareconvertedtofuzzylinguistictermswiththe membershipfunction,andviceversa Theoutputvariableis controlledbythefuzzyrulesthatarewritten,AsimpleIFTHEN rule with a condition and a consequence is called a fuzzyrule.TheinferenceenginecreatesMFsandrules,then combinesthemtoproducethefuzzyoutput.Accordingtothe membershipfunction,thedefuzzificationprocedureyieldsa quantitativeresult.Afterthat,theoutputdataisconverted intononfuzzyvaluesandatableisproducedtoassessevery input with respect to its corresponding output (Bai and Wang,2006).

Eight FL models were created in the study with different inputparameterscombinations.Table.3givesthelistofthese eightdevelopedFLmodels.
Table-3: ListofDevelopedFuzzyLogicModels.
Thetable showsthatFL3had27rulestodefinethemodel also these rules help in the working of these models in differentoperatingscenarios.Theconstructedfuzzyrulebase statementisexemplifiedbythefollowingrule:TheFLindex ishighlywet,indicatingthewetconditions,ifprecipitationis highandthemaximumtemperatureislow.MATLABR2017a wasusedtocreateeachandeveryFLmodel.TheFL1model's rulesaredisplayedinatable4.
International Research Journal of Engineering and Technology (IRJET) e-ISSN: 2395-0056
Volume: 11 Issue: 04 | Apr 2024 www.irjet.net p-ISSN: 2395-0072
Modelingandforecastinghydrologicsystemsandprocesses hasbeenshowntobeanefficientuseofANFIS(Mokhtarzad et al., 2017). The FL models' inference system and the learningpowersofANNsarecombinedintheANFISmodel (Tagliabue et al., 2021). By using ANNs to automatically generatefuzzyrulesandoptimiseparameters,itaddresses the fundamental issues with fuzzy modeling, including defining membership function parameters and creating fuzzy IF-THEN rules (Mokhtarzad et al., 2017) A fuzzy inferencesystemhadbeenutilizedinthestudytoapplythe Takagi-Sugeno technique. Although the Sugeno output membershipfunctionsarelinearorconstant,thesefunctions are compatible with adaptive methods such as artificial neuralnetworks(ANNs)andalsocomputationallyefficient. UsingtheANNlearningtechnique,themembershipfunction parameters were adjusted throughout the training phase. TheANFISmodelcreatedforthestudyconsistsof9input membership functions, twenty-seven output membership functions,andtwenty-sevenfuzzyrules.
Fig-4: ANFISconfigurationusedinthisstudy.
Figure 4 illustrates the streamlined adaptive neuro-fuzzy inferencesystemthatresultsfromtheextensiveinteractions betweenallofthesystem'scomponents Thisisasimplified versionoftheANFISmodel thatconsistsofoneoutput(f) andtwoinputs(x&y).ThefivelayersoftheANFISmodel thatJang(1993)suggestedincludethecalculationsthatare outlinedbyEqs.(1)to(5)(Jang,1993):
Layer 1: In this layer, each node is adaptive, and its node functionisdeterminedas
Here T is denoted as the input to node i, and Ai is the linguisticlabelsetassociatedwithassociatednode.
Layer2:Thenodesofthislayersarefixednodelabelled(Π), whichrepresentsthefiringstrength(W)ofafuzzyrule.The outputofeverynodeistheproductoftheincomingsignals.
Layer3:Thefixednodes(N)inthislayercomputetheratio of the firing strengths of each rule to the total firing
strengths of all the rules. The outputs from this layer are calledthenormalisedfiringstrengthsandcanbecomputed asfollows:
(3)
Layer4:Withanodefunction alinearcombinationofinput variables everynodeinthislayerisadaptive.If{pi,qi,ri}is theparameterset,then
(4)
Layer5:Thesinglenodeinthislayer,thatisfixed,computes thetotaloutput,orthesumofallincomingsignals.
(5)
ToconstructandtraintheANFISmodel,MATLABR2017a's fuzzy-logic toolbox was used. The prime techniques and propertiesofthecreatedANFISmodelsarelistedinTable5. 3 inputs (potential evapotranspiration, maximum temperature,*rainfall)and2typesofoutputs(aspreviously described)weretestedusingthesemodels.Intheinitialfour models (ANFIS1 to ANFIS4), the output was the average performanceofthetop-performingFLmodels.Andforthe subsequentfourANFISmodels(ANFIS5toANFIS8)utilized themeannormalizationofthetop-performingconventional drought indices as their output. The training set size remainedconsistentat70percentofthetotaldataset,with the remaining 30% allocated for testing purposes. Each modelunderwent1000trainingepochs,employingahybrid optimizationmethod.Furthermore,thetypeofmembership functionfortheoutputremainedconstantamongallmodels thatweredeveloped.
Table- 5: TechniquesandfeaturesofthecreatedANFIS model.
Parameter
Type/Method
Fuzzyinferencesystemtype Takagi-Sugeno ANDmethod Min ORmethod Max
Defuzzificationmethod
Optimizationmethod
Outputparameter
Outputmembership functiontype
Inputmembershipfunction type
Weightedaverage
Hybrid
ANFIS1–ANFIS4: predicteddataofthe averagetop-performing FLmodels
ANFIS5–ANFIS8:top performingconventional indices
Constant
ANFIS1:Triangular
ANFIS2:Trapezoidal
ANFIS3:GeneralizedBellShaped
International Research Journal of Engineering and Technology (IRJET) e-ISSN: 2395-0056
Volume: 11 Issue: 04 | Apr 2024 www.irjet.net p-ISSN: 2395-0072
ANFIS4:Gaussian
ANFIS5:TwoGaussian
ANFIS6:Pi-Shaped
ANFIS7: Difference
BetweenTwoSigmoidal
ANFIS8: Product of Two Sigmoidal
Inputparameters Rainfall, Maximum Temperature,PET
A statistical measure called the Pearson correlation coefficientisutilizedtodeterminethestrengthanddirection ofalinearrelationshipamong2randomvariables.Duetoits versatility, it has been widely utilized in a variety of applications,likenoisereduction,dataprocessing,andtimedelayestimation(Benestyetal.,2008).Notably,researchhas shownthatthePearsoncoefficientiseffectiveinprecisely matchingindicatorsofdrought,includingsoilmoisture,with drought indices (Tian et al., 2020). Thus, the Pearson correlationcoefficienthasbeenutilizedinthisresearchasa comparativeassessingtoolforvalidatingthethegenerated models output with the drought indicators and results obtainedfromconventionalmodels
The proposed classification of drought for the recently createdFL&ANFISmodelsisshowninTable6.Theselected scales and ranges have been chosen in order to be compatible with conventional drought indexes. The scale represents severely dry and moist conditions, correspondingly, and it is from -3.0 to 3.0 with 0.5 increments Usingthefourtaluksthathadbeenselected,the developedFLandANFISdroughtindiceswerevalidated.The beginning of January, April, July, & October in 2023 is the middlemonthofeachseason.PET,meantemperature,soil moisture, maximum temperature, and precipitation data havebeencollectedduringthisperiod.
Table-6: classificationofDroughtindexforindices.
Range Classification
-3andless ExtremelyDry
-2.99to-2.00 VeryDry
-1.99to-1.00 ModeratelyDry
-0.99to-0.50 SlightlyDry
-0.49to0.49 NearNormal
0.50to0.99 SlightlyWet
1.00to1.99 ModeratelyWet
2.00to2.99 VeryWet 3.00andmore ExtremelyWet
Thisresearchwasconductedtoevaluatedroughtutilizinga varietyofdroughtindicesandcorrelateeveryindex'soutput with three distinct drought indicators, explained in the methodology section. The research developed a new meteorological drought index which might be used for monitoring of drought in the future by developing and validating various FL models using correlations with droughtindicators.AccordingtoBenestyetal.(2008)and Tianetal.(2020),thecorrelationhasbeenconductedusing the Pearson coefficient, which is regarded as the finest statisticaltoolforthisinvestigation.Thiscorrelateswiththe correlation measures utilized by earlier researches in the reviewed literature.
International Research Journal of Engineering and Technology (IRJET) e-ISSN: 2395-0056
Volume: 11 Issue: 04 | Apr 2024 www.irjet.net p-ISSN: 2395-0072
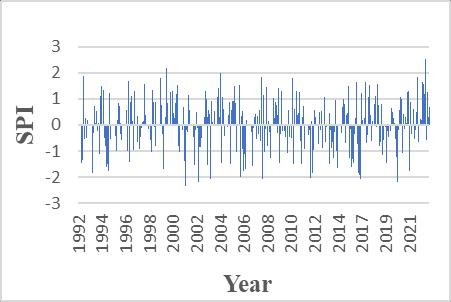
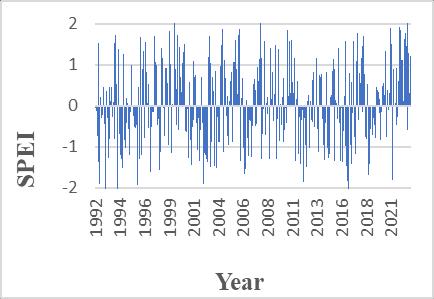
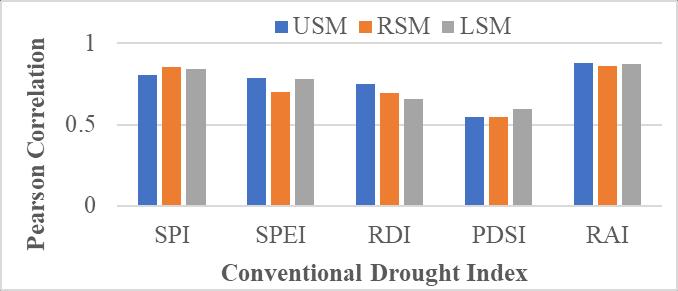
Fig-6: Pearsoncorrelationbetweendroughtindicesand droughtindicators.
(e)
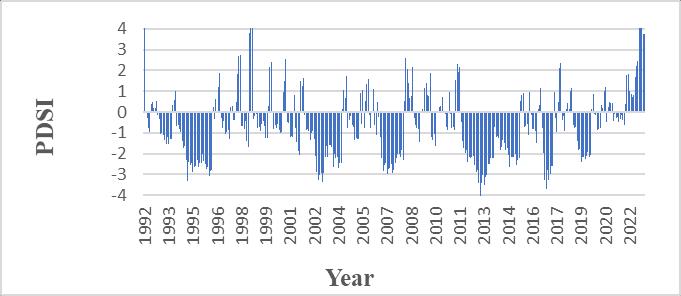
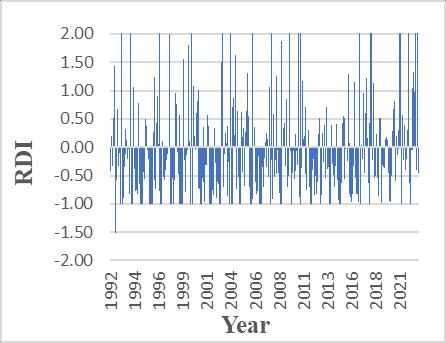
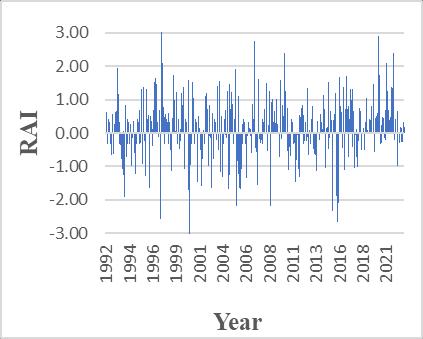
Fig- 5: Temporalvariationsofallthefiveconventional droughtindicesintheChannapatnabetween1992and 2022:a)ReconnaissanceDroughtIndex,b)Rainfall AnamolyIndex,c)SPI,d)SPEI,e)PalmerDroughtSeverity Index
ForfourtaluksintheRamanagaradistrict,fiveconventional drought indices(SPI, SPEI, PDSI, RDI and RAI) have been calculated.Graphsrepresentingthecalculatedconventional droughtindicesareshown.Forinstance,from1992to2022, thetemporalvariationsinSPIreadingsforeverystationis displayedinFig.5.TheSPIreadingsvariedalotduringthe researchperiod,suggestingvariationsinthedrought Witha few minor variations, the SPI values were comparable for each station. Table 7 presents the highest and least SPI readings for every station in the research area to demonstratethevariationinSPIvalues.AccordingtotheSPI classification,aclimatethatismoistisindicatedbypositive values,andadryclimateisindicatedbynegativevalues.
The Channapatna Taluk station recorded the greatest SPI valueof2.56inAugust2022(anexceptionallywetclimate), whiletheMagadistationhadthelowestSPIvalueof-3.6in 2001(anexceptionallydryclimate) Duringthedryseason, all indexes displayed exceptional values, particularly between 2001 and 2009. The SPI readings varied a lot during the research period, suggesting variations in the drought.SimilartotheSPIotherfourdroughtindicesalso weresimilarforallthefourtalukswithslightvariations.SPI and SPEI and RDI were similar since the drought level computed by every index was ranged from -2.0 to 2.0. AccordingtoTeferaetal.(2019)andHaiedetal.(2017),the resultsintheliterature,PDSIandRAIweresimilartoeach other since the drought level indicated by every index remainedwithintheidenticalrangeof-3.0to3.0.19.
International Research Journal of Engineering and Technology (IRJET) e-ISSN: 2395-0056
Volume: 11 Issue: 04 | Apr 2024 www.irjet.net p-ISSN: 2395-0072
Table-7: MinimumandMaximumSPIvalueforfourtaluks
Taluk
Year Value Month, Year
Ramanagara2.2818 August, 2001 2.4808 August, 2022
Kanakapura3.3018 August, 2002 2.2041 August, 2022
Channapatna2.7806 June, 2001 2.5506 August, 2022
Magadi3.6192 May, 2001 2.3152 December, 2022
BycomputingthePearsoncorrelationcoefficientamongthe conventional index values and 3 drought indicators and utilizing it as a comparative assessment tool, the optimal conventional drought index for the research area was determined. Figure6depictsthecorrelationamong every conventional drought score and drought indicators. PDSI, having a coefficient value of 0.596, showed the strongest associationwithlowersoilmoisture.Thestrongcorrelation between accessible water content and deep soil moisture can be attributed to the fact that PDSI estimates take this intoconsideration.Amongthethreesoilmoisturelevels,RAI showedthestrongestassociation,withcoefficientvaluesof 0.603, 0.620 & 0.718, correspondingly. As a result, it was determinedthattheRAIhadthegreatestcorrelationamong traditional drought index and drought indicators. These results were consistent with those of another study that employedacomparableevaluationmethod.
EightdifferentFLmodelswerecreatedusingtheMATLAB R2017a software. Table 8 presents the results of the calculationofthePearsoncorrelationamongthemonthlyFL index values and the monthly conventional index values across1440datapoints(4taluks×12months×30years)
ThehighestconnectionhasbeenobservedamongtheFL1 andRDI(0.861),whilethelowestcorrelationhasbeennoted amongFL8andPDSI(0.207).Ahighcorrelationshowsthat thecreatedFLindexandtheconventionaldroughtindices haveastrongassociation.
Table-8: CorrelationofFLModelswithConventional DroughtIndices.
Model Correlation with the Conventional Drought Indices
Three inputs (potential evapotranspiration, mean temperature, and rainfall), 3 membership functions for potentialevapotranspiration,and5membershipfunctions fortherainfall&meantemperature,andseventy-fivefuzzy rules were present in the least-performing model (FL8). Rainfallandthehighesttemperaturewerethetwoinputsin thebest-performingmodel(FL1),whichalsoincludednine fuzzy rules and three membership functions for each input.The model's overfitting due to the extra inputs and fuzzy rulesmayhavecontributedto itslow output. These findings also demonstrate the impact of temperature and rainfall as drought index inputs in contrast to evapotranspiration. Anillustrationoftheassociationamong theFL &conventional indicesisshowninFigure7,which depictsthecorrelationbetweenFL1andRDI.Fig.7'strend line,withR2=0.8064,indicatesalinearrelationship.
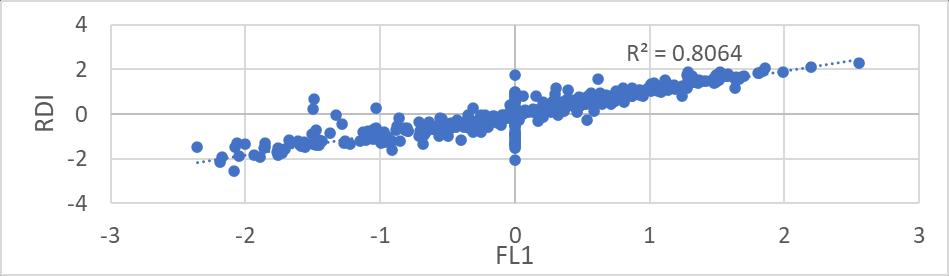
Fig-7: Scatterplotdepictingtherelationshipbetweenthe FL1andRDIdroughtindices.
By calculating Pearson correlation coefficients along with drought indicators, the FL models were further validated. Theassociationbetweentheselecteddroughtindicatorsand FLmodelsisdisplayedinFig.8.FL3anduppersoilmoisture showedthehighestcorrelationcoefficient(0.983),whereas
International Research Journal of Engineering and Technology (IRJET) e-ISSN: 2395-0056
Volume: 11 Issue: 04 | Apr 2024 www.irjet.net p-ISSN: 2395-0072
FL8andhighersoilmoistureshowedthelowestcorrelation coefficient (0.321). Furthermore, FL4 showed low correlationswitheachofthethreedroughtindicators.These findingsrecommendthatFL4andFL8havebeentheleast accuratedroughtforecastingmodelsamongtheeightmodels created. The best-performing models, on the other hand, were FL1, FL3, and FL7, which showed the highest correlation coefficients (0.875, 0.983, and 0.814, respectively) with the drought indicator (upper soil moisture) ThefindingssupporttheFL-baseddroughtindex createdbyNasabetal.(2018),andtheyalsodemonstratea strong correlation among the calculated conventional droughtindicesandproducedFL-basedindex.
ANFIS6andthemajority ofthedroughtindicatorsANFIS6, thelowestcorrelatedmodel,andANFIS1,themodelwiththe highestcorrelation,whilethenumberofinputs,membership functions,andrulesaresame;Despitethis,theoutputwas the triangle membership functions of the average topperformingFLmodelinANFIS1.Duetothesevariations,the correlationcoefficientbetweentheuppersoilmoistureand the value increased from the lowest to the greatest. The outcomes of the presented study were compared with previousresearchbyMishraandDesai(2006).
Tabe-9: ANFISModelCorrelationwithConventional DroughtIndices.
Model Correlation with the Conventional Drought Indices
ANFIS models were created with the aim to improve the predictivecapabilitiesofFLmodelsthroughtherefinement offuzzyparametersusingatrainingdatasetwithmultiple inputs and a single output. Eight models with 2 forms of output were created: 1) the mean values of the most effectiveconventionalindices,and2)themeanvaluesofthe mosteffectiveFLmodels(MhamdSaifaldeenOyounalsoud, 2022).
A Pearson correlation was computed across 1440 data points (4 taluks × 12 months × 30 years) between the monthlyvaluesoftheANFISindexandthemonthlyvaluesof theconventionalindex.Table9presentsthefindings.The connection between ANFIS1 and RAI was found to be the highestat0.942,whilethecorrelationbetweenANFIS6and PDSIwasthelowestat0.529.
ThePearsoncorrelationbetweenthedroughtindicatorsand the ANFIS models was employed to further validate the models. The association between the eight ANFIS models and the three drought indicators is displayed in Fig. 9. ANFIS1 and higher soil moisture showed the strongest relationship (0.926), whereas ANFIS4 and lower soil moisture showed the lowest correlation (0.413). Furthermore,therewasalowerassociationfoundbetween
DatafromfourselectedstationsintheRamanagaradistrict (Ramanagara taluk, Kanakapura taluk, Magadi taluk, and Channapatnataluk)werecollectedduringthemidpointof each season in 2023 in order to validate the developed models,andthedroughtindexhasbeencalculatedusingthe developed models. By utilizing the drought classifications displayed in Table 6, the top-performing models, FL3 and ANFIS1,havebeenutilizedtoevaluatedroughtintheareas ofthechosenstations.
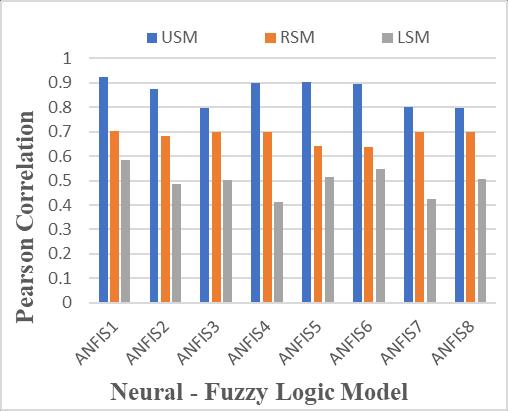
Fig-9: Correlationoftheneuro-fuzzymodelswiththe droughtindicators.
International Research Journal of Engineering and Technology (IRJET) e-ISSN: 2395-0056
Volume: 11 Issue: 04 | Apr 2024 www.irjet.net p-ISSN: 2395-0072
Theperformanceofthesemodelswastestedbydrawingthe graphsoftheANFISmodelthatwasperformingbestforboth thetrainingandtestingphasesasshowninFig.10(a)and (b).Theslopeforboththephaseswasmorethanonewhich indicates that the overestimation can be neglected. The linearrelationshipbetweenobservedandpredicteddatasets arepositivelystrong.
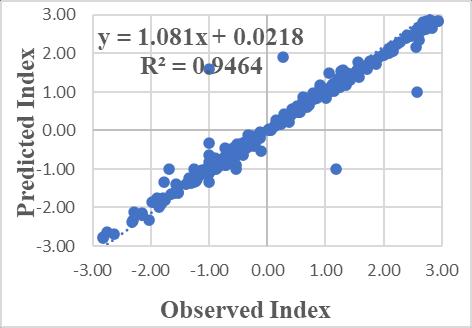
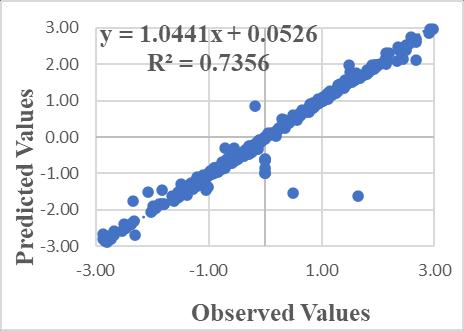
Fig-10: (a)trainingand(b)testingscatterplotsfor datasetsofthebestANFISmodel.
The conventional drought index (RAI), which was used to comparetheindices,showedthestrongestassociationwith the soil moisture indicator. Additionally, the average precipitation in 2023 was lower than in previous years, which raised the risk of drought, as per the IMD (India Meteorological Department). The generated models performedsimilarlyindroughtpredictionoverall,according to the validation results, and they generally matched the resultsofthebestassociatedRAI.IntheKanakapurataluk, thedevelopedmodelsoutperformedtheconventionalindex, particularlyinJulywhilethearea receivedalotofrainfall (113mm).Near-normaltoslightlywetconditionshavebeen projected by the drought index that was developed employingFLandANFIS.TheRAIindex,however,revealed an extremely dry condition. FL and ANFIS models did not predict well at Ramanagara Taluk during April with nearnormal conditions, where the actual rainfall was 33 mm.
Usingmultipleclimatefeaturescanresultintheinaccuracies inthemodelthatwerenotincorporatedinthedevelopment. Thesefindingswereconsistentwiththeresearchconducted byNguyenetal.(2017),whoexaminedintothequantitative values of the SPEI and SPI drought indices as well as the usage of ANFIS for drought forecasting. The results demonstrated the potential for the ANFIS model to be successfully employed for drought forecasting with high reliability and accuracy. Table 10 shows the validation resultsofthemodelscreated.
Table-10: FL3,ANFIS1andRAIDroughtindex.
Taluk & Year Month
Rama nagar a, 2023
Kana kapur a, 2023
Maga d, 2023
Fiveconventionaldroughtindices(SPI,SPEI,RAI,RDIand PDSI) were calculated for the study area with four taluks (Ramanagara,Channapatna,MagadiandKanakapura),and theresultsrevealedthatduetoitsstrongassociationwith otherdroughtindicators,likesoilmoisture,RAIhasbeenthe mosteffectiveconventionaldroughtindex.Theresultsofthe conventional drought indicators also suggest that Magadi talukasthedriestofthefourtalukswhereasChannapatna with the least dry conditions. 8 FL models were created utilizing the fuzzy logic toolbox in MATLAB with different combinations of the inputs (potential evapotranspiration maximum/meantemperature,andrainfall).Withavalueof 0.984, the strongest correlation among the studied FL modelswasfoundbetweenFL3anduppersoilmoisture.
International Research Journal of Engineering and Technology (IRJET) e-ISSN: 2395-0056
Volume: 11 Issue: 04 | Apr 2024 www.irjet.net p-ISSN: 2395-0072
TheleastcorrelatedFLindexisthemaximumFL8withthree inputs and seventy-five fuzzy rules. It is evident that the fuzzyrulesandextrainputsledtopoorerperformance,most likelyasaresultofthemodelbecomingoverfit.TheANFIS1 model and root zone soil moisture showed a stronger association(0.906).TheFLandANFISmodelscreatedalso wereinrelationwiththeconventionaldroughtindiceswith respect to the wet and dry conditions of the four taluks suggesting that the created models were best performing. Evapotranspirationhasminimalimpactondroughtindices results.Tovalidatethehighest-performingmodels(FL3and ANFIS1),fourtaluksthatwereutilizedintheFLmodel'srule creationortheANFISmodel'straininghavebeenselected. Overall, the new indices which were selected as the best performingmodelspresentedaccuratedroughtassessment over the 4 taluks as well as the drought levels with an acceptableefficiencyincontrasttoRAIconventionalindex.
[1] MhamdSaifaldeenOyounalsoud,MohamedAbdallah, Abdullah Gokhan Yilmaz, Mohsin Siddique, Serter Atabay,“Anewmeteorologicaldroughtindexbasedon fuzzylogic:Developmentandcomparativeassessment with conventional drought indices,” in Journal of Hydrology,2023,619129306
[2] Abbasi,A,Khalili,K,Behmanesh,J,Shirzad,A,“Drought monitoringandpredictionusingSPEIindexandgene expressionprogrammingmodelinthewestofUrmia Lake,”Theor.Appl.Climatol.2019,138(1),553–567.
[3] Keskin, M. E., Alganci, U., & Eris, E, “Application of advanced fuzzy logic and ANFIS models for meteorological drought analysis,” Hydrological Processes,2009,23(16),2297-2306.
[4] Malik, A. Q., Khan, M. A., & Qazi, W. A. 2020. Development of a Co-Active Neuro-Fuzzy Inference System for SPI Prediction at Different Time Scales. WaterResourcesManagement,34(5),1537-1552.
[5] RanaMuhammadAdnan,Hong-LiangDai,AlbanKuriqi, Ozgur Kisi, Mohammad Zounemat-Kermani, “Improvingdroughtmodelingbasedonnewheuristic machine learning methods,” Ain Shams Engineering Journal,2023,14102168
[6] Rezaeian-Zadeh M, Tabari H. “MLP-based drought forecastingindifferentclimaticregions,” TheorAppl Climatol,2012,109:407–14.
[7] SalloomT,KaynakO,YuX,“HeW.Proportionalintegral derivative booster for neural networks-based timeseries prediction: case of water demand prediction,” EngApplArtifIntel,2022,108:104570.
[8] Srinivasareddy, B., Nagraju, G., & Prasad, J. V., “AssessmentofDroughtVulnerabilityUsingComposite Climatic Index - A Case Study of Karnataka State,” International Journal of Current Microbiology and AppliedSciences,2018,7(4),3251-3265.
[9] Bai, Y., Wang, D., “Fundamentals of fuzzy logic control fuzzysets,fuzzyrules,anddefuzzifications. In: Advanced fuzzy logic technologies in industrial applications,”Springer,London,2006,pp.17–36
[10] Mokhtarzad, M., Eskandari, F., Jamshidi Vanjani, N., Arabasadi,A.,“DroughtforecastingbyANN,ANFIS,and SVMandcomparisonofthemodels,”Environ.EarthSci, 2017,76(21),1–10.
[11] Tagliabue, L.C., Cecconi, F.R., Maltese, S., Rinaldi, S., Ciribini,A.L.C.,Flammini,A.,“LeveragingDigitalTwin for Sustainability Assessment of an Educational Building,”J.Sustainab,2021,13(2),480.
[12] Wilbik, A., Keller, J.M., Bezdek, J.C., “Generation of prototypes from sets of linguistic summaries. In: In 2012 IEEE International Conference on Fuzzy Systems,”IEEE,2012,pp.1–8.
[13] ¨Ozger, M., Mishra, A.K., Singh, V.P., “Long lead time drought forecasting using a wavelet and fuzzy logic combination model: a case study in Texas,” J. Hydrometeorol,2012,13(1),284–297.
[14] Sobhani, B., Zengir, V.S., Kianian, M.K., “Drought monitoring in the Lake Urmia basin in Iran,” Arab. J. Geosci,2019,12(15),1–15.
[15] Jang, J.S., “ANFIS: adaptive-network-based fuzzy inferencesystem,”IEEETrans.Syst.ManCybern,1993, 23(3),665–685.
[16] Benesty, J., Chen, J., Huang, Y., 2008. “On the importance of the Pearson correlation coefficient in noise reduction,” IEEE Trans. Audio Speech Lang. Process, 2016 16 (4), 757–765. https://doi.org/10.1109/TASL.2008.919072
[17] Tian,L.,Leasor,Z.T.,Quiring,S.M.,“Developingahybrid drought index: precipitation evapotranspiration differenceconditionindex,”Clim.RiskManag,2020,29, 100238.
[18] Tefera, A.S., Ayoade, J.O., Bello, N.J., “Comparative analysesofSPIandSPEIasdroughtassessmenttoolsin TigrayRegion,NorthernEthiopia,”SNAppl.Sci,2019,1 (10),1–14.
[19] Haied,N.,Foufou,A.,Chaab,S.,Azlaoui,M.,Khadri,S., Benzahia, K., Benzahia, I., “Drought assessment and
International Research Journal of Engineering and Technology (IRJET) e-ISSN: 2395-0056
Volume: 11 Issue: 04 | Apr 2024 www.irjet.net p-ISSN: 2395-0072
monitoringusingmeteorologicalindicesinasemi-arid region,”EnergyProcedia,2019,119,518–529.
[20] Nasab,A.H.,Ansary,H.,Sanaei-Nejad,S.H.,“Analyzing droughthistoryusingfuzzyintegrateddroughtindex (FIDI): a case study in the Neyshabour basin, Iran,” Arab.J.Geosci,2018,11(14),1–10.
[21] MishraAK,DesaiVR,“Droughtforecastingusingfeedforwardrecursiveneuralnetwork,”EcolModel2006, 198:127–38.
[22] Nguyen, V., Li, Q., Nguyen, L., “Drought forecasting using ANFIS-a case study in drought prone area of Vietnam,” Paddy Water Environ, 2017, 15 (3), 605–616.