
International Research Journal of Engineering and Technology (IRJET) e-ISSN: 2395-0056
Volume: 11 Issue: 03 | Mar 2024 www.irjet.net p-ISSN: 2395-0072
International Research Journal of Engineering and Technology (IRJET) e-ISSN: 2395-0056
Volume: 11 Issue: 03 | Mar 2024 www.irjet.net p-ISSN: 2395-0072
Srujana Dhegam1, Sailu Chintha2, Hari babu Pengonda3, Jyothi Thati4
1,3ph.D scholar, Dept. of Chemical Engineering, University College of Technology, Osmania University, Telangana, India
2 Professor, Dept. of Chemical Engineering, University College of Technology, Osmania University, Telangana, India 4Associate professor Dept. of Chemical Engineering, University College of Technology, Osmania University, Telangana, India
Abstract - Textile production units are the foremost economic industrial zones prevailing across the globe but produce enormous amounts of wastewater which confines to high levels of chemicals and pollutantsduringtheirprocessing stages. To eradicate these pollutants an attempt is made by using advanced oxidation processes and solar energy. In this context, the present study includes utilization of solar energy by altering the optical Titanium dioxide (TiO2) by doping and Co-doping with Nitrogen (N), Iron (Fe). Synthesized catalysts were characterized by X-ray diffraction (XRD) Scanning Electronic Microscopy (SEM), Fourier transform infrared spectrophotometer (FTIR) & UV–Vis Diffuse Reflectance Spectra (UV–Vis DRS). Based on XRD patterns, the average crystallite size was determined using Debye-Sherrer, Williamson -Hall (W-H) and Halder-Wagner (H-W) methods. SEM explored the shape of catalyst by increasing the Fe content. Functional groups wereidentifiedinbetween500 cm1- 3600 cm-1. UV- Vis DRS analyzed the band gap of Fe-N-TiO2 (2.8eV) is lesser than that of N-TiO2 (3.1eV).ByselectingFe-NTiO2_1 as a photocatalyst,thepercentagedegradationofRO86 dye under solar light was determined by Design of Experiments-Response Surface Methodology-Central Composite Design (DOE-RSM-CCD). Optimum conditions for maximum degradation of 97.39% of Reactive Orange-86(RO86) were achieved with a catalyst dosage of 1.388 g/250 ml, 10 mg/l concentration, reaction time of 148 min and rate constant 0.0158min-1 with first order reaction.
Key Words:AdvancedOxidationProcess,ReactiveOrange86,ResponseSurfaceMethodology,degradation
In the present era, water pollution is a significant issue causedbythemajorcontributionofindustrialcivilization. Treatingtheeffluentsbeforeenteringwaterbodiesisthekey challengeforthevariousindustrieslikepaper,textile,pulp, andmetallicindustriesetc.Amongstall,textileindustriesare key corners of extensively discharging effluents in water bodiesinthedownstreamprocessingunitssuchasdyeing andfinishing[1]. Effluentsevolvedfromdyeingandrinsing unitsshowendangeredenvironmentalimpactsasitcarries overmuchcolourandisexceptionallyconductivebecauseof
existenceofsubstantialpresenceoffreedyemolecules[2]. Reactive dyes are significantly employed in dyeing operations toimpartcolour onfabricsforof theirdistinct reactivity and better colour longevity [3]. As the Reactive dyes are remarkably miscible with water, malignity & recalcitrancy parameters leads to serious carcinogenic diseases[4].Thereexistnumerousconventionalmethodsto decolorize the textile effluents such as adsorption (using variousadsorbents),electrochemicaltreatment,coagulation /flocculation,ozonation,biological&chemicaloxidation[5]. However, these methods have inherent and distinct disadvantagesintermsoffeasibilityofoperationandcostof thetechniqueemployedtowardscompletedegradationof dyes[6].
Toovercomethis,AdvancedOxidationProcess(AOP’s)are setascutting-edgetechnologiesfortreating dye effluents. AOPsrelyondevelopmentofextremelyreactivespecieslike OH.toinitiateoxidationofpollutantmoleculeswhichcanbe producedatnearambientpressureandtemperature.AOP cansignificantlydegradetheorganicpollutantstoCO2,H2O and salts [7]. From the diversified AOPs, heterogeneous photocatalysis is preferred choice for the degradation of stable dye complex structures [8]. In heterogeneous photocatalysis, the predominant factor is figuring out the reliablecatalyst.TiO2 isthemostabundantlyusedcatalyst forphoto-catalyzedreactionsbyvirtueofitspropertieslike electronic configuration, optical band gap (3.2eV), occurrence, thermal stability, chemical resistant and nonpoisonous [9]. In spite of this, TiO2 is suffering with two shortcomings like; it requires excess energy like UV radiationtoexcitationofelectronicsfromVBtoCBandrapid recombinationofe- -h+pairs[10].Ontheotherhand,solar radiation comprises 4-5% of Ultraviolet radiation. With a view toutilizethe remainingportion ofsunlight radiation likevisibleregion,itisnecessarytocut-downthebandgap byemployingmostpromisingmethodslikedoping[11].
Dopingcanaltertheopticalresponsebycreatingnewenergy levels in between VB and CB [12]. However, doping with non-metals like N, C, and S is the most fashionable. But dopingwithNitrogen(N-TiO2)ismoreeffectivewhichcan shiftabsorptionbandspectrafromUVtovisiblelight[13]. Though N-TiO2 can absorb visible light spectra of solar
International Research Journal of Engineering and Technology (IRJET) e-ISSN: 2395-0056
Volume: 11 Issue: 03 | Mar 2024 www.irjet.net p-ISSN: 2395-0072
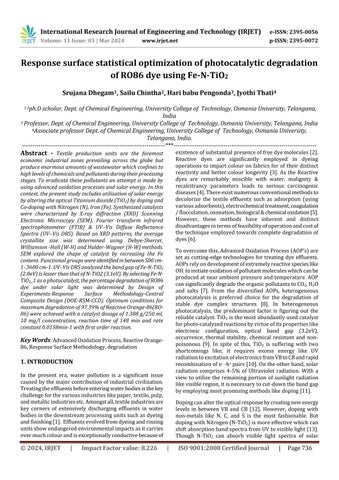
radiation[14],thephotocatalyticactivitywasnotcomplete, becausedopingwithN(wt%)leadstoTiO2latticedistortion withincreaseine--h+ recombinationratebylocalizationof N2p states [15] [16]. To surpass this, many researchers suggested metal & non-metal co-doping of TiO2 [17]. Codoping of N-TiO2 with Fe would dial down recombination rateeffectively.EvenaminimalamountofFe+3ionscanact asatrappingcentretoinhibitelectron-holerecombination [16]. This study focused attention on the degradation of ReactiveOrange86(RO86)dyeasdepictedinfig.1usingFeN-TiO2_1as a photocatalyst under visible radiation by optimizationofvariousparametersofthedyesolutionlike catalyst dosage, the concentration of RO86, and time of reaction.Theinvestigationoftheinfluenceofindividualsand theinteractionofparametersonthedegradationofdyeis carriedoutbyusingResponseSurfaceMethodology(RSM). RSMisapowerfulstatisticaltooltoestablishthedesignof experiments(DOE)involvingseveralvariables[18].Inthis work,TheCentralCompositeDesign(CCD)basedRSMwas adoptedtoanalysethesystemwith3parameterson2levels (23).
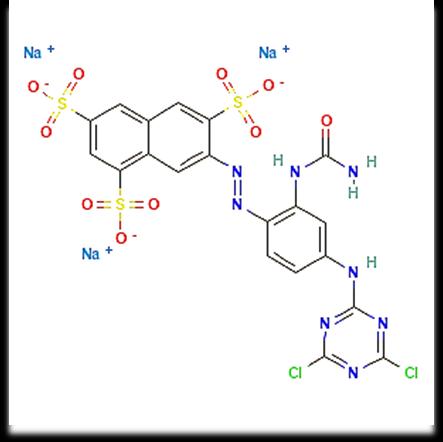
Fig.1ChemicalstructureofacommercialReactiveOrange86dye(λ=412nm)runningtextshouldmatchwiththelistof referencesattheendofthepaper.
2.1 Reagents and Chemicals
TitaniumTetraIsopropoxide(TTIP)waspurchasedfrom Sigma-Aldrich,Iron(III)NitratenanohydrateFe(NO3)3.9H2O, Urea (NH2CONH2) were brought from Isochemand Glacial AceticAcid,AbsoluteEthanol(99.9%),Doubledistilledwater (DDW)ofanalyticalgradeweredirectlyutilizedandReactive Orange-86 dye (C20H11Cl2N8Na3O10S3) ) (M.W. = 759.4 gmol−1)usedfordegradationstudies.
2.2 Synthesis of N-TiO2 Photocatalyst
2.2.1 Solution A
Solution A is prepared by adding titanium tetra iso propoxide(TTIP)(10ml)to30mlofabsoluteethanolunder constantmixingfor1hr.
2.2.2 Solution B
Solution B is prepared by adding different amounts of urea(0.3and0.6g)in50mlofDDWand1mlofglacialacetic acid under constant stirring for 30min which acts as a precursorfortheNitrogensource.
AddsolutionBdrop-wisetosolutionAunderbriskmixingfor 1hratroomtemperature.Theresultantprecipitatewaskept foragingfor12hrsandlaterdriedat120°Cfortwohours. Obtainedsamplewascalcinatedinamufflefurnaceforabout 1hrat400°Cwithaheatingrateof4°C/min[19]
2.3 Synthesis of Fe- N-TiO2 Photocatalyst
2.3.1 Solution B
SolutionBispreparedbyaddingdifferentamountsof0.02g and0.04gofNitrateNanohydrate(Fe(NO3)3.9H2O)which actsasaprecursorforIronsource,0.3gofureain50mlof DDW and 1ml of glacial acetic-acid and under constant stirringfor30min.Thentheremainingprocedurewasthe sameafteraddingthissolutiondrop-wisesolutionA.
2.4 Catalyst Characterization
X-ray diffraction (XRD) results of synthesized crystalline structuresreportedinthisstudywerestudiedonaRigakuXRayDiffractometerbyusingNi-filteredCuKαradiation(λ= 1.5406Ao)intherangeof10°<2θ<80°withastepsizeof 0.02°/2θunderoperatingwith40kVand30mAaccelerating voltage and current respectively. Scanning electron microscopy (SEM) (JSM-7800F) was used to study morphology and chemical compositions, Japan, FTIR (Fourier transform infrared spectrophotometer) (Model FTIR-8400S,SHIMADZU)wereutilizedtoidentifyfunctional groups presented in. UV-Vis Diffuses Reluctance (UV-Vis DRS) Spectra (Hitachi U-3900 spectrometer), using the reference(BaSO4standard)intherangeof200-1000nm.
250 ml of RO86 dye solution (10, 55, and 100 mg/l) in a batchreactorweretakenforthebelowexperimentation.The experiments were conducted using solar light with the required amount of catalyst (0.5, 1, and 1.5 gm) under constantvigorous stirring ofthe solution at400 rpm.Dye samples were stored in the dark to attain the equilibrium between the dye solution and catalyst particle at the beginning.Analiquotof10mlwascollectedat30and180 min and filtered via Millipore-filter (0.45 µm) and was further analyzed using UV-Visible Spectrophotometer (Shimadzu, model UV-1800). The % of degradation of the dyesolutionwasdeterminedasfollows:

WhereA0andAaretheinitialandfinalabsorbancevaluesof samplesatanytimerespectively.
International Research Journal of Engineering and Technology (IRJET) e-ISSN: 2395-0056
Volume: 11 Issue: 03 | Mar 2024 www.irjet.net p-ISSN: 2395-0072
Methodology (RSM)
RSM approach is used to depict effects of various independent factors on process response. RSM is used to minimize the number of experiments and to analyze the experimental design results with the predicted results. Catalystdosage,concentration(RO86),andtimeofreaction on degradation performance were investigated. Central Composite Design (CCD) at two levels involving three parameters[20]asshowninTable-1.
Table-1: Operating levels of independent factors in RSMCCD.
S.No. Independentfactor Lowlevel(-1) Highlevel(+1)
1. Catalystdosage(g) 0.5 1.5
2. Concentration(mg/l) 10 100
3. Timeofreaction(min) 30 180
By operating the process at 2 levels with 3 parameters (2k=23)factorialdesigngenerated20.Experimentsbyusing the RSM-CCD method were shown in Table 2. Catalyst dosages were in the range of 0.5-1.5 g/250 ml, the concentration of dye solution was in the range of 10100mg/l, and the reaction time varied from 30-180 min. TheseindependentvariablesweredesignatedasX1,X2,and X3 respectively. Degradation efficiency response was estimatedtoinvestigatetheprocessvariables.
To get a good estimate of experimental errors during experimentalanalysisfivereplicationsconducted[21] A quadratic model was developed to support the experimentalvalidationshownasbelow: Y=b0 + b1X1 + b2X2 + b3X3 + b11X12
Where,Y:Predictedresponsefactorof%degradationRO86, b0: Constant coefficient, b11, b22 and b33: quadratic coefficients, b12, b13 and b23: Interaction coefficients respectively.X1,X2, andX3 havecodedformsofparameters [22]
Toenhancetherateofmasstransferofdyemoleculestothe photocatalyst surface were maintained with sufficient mixingofslurryduringeachbatchperiod.Thephotocatalytic reactionratewasmodeledwithfirstorderondegradationas following[22]:

is the rate of degradation of dye molecules with firstorderreactionwhichisrepresentedasfollows:

WhereAistheabsorbanceofsamplescollectedatvarious reactiontime,A0 istheinitialabsorbancevalue,kistherate constantoffirstorderreaction(min-1)andtisthereaction time(time).
3.1XRD Patterns
To evaluate the effect of doping elements (Fe, N) on TiO2 crystalstructureXRDpatternsoffourcatalystcompositions wererecordedasshowninFig.2.
Fig. 2:XRDPatternsofallsynthesizedcatalystsamples
The XRD patterns are consensus with identical crystal structures(01-081-1387,01-071-1169).Allthesefourtypes ofphotocatalystsaretetragonal(BCC)andanatasephases accounting for most diverse distinct diffraction peaks correspondingtothe(101),(004),(200),(103),(105),(211), and(204)crystalplanes.
Debye−Scherer(DS)Equationasmentionedbelowisused forcalculatingtheaveragecrystallitesize

Where ‘D’ is the average crystallite size, ‘k’ is the grainshape-dependentconstant(0.9),‘λ’ isthewavelengthofXrays used, 1.5406 Å, ‘β’ is the full-width half maximum (FWHM) and ‘θ’ is the Bragg’s angle of the corresponding peak,respectively[23].Theresultsobtainedwereshownin Table 3. The average crystallite size decreased from NTiO2_1toFe-N-TiO2_1andincreased from Fe-N-TiO2_1 to Fe-N-TiO2_2 indicating the initial decrease in size from N-TiO2_1 to N-TiO2_2 is due to replacement of a greater number of oxygen ions with nitrogenionsandfurtherdecreaseresultsinreplaceofTi+4 withFe+3 .
International Research Journal of Engineering and Technology (IRJET) e-ISSN: 2395-0056
Volume: 11 Issue: 03 | Mar 2024 www.irjet.net p-ISSN: 2395-0072
Table-2: Factorialdesign
The result from Fe-N-TiO2_1 to Fe-N-TiO2_2 indicates an increaseintheconcentrationofIronleadstoreplaceofmore Ti+4withFe+3 andsomeofFe+3 isplacedinterstitiallyinthe lattice which leads to an increase the in volume of the crystal. By using Bragg’s law, the lattice parameters of differentsamplesaredeterminedshowninTable3.
Table-3: Average crystallite size for different types of catalystswithlatticeparameters

byplottingβhkl cosθ onY-axisand4sinθonX-axisprovides slopewhichistheintrinsicstrain(εs)andintercept(Kλ)/D givescrystallitesize(D).
y=0.01823-0.00424x
y=0.02425-0.00616x
y=0.02049-0.00432x
y=0.01968-0.00488x
3.1.1 Dependence of peak broadening
WilliamsonandHall(W-H)andHalder-Wagner(H-W)plots are carried out as shown in Fig. 4 to distinguish the crystallitesize–affectbroadeningandintrinsicstrain–affect broadening.
3.1.2 Williamson and Hall (W-H) plot method
WilliamsonandHall(W-H)plotmethodrelatesthe XRDpeakbroadeningbytinycrystallitesizeandintrinsic strain(εS)whichisshownas[24]

bymultiplyingtheaboveequation(1)bycosθleadsto
Fig. 3: WilliamsonandHall(W-H)plots
However, Williamson & Hall (W-H) plot-method explores broadening of peak by considering weightage to higher diffractionanglesthanlowerandintermediateangleswhich isnotreliablealways.
H-Wmodifiedequationasshownequation(4)containsthe integral breadth, β*,ofthe reciprocal lattice pointandthe latticeplanerspacing, d*,forthereciprocalcellbyincluding lowerandintermediateangleswhichisdescribedbyVoigt functionas

Where, areLorentzianandGaussiancomponents [25] Therebythecrystallitesizeandstrainrelationgivenby

International Research Journal of Engineering and Technology (IRJET) e-ISSN: 2395-0056
Volume: 11 Issue: 03 | Mar 2024 www.irjet.net p-ISSN: 2395-0072


y=0.09595-3.35E-05
y=0.12657-1.01E-04
y=0.10522-2.80E-05
y=0.10516-7.53E-05


Fe-N-TiO2_2
Fe-N-TiO2_1
N-TiO2_2
0.0020.0040.0060.0080.0100.0120.0140.016
(β*/d*^2)
Fig. 4: Halder-Wagner(H-W)plot
The negative sign indicates compressive strain inside the lattice due to replace of higher atomic radii (O-2 and Ti+4) withlowerone(N-3 andFe+3).
ThebroaddeviationincrystallitesizeresultedfromDebyeSchererrelation&W-HandH-WplotsasdepictedinTable4 imply that broadening of FWHM probably prevailing compressivestrainincrystallattice[26]
3.3 Morphology Analysis
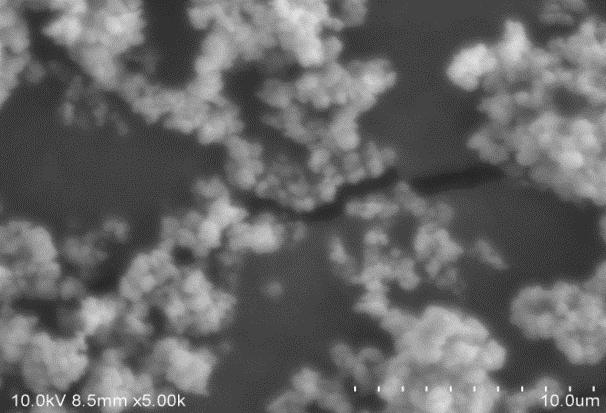
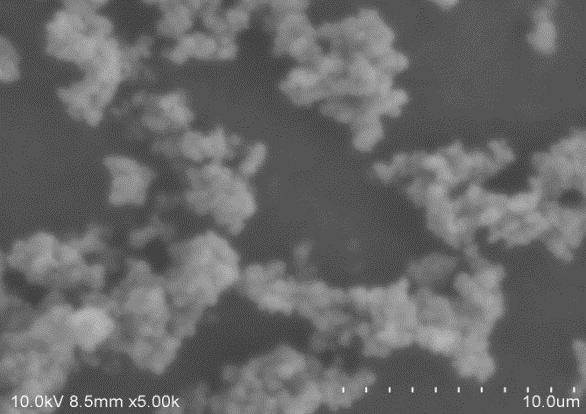
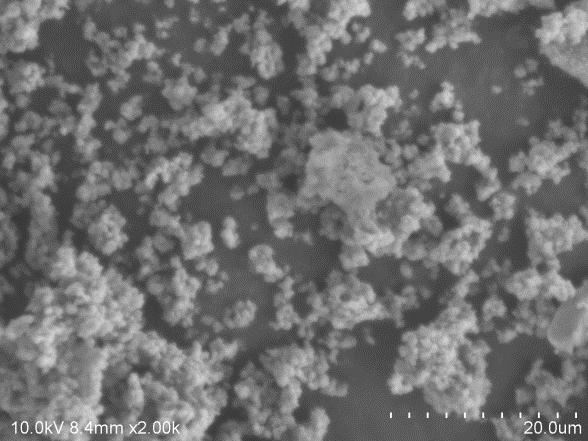
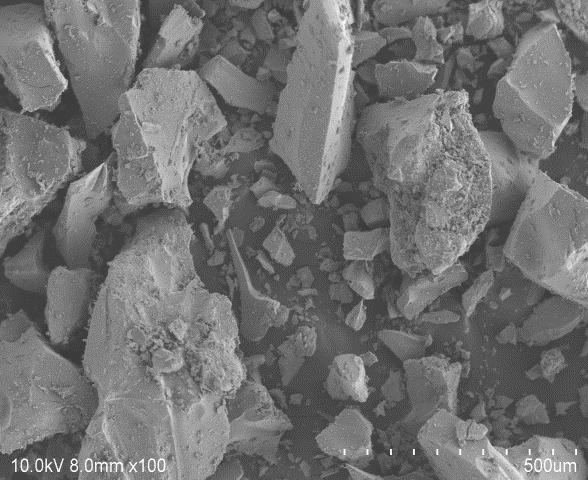
ScanningElectronMicroscopy(SEM)isusedtoobserve thesurfacemorphologyofdoped&co-dopedTitanium dioxideasshowninFig.5(a)toFig.5(h)
TheSEMimagesexploresthattheparticlesinN-TiO2_1and N-TiO2_2areinsphericalshapeandagglomerated.Whereas Fe-N-TiO2_1isalsosphericalbutmoreagglomeratedthanNTiO2 samples.But the shapeof Fe-N-TiO2_2 particleshas beenchangedtoirregularflakesduetoincorporationofhigh FecontentintoTiO2crystallattice.Thelengthoftheparticles increasesdrasticallyfrom 795.1nm to19μmaswell which affectsreactivesurfaceareaavailableonthecatalyst.
3.4
FTIR spectra of doped & co-doped TiO2 catalysts were carried out in the interval of 500 cm-1 - 4000 cm-1 wavenumbertoidentifyfunctionalgroupsasshowninFig.6. A broad peak appeared in the range of 3300-3600 cm−1 , indicating stretching vibration of O-H group on surface titaniumcentersofTiO2,thepeakat2294.12cm-1revealsC-H bonding,vibrationofFe-Obondinbetween520-610cm-1 . TheTi-NvibrationsintheTiO2 latticeappearedatthepeak
inbetween1020-1100cm-1 andtheO-Hbendingvibrations ofabsorbedwatermoleculeswereobservedat1620-1640.9 cm-1andfurtherdetailsaresummarizedinTable5relatedto thepositionofvariouspeaks.
Fig. 6:FTIRSpectraofdoped&Co-dopedTiO2 catalysts
3.5 UV–Vis Diffuse
UV-VisDRSofallfoursamplesareexploredandshownin Fig.7.Thebandedgeisdetectedwhenthereisachangein concentrationFe,Nofdopedandco-dopedTiO2,thereisa shift of wavelength from a shorter to longer wavelength spectrum(391-535nm)whichindicatestheVisibleregion. Co-doping of Fe to N-TiO2 reflects the increase in absorbance.ButmuchincreaseinFecontentwouldinhibit theabsorbance[30].Theshiftinthewavelengthisowingto the charge transfer between the d-electrons of Fe to TiO2 [31].Opticalenergygap(Eg)ofallthesynthesizedcatalysts can be depicted by means of Tauc graphical method as shown in Fig. 8 by using following expression a given by equation(5)[32]
Where, α is the absorption coefficient, hν is the photon energy,n∼1fordirecttransitionbetweenbandsandEgis thebandgapenergy.FromFig.8it’sbeenobservedthatthe optical band gap of modified catalysts decreased from NTiO2_1(3.1eV)toFe-N-TiO2_2(2.8eV).AsreportedbyAlvaro Realpe Jimenez et al., [29] the reduction in band gap is resultedbyoverlayingofFe3+(d-orbital)withTi(d-Orbital) andmixingoftheN2porbitalwiththeO2porbitalswhencodopant Fe and dopant N are induced into TiO2 lattice by formingintermediate energylevelswhichleadstoshift of absorptionedgetowardsthevisibleregion[33].
International Research Journal of Engineering and Technology (IRJET) e-ISSN: 2395-0056
Volume: 11 Issue: 03 | Mar 2024 www.irjet.net p-ISSN: 2395-0072
Table-4:CrystallitesizeandstrainbyusingW-HandH-Wplotmethods.
International Research Journal of Engineering and Technology (IRJET) e-ISSN: 2395-0056
Volume: 11 Issue: 03 | Mar 2024 www.irjet.net p-ISSN: 2395-0072
5(e):SEMimageofFe-N-TiO2_1
5(g):SEMimageof Fe-N-TiO2_2
Fig.5(f):AverageparticlediameterofFe-N-TiO2_1
Fig.5(h):AverageparticlediameterofFe-N-TiO2_2
Table-5. AbsorptionpeakpositionsobtainedfromFTIRspectraofdopedandco-dopedTiO2
Observed absorption peak position (cm–1) Attributed to (reference)
[26]
[29]
At the last, its observed that, co-doping of Iron creates strongereffectcomparedto dopedN-TiO2 thoughthere is increaseinNcontent from3weight%to6weight%(where N-TiO2_1(3.1eV),N-TiO2_2(3.04eV),Fe-N-TiO2_1(2.85eV) andFe-N-TiO2_2(2.8eV))inthereductionofbandgap. But muchincreaseinFefromFe-N-TiO2_1(2.85eV)toFe-NTiO2_2 (2.8eV) content wouldn’t lead to an effective narrowingintheenergybandgap.
International Research Journal of Engineering and Technology (IRJET) e-ISSN: 2395-0056
Volume: 11 Issue: 03 | Mar 2024 www.irjet.net p-ISSN: 2395-0072
totheresultsofthecharacterizationofFe-N-TiO2_1andFeN-TiO2_2thestaininFe-N-TiO2_2ismorethanFe-N-TiO2_1 whichmaybeattributedtolatticedislocations[24]andthe bandgapisjustlessthan0.05eVthoughbyincreasingtheFe content by double and incorporating the more Fe content inhibitingtheabsorptionedge[30].
Consideringalltheabove, Fe-N-TiO2_1wasselectedasthe photocatalyst for the effective degradation of the dye solution.
3.7 Process performance by using Statistical analysis and model development
TooptimizethedegradationofdyesolutionRSMstudywas performed, and results were analyzed by the concept of ANOVA(AnalysisofVariance)usingMinitab.19.
7: Diffusereflectancespectraofallfoursynthesized catalystsamples 2.42.52.62.72.82.93.03.13.23.33.43.53.63.73.83.94.0
8: Taucgraphicalplotforthefoursynthesizedcatalyst samples
3.6 Selection of Photocatalyst for degradation studies
Amongtheallmodified/synthesizedcatalystsFe-N-TiO2_1 hasbeenselectedforthephotodegradationstudybasedon theresultsobtainedthroughthecharacterizationofallfour samples and it’s been reported by many researchers [34], theactivityofPhotocatalystFe-N-TiO2 ismorethanN-TiO2 because of reduction in band gap from (3.1 to 2.8eV) and incorporation excessive content of Nitrogen enhances recombinationofelectron-holepairswheretheoxygensites are replaced by Nitrogen ions which induces oxygen vacancies[35].Basedonthepreviousresults[22]ondoping and co-doping of TiO2, Co-doping of Fe-N-TiO2 would be moreeffectiveinthedegradationofthedyesolution.Coming
Table6.Exploresthethree-factorCCDquadraticstatistical modelincodedfactorsisgivenbelow.
Y=77.50+5.66X1+1.23X2+23.09X3-2.97X12+11.11X2227.09X32+2.24X1X2+2.06X1X3-6.79X2X3
Inthisdevelopedmodel,thepositivecoefficientsresponsible forfavorableeffectsondegradationofdyesolutionfor X1,
Y =-16.4+23.8catalystdosage-0.464concentration
+1.375reactiontime
-11.9catalystdosage*catalystdosage
+0.00549concentration*concentration
-0.004816reactiontime*reactiontime
+0.0993catalystdosage*concentration
+0.0549catalystdosage*reactiontime
-0.002012concentration*reactiontime
X2, X3, X22, X1X2 and X1X3 ; While the negative coefficients responsible for favorable effects on degradation of dye solutionforX12,X32, X2X3.Thequadraticmodelintermsof actualfactorsisgivenby
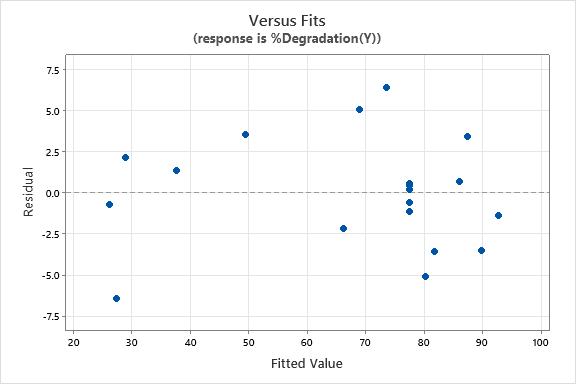
3.7.1 Validation of the model
Regressionequationmodeledwerestudiedfortheirresidual plots as shown in Fig.9(a) and Fig.9(b) representing randomizedresidualdistributionandfittedvalueswithin[7.5,7.5].Eachplotisdrawnagainstanindexofobservation ordertoexamineanylargedeviationswhichindicatesthere isnopatterninresidualdistributionwhichprovesthatthe residual is independent. Fig. 10 shows the experimental valuesareclosetothecenterdiagonalline,showingthetest issignificantlyin-linewiththenormaldistribution.Postthe results of graphical analysis, we have moved towards the numericalanalysisusingtheANOVA.
International Research Journal of Engineering and Technology (IRJET) e-ISSN: 2395-0056
Volume: 11 Issue: 03 | Mar 2024 www.irjet.net p-ISSN: 2395-0072
Table-6: Three-factorCCDModelAnalysisforObserved andPredictedresponse(Y)
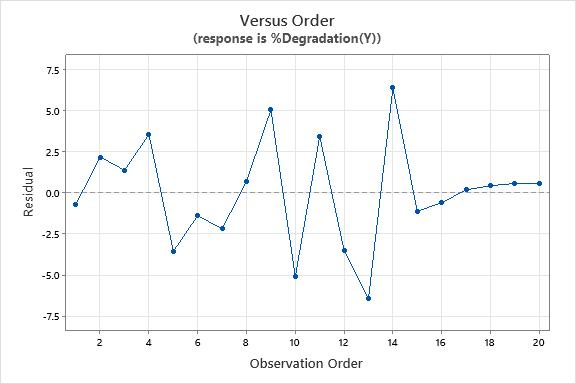
9(b): ResidualplotforObservationOrder
Theabovemodelwasstatisticalvalidatedwithsignificance of95%confidenceintervalusingANOVAasshowninTable7 andfactorswasresoluteusingp-valuesfromF-test[22]and R2. Inthismodelanalysis,thetermsX2,X12,X1 X2 and,X1 X3 were not significant, indicating variation in these factors may not ominously affect the percentage degradation. R2 = 0.9781 and the adjusted R2 = 0.9583 supports our developedmodel[22]
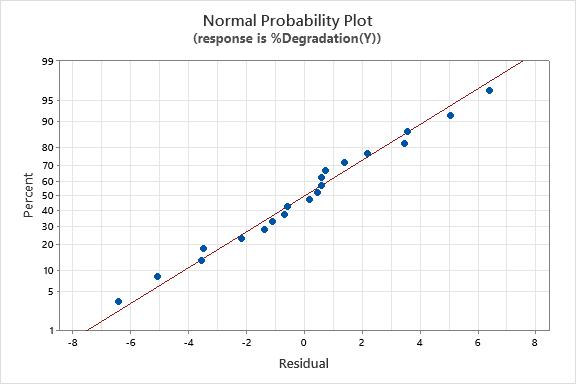
10: Normalprobabilityplot
International Research
Volume: 11 Issue: 03 | Mar 2024 www.irjet.net
Table-7: AnalysisofVarianceresultsforthepredictionofresponse
2395-0072
WecantaketheinferencefromFig.11(a),thattheinternally studentizedresidualsvspredictedresponseconfirmingthe continuous variance assumption [36]andthepoints were scattered within outlier limits [-2, +2]. Fig. 11(b) shows a minor discrepancy which can be neglected, making the predictedmodel
3.7.2 Interaction between Model Parameters & 3D Response Surface
3D response surface are plotted as shown in Fig. 12(a), Fig.12(b)andFig.12(c),showinginteractioneffectsbetween independent factors for the dye degradation. As per the obtainedresultsfromthefittedmodelasshowninTable7, among all the factors, the interaction between catalyst dosage,concentration(X1X2)andcatalystdosage,reaction time(X2X3)wereshowingnon-significanttermswhichhas least effects on degradation of dye solution. Whereas interaction between concentrations, reaction time (X2X3) shownasignificanteffectonsystemresponse.Basedonthe above, we can deduce the optimized values for the interactioneffect,whichareshownintheFig.13.
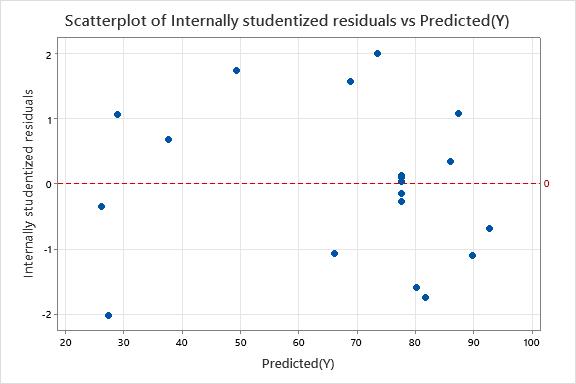
Fig.11 (a): Scatteredplotofinternallystudentized residualsvsPredicted(Y)
International Research Journal of Engineering and Technology (IRJET) e-ISSN: 2395-0056
Volume: 11 Issue: 03 | Mar 2024 www.irjet.net p-ISSN: 2395-0072
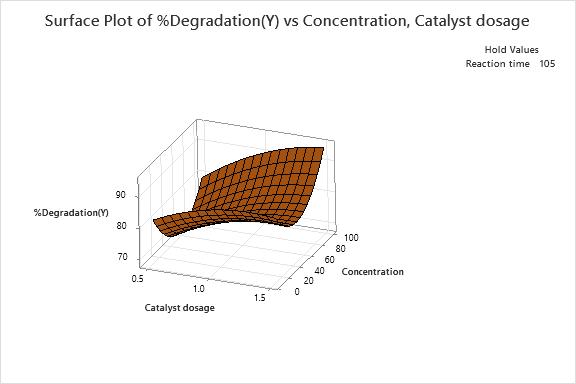
12(a): Surfaceplotof%Degradationvs Concentration(mg/l)andCatalystdosage(g)
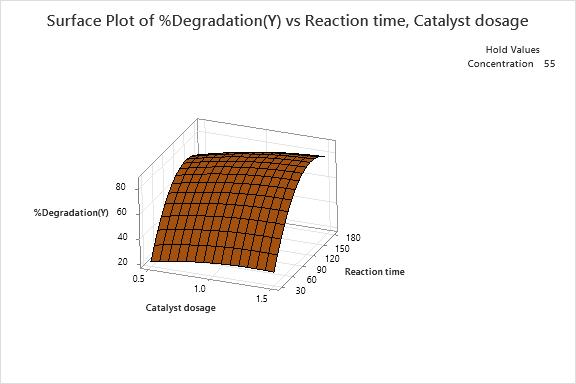
12(b):Surfaceplotof%DegradationVsCatalyst dosage(g)andReactiontime(min)
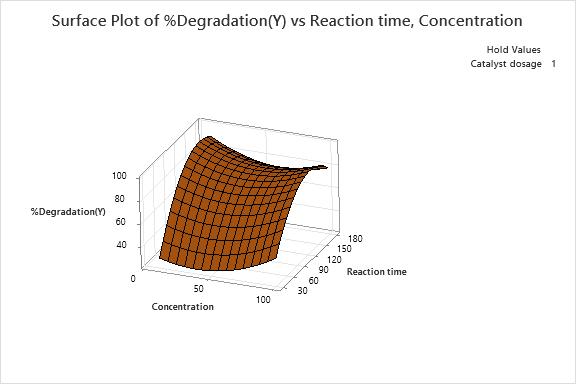
12 (c): Surfaceplotof%DegradationVs Concentration(mg/l)andReactiontime(min)
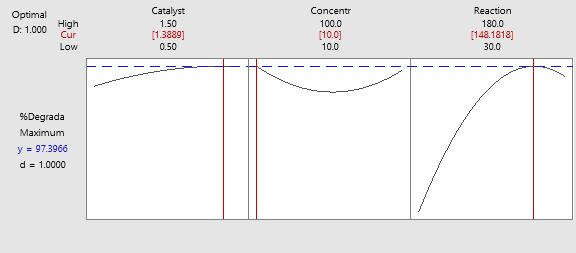
13: Optimizationplotsfortheobservedmodel
RSMAnalysiswasusedtopredictmaximumpercentageof degradationofdyesolutionunderoptimizedexperimental settings for the following factors: Catalyst dosage (X1), Concentration(X2),andreactiontime(X3).Theseparameters wereoptimizedbyusingcentralcompositedesignmethodas a part of design of experiments in the statistical software Minitab-19builtinmethod.Thedesirabilityvaluewasaimed at 1 while acquiring a percentage degradation of 97.39% under optimum conditions of the catalyst dosage of 1.388 g/250mlconcentrationof10ppmwithareactiontimeof 148 minutes. At the end, by conducting an extra set of experiments the optimum observed conditions of catalyst dosageof1.388g/250mlconcentrationof10ppmwitha reactiontimeof148minutesachieved96.2%degradation whichindicatesthevalidationofthepredictedmodel.

Thephotocatalyticfirstorderreactionrateconstantofthe %degradationwasdeterminesfromtheFig.14byplotting vsreactiontime(t)and thefirst-orderrateconstant andthecoefficientofdetermination(R2)were0.0158min-1 and0.952weredetermined.
Structural and optical properties of TiO2 altered with the additionofmetal(Fe)andnon-metal(N)byusingCo-doping mechanism was shown good results in successful employmentofsolarradiationforthedegradationoftextile dye RO86. The Characterization techniques explored the enoughinformationonselectionofcatalystbyvaryingthe compositionofNandFewithrespecttotheTiO2.Thisstudy applied Response Surface Methodology combined with 3
International Research Journal of Engineering and Technology (IRJET) e-ISSN: 2395-0056
Volume: 11 Issue: 03 | Mar 2024 www.irjet.net p-ISSN: 2395-0072
factors CCD to model the system performance that is % degradation of RO86 dye as target response. The degradationefficiencyof97.39%achievedunderoptimized conditions of the catalyst dosage of 1.388 g/250 ml, concentration of 10 ppm with a reaction time of 148 minutes.Thestudyofkineticshasgivenphotocatalyticfirst order reaction rate constant which could be utilized as a future reference on photoreactor design and scale-up studies
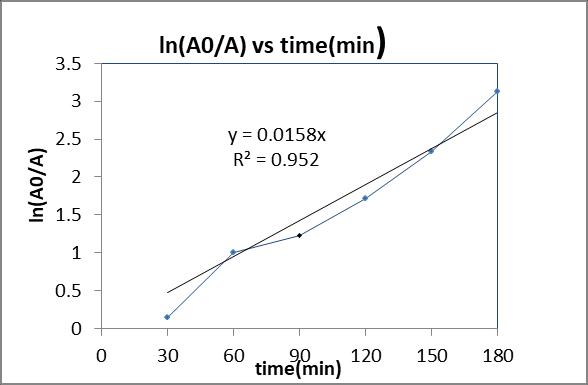
Fig.14: photocatalytictreatmentofRO86underoptimum conditions
ACKNOWLEDGEMENT
This paper is based upon work supported by University College of Technology OUCT, OU, Hyderabad and DepartmentofChemicalEngineering&CivilEngineeringat RajivGandhiUniversityofKnowledgeTechnology(RGUKT) Basar.
[1] A.Giwa,P.O.Nkeonye,K.A.Bello,E.G.Kolawole,and A. O. Campos, “Solar photocatalytic degradation of reactive yellow 81 and reactive violet 1 in aqueous solution containing semiconductor oxides,” Int. J. Appl.,vol.2,no.4,pp.90–105,2012.
[2] P. C. C. Faria, J. J. M. Orfao, and M. F. R. Pereira, “Adsorptionofanionicandcationicdyesonactivated carbons with different surface chemistries,” Water Res.,vol.38,no.8,pp.2043–2052,2004.
[3] K.Venkataraman, The Chemistry ofSyntheticDyesV4, vol.4.Elsevier,2012.
[4] M. A. Brown and S. C. De Vito, “Predicting azo dye toxicity,” Crit. Rev. Environ. Sci. Technol.,vol.23,no.3, pp.249–324,1993.
[5] A.A.Murgod,M.S.Golangade,P.B.Koli,B.Samyak, and N. M. Naik, “Photo-Oxidation Process–Application for Removal of Color from Textile IndustryEffluent,” Res. J. Chem. Sci. ISSN,vol.2231,p. 606X,2012.
[6] R. G. Saratale, G. D. Saratale, J.-S. Chang, and S. P. Govindwar, “Bacterial decolorization and degradation of azo dyes: a review,” J. Taiwan Inst. Chem. Eng.,vol.42,no.1,pp.138–157,2011.
[7] V. D. Gosavi and S. Sharma, “A general review on varioustreatmentmethodsfortextilewastewater,” J. Environ. Sci. Comput. Sci. Eng. Technol.,vol.3,no.1, pp.29–39,2014.
[8] A.ElMragui,Y.Logvina,L.PintodaSilva,O.Zegaoui, andJ.C.G.EstevesdaSilva,“SynthesisofFe-andCodoped TiO2 with improved photocatalytic activity under visible irradiation toward carbamazepine degradation,” Materials (Basel)., vol. 12, no. 23, p. 3874,2019.
[9] A. Carabin, P. Drogui, and D. Robert, “PhotodegradationofcarbamazepineusingTiO2suspended photocatalysts,” J. TaiwanInst.Chem.Eng.,vol.54,pp. 109–117,2015.
[10] L.Pirinejad,A.Maleki,B.Shahmoradi,H.Daraei,J.-K. Yang,andS.-M.Lee,“SynthesisandapplicationofFeN-Cr-TiO2 nanocatalyst for photocatalytic degradation of Acid Black 1 under LED light irradiation,” J. Mol. Liq.,vol.279,pp.232–240,2019.
[11] S.G.Ghugal,S.S.Umare,andR.Sasikala,“Enhanced photocatalyticactivityofTiO2assistedbyNb,Nand S multidopants,” Mater. Res. Bull., vol. 61, pp. 298–305,2015.
[12] M. Tahir and N. S. Amin, “Advances in visible light responsivetitaniumoxide-basedphotocatalystsfor CO2 conversion to hydrocarbon fuels,” Energy Convers. Manag.,vol.76,pp.194–214,2013.
[13] F. Tian, Z. Wu, Y. Tong, Z. Wu, and G. Cravotto, “Microwave-assistedsynthesisofcarbon-based(N, Fe)-codopedTiO2forthephotocatalyticdegradation offormaldehyde,” Nanoscale Res. Lett.,vol.10,pp.1–12,2015
[14] B. Wawrzyniak, A. W. Morawski, and B. Tryba, “PreparationofTiO2-nitrogen-dopedphotocatalyst active under visible light,” Int. J. Photoenergy, vol. 2006,2006.
[15] H.-H.Cheng,S.-S.Chen,S.-Y.Yang,H.-M.Liu,andK.-S. Lin,“Sol-Gelhydrothermalsynthesisandvisiblelight photocatalytic degradation performance of Fe/N
© 2024, IRJET | Impact Factor value: 8.226 | ISO 9001:2008 Certified Journal | Page747
International Research Journal of Engineering and Technology (IRJET) e-ISSN: 2395-0056
Volume: 11 Issue: 03 | Mar 2024 www.irjet.net p-ISSN: 2395-0072
codopedTiO2catalysts,” Materials (Basel).,vol.11, no.6,p.939,2018.
[16] X.Cao,C.Liu,Y.Hu,W.Yang,andJ.Chen,“Synthesis of N/Fe comodified TiO2 loaded on bentonite for enhancedphotocatalyticactivityunderUV-Vislight,” J. Nanomater.,vol.2016,p.1,2016.
[17] A. Sadeghzadeh-Attar, “Photocatalytic degradation evaluationofN-FecodopedalignedTiO2nanorods basedontheeffectofannealingtemperature,” J. Adv Ceram.,vol.9,pp.107–122,2020.
[18] S.Ahmadi,L.Mohammadi,C.A.Igwegbe,S.Rahdar, andA.M.Banach,“Applicationofresponsesurface methodologyinthedegradationofReactiveBlue19 usingH2O2/MgOnanoparticlesadvancedoxidation process,” Int. J. Ind. Chem.,vol.9,pp.241–253,2018.
[19] C. Thambiliyagodage and L. Usgodaarachchi, “Photocatalytic activity of N, Fe and Cu co-doped TiO2nanoparticlesundersunlight,” Curr. Res. Green Sustain. Chem.,vol.4,p.100186,2021.
[20] M. Zulfiqar, M. F. R. Samsudin, and S. Sufian, “Modelling and optimization of photocatalytic degradation of phenol via TiO2 nanoparticles: An insight into response surface methodology and artificialneuralnetwork,” J. Photochem. Photobiol. A Chem.,vol.384,p.112039,2019.
[21] J.-K. Park, G.-M. Lee, C.-Y. Lee, K.-B. Hur, and N.-H. Lee,“Analysisofsiloxaneadsorptioncharacteristics usingresponsesurfacemethodology,” Environ. Eng. Res.,vol.17,no.2,pp.117–122,2012.
[22] Y.P.LinandM.Mehrvar,“Photocatalytictreatment of an actual confectionery wastewater using Ag/TiO2/Fe2O3: optimization of photocatalytic reactions using surface response methodology,” Catalysts,vol.8,no.10,p.409,2018.
[23] T.B.Nguyen,J.P.Deloume,andV.Perrichon,“Study of the redox behaviour of high surface area CeO2–SnO2solidsolutions,” Appl. Catal. A Gen.,vol.249,no. 2,pp.273–284,2003.
[24] D. Nath, F. Singh, and R. Das, “X-ray diffraction analysis by Williamson-Hall, Halder-Wagner and size-strain plot methods of CdSe nanoparticles-a comparativestudy,” Mater. Chem. Phys.,vol.239,p. 122021,2020.
[25] L. Motevalizadeh, Z. Heidary, and M. E. Abrishami, “Facile template-free hydrothermal synthesis and microstrain measurement of ZnO nanorods,” Bull. Mater. Sci.,vol.37,pp.397–405,2014.
[26] A.Srivastava,N.Kumar,andS.Khare,“Enhancement in UV emission and band gap by Fe doping in ZnO thinfilms,” Opto-Electronics Rev.,vol.22,pp.68–76, 2014.
[27] I.Ganesh et al.,“Preparationandcharacterizationof Fe-dopedTiO2powdersforsolarlightresponseand photocatalytic applications,” Process. Appl. Ceram., vol.6,no.1,pp.21–36,2012.
[28] A.RealpeJimenez,D.Nunez,N.Rojas,Y.Ramirez,and M.Acevedo,“EffectofFe–Ncodopingontheoptical properties of TiO2 for use in photoelectrolysis of water,” ACS omega, vol. 6, no. 7, pp. 4932–4938, 2021.
[29] F. Malega, I. P. T. Indrayana, and E. Suharyadi, “Synthesis and characterization of the microstructureandfunctionalgroupbondoffe3o4 nanoparticlesfromnaturalironsandinTobeloNorth Halmahera,” J. Ilm. Pendidik. Fis. Al-Biruni,vol.7,no. 2,pp.13–22,2018.
[30] J. Song et al., “Preparation, characterization, and photocatalyticactivityevaluationofFe–N-codoped TiO 2/fly ash cenospheres floating photocatalyst,” Environ. Sci. Pollut. Res., vol. 23, pp. 22793–22802, 2016.
[31] Y.Yalçın,M.Kılıç,andZ.Çınar,“Fe+3-dopedTiO2:A combinedexperimentalandcomputationalapproach totheevaluationofvisiblelightactivity,” Appl. Catal. B Environ.,vol.99,no.3–4,pp.469–477,2010.
[32] S.D.Delekar,H.M.Yadav,S.N.Achary,S.S.Meena, and S. H. Pawar, “Structural refinement and photocatalytic activity of Fe-doped anatase TiO2 nanoparticles,” Appl. Surf. Sci.,vol.263,pp.536–545, 2012.
[33] D.Nassoko,Y.-F.Li,H.Wang,J.-L.Li,Y.-Z.Li,andY. Yu, “Nitrogen-doped TiO2 nanoparticles by using EDTAasnitrogensourceandsofttemplate:Simple preparation, mesoporous structure, and photocatalytic activity under visible light,” J. Alloys Compd.,vol.540,pp.228–235,2012.
[34] A.Mancuso,O.Sacco,D.Sannino,S.Pragliola,andV. Vaiano, “Enhanced visible-light-driven photodegradation of Acid Orange 7 azo dye in aqueoussolutionusingFe-Nco-dopedTiO2,” Arab.J. Chem.,vol.13,no.11,pp.8347–8360,2020.
[35] C.DiValentin,G.Pacchioni,andA.Selloni,“Originof thedifferentphotoactivityofN-dopedanataseand rutile TiO 2,” Phys. Rev. B, vol. 70, no. 8, p. 85116, 2004.
International Research Journal of Engineering and Technology (IRJET) e-ISSN: 2395-0056
Volume: 11 Issue: 03 | Mar 2024 www.irjet.net p-ISSN: 2395-0072
[36] C.F.Bustillo-LecompteandM.Mehrvar,“Treatment of an actual slaughterhouse wastewater by integration of biological and advanced oxidation processes: Modeling, optimization, and costeffectivenessanalysis,” J. Environ. Manage.,vol.182, pp.651–666,2016.
2024, IRJET | Impact Factor value: 8.226 |