
International Research Journal of Engineering and Technology (IRJET) e-ISSN: 2395-0056
Volume: 11 Issue: 03 | Mar. 2024 www.irjet.net p-ISSN: 2395-0072


International Research Journal of Engineering and Technology (IRJET) e-ISSN: 2395-0056
Volume: 11 Issue: 03 | Mar. 2024 www.irjet.net p-ISSN: 2395-0072
Gamero-Inda E.1., García-Moreno L.I.2 , Godínez-García F.J.1 , Martínez-Rivera J.A.1, GuerreroRivera R.1, Ortíz-Medina J1 .
1, Tecnológico Nacional de México TECNM/IT Durango, Professors, MSc. in Engineering, Durango, México. 2 TECNM/IT Durango, Student, MSc. in Engineering, Durango, México. ***
Abstract – Thepresentworkshowsthedesignandassembly of a sap flow monitoring device to perform continuous readings in trees, based on the “Heat Field Deformation” (HFD) method, through the use of “easy to get” electronic systems and circuits. Additionally, we obtained a piece of softwarethatenhancesthedeviceandmakesiteasytoswitch todifferenttypesoftrees(includingfruittrees) Thenoveltyof this proposal is to offer small and medium producers a technological,simple,andeconomicalwaytoachieveabetter and sustainable use of available irrigation water.
Key words: Agroindustry, Sap Flow Measuring, Precision Irrigation, Water Management.
1. INTRODUCTION
This project responds to a felt need for better and responsible water consumption when used for irrigation purposes,withgreatattentiontoirrigationofanorchardof fruit trees. This, is especially true in the Mexican state of Durango,wherethecultivationofappletreesisasignificant sourceofrevenueforthesmallandmediumproducersinthe municipalityofCanatlán,Durango,México.
Knowing sap flow is a unique tool for achieving precision irrigationinappletrees.Understandingthewaterneedsof appletreesisessentialtoachieveoptimalandhigh-quality production. Measuring the water status of trees provides directinformationonirrigationlimitations,which,combined withmonitoringsapflow,allowstherelationshipbetween climate and soil water to be adjusted to maintain an appropriate balance (Ferreira, et. al 2102). Precision irrigationoffersseveralbenefits,includinggreaterefficiency in water use, reduction in production costs, and an enhancementinthequalityofthefinalproduct(Siddiqi,et.al 2021). Therefore, monitoring sap flow can, significantly improvetheconsumptionofirrigationwaterinappletrees orchards.
Sapflowmeasuringisatechniquethatallowsyouto,among otherthings,managewaterusebytrees.Thistechnique,is commonlyusedtodeterminethewaterneedsofcrops.Sap flowsensorsallowforaccurate,real-timemeasurementof tree water consumption. Sensor technology has advanced significantly in recent years, allowing us to obtain greater
accuracyinsapflowmeasurements(Davis,et.al2012).The mostwidelyusedtechniquetomeasuresapflowistheheat technique(Nadezhdina,2018).Sapflowsensorsareeasyto install and can provide valuable information for precision irrigation monitoring in apple trees since using this information,thequantityofirrigationwatercancontrolfruit sizeormaximizeitincultivarswithlargerfruitsorminimize itincultivarswithsmallerfruits
Muchbetteruseofirrigationwaterinagricultureisagrave matterofdiscussionsinceclimatechangehasaffectedsome humanactivities,includingagriculture(Chartzoulakis,et.al 2015).Thecombinationofincreasedtemperatures,changes intotalannualrainfall,andpopulationgrowth,isleadingto longer periods of drought, and consequently, plants are exposedtogreaterstress.Inthefaceofthischallenge,digital technologies,suchastheInternetofThings(IoT),cancollect a good amount of data that can help producers facilitate decision-makingandpresentthemselvesasanallyforthe correctdetermination,quantityand,applicationofirrigation water.
The principal measurement variable is temperature, measured digitally using the 1-Wire Protocol since the deviceswiththisprotocolrepresentagreatadvantagefora portablesystemwithmorethanonesensor.Sincehereitis importanttoreducespaceandthenumberofconnections for the circuits. The system uses point-to-point communication where one of the nodes is responsible for collectingthedatathatinturn,istransmittedthroughradio frequencycommunicationmodules.Thereceivingnodehasa Wi-Fimodulewithwhichitispossibletouploadthisdatato thecloudforsubsequentanalysisandvisualization.
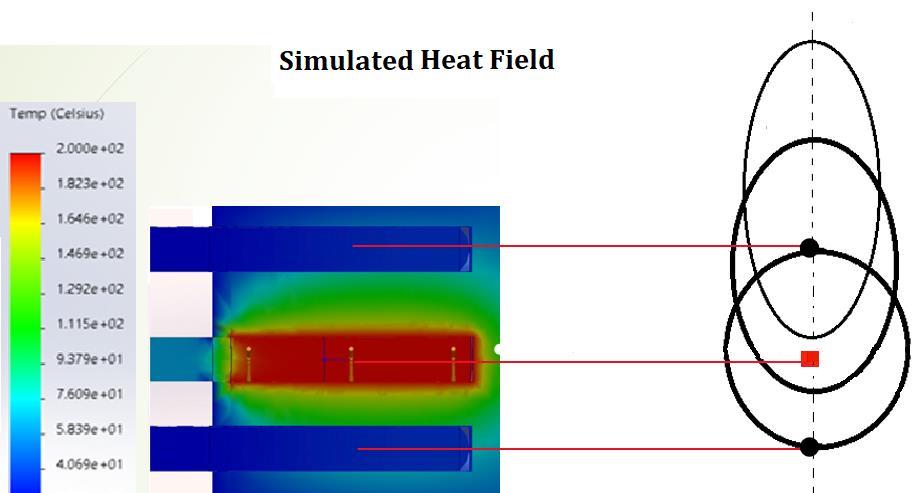
Insimpleterms,theHFDmethod(HeatField Deformation Method),asitsnameindicates,isbasedonthemeasurement oftheheatfielddeformationaroundaneedle-shapedlinear heaterinsertedinaradialdirectionintothetrunkstemof thetree.Ifwecouldseetheheatfieldfromthefront(Figure 1), it would appear as a symmetrical ellipse, due to the different thermal conductivities of the trunk fibers in the

International Research Journal of Engineering and Technology (IRJET) e-ISSN: 2395-0056
Volume: 11 Issue: 03 | Mar. 2024 www.irjet.net p-ISSN: 2395-0072
axialandtangentialdirectionsunderzeroflowconditions. Applying heat utilizing the linear heater, we can obtain a deformation in the shape of the ellipsoid of the heat field under the influence of the sap flow. The stem must be considered a complex material composed of xylem solid substance,water,andair.Theideaofthemethodarosecirca 1989 when sap flow rate, sensors based on HFD method, wereappliedtomeasuresapflowinplants(Nadezhdina,et. al,1989).Then,in2018agroupofresearchersusearelated method(Green,et.al,2018)toappletrees.Thesapflowcan significantlychangetheheatfieldbylengtheningtheellipse, asshowninFigure1
1.4 Measurement Principle.
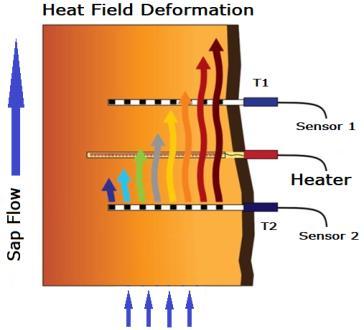
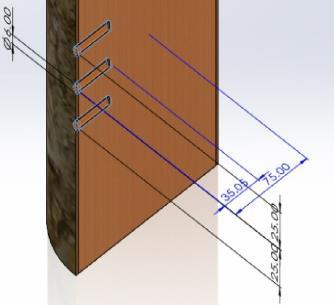
The HFD technique is a thermodynamic method based on measuring symmetrically the sapwood differential temperatureupanddownaxially(dTs)andasymmetrically (dTas) tangentially or laterally around a linear heater (Nadezhdina, 2018). The heater continuously heats the sapwoodestablishinganellipticalheatfieldunderzeroflow conditions.Figure2,a)showsgraphicallythemeasurement principlewithapossiblesensorandheatercartridgearray, and b) shows the possible distances between the sensors andtheheatercartridge.
a).
b).
Figure 2: a).Possiblesensorsandheaterarray, (ictinternational.kr, 2020),b).Possiblesensorpositionin thesapwood.
The symmetrical temperature difference allows the measurementofbidirectional(upanddown)sapflowand evenminimumflows,whiletheasymmetricaltemperature difference is mainly responsible for the magnitude of mediumandhighsapflows.Inthisproject,weonlyusethe symmetrical temperature difference. Using the ratio of measuredtemperaturedifferences(K),applyingcorrections forlocalconditionsateachmeasurementpoint,andutilizing adjustable K values,commoncharacteristicsofthemedium, suchasvariablecomponents,naturaltemperaturegradients, andwoundeffectsareidentifiedandcanbeusedtocalculate sapflow.Thevalueof K isequaltotheabsolutevalueof dTs under zero flow conditions. Under flow conditions, the K parameter can be accurately estimated, using linear regressionanalysis
Inthissection,wewillexplainthebasicdesignofthedevice andthecomponentsutilizedtosynthesizethesystem.
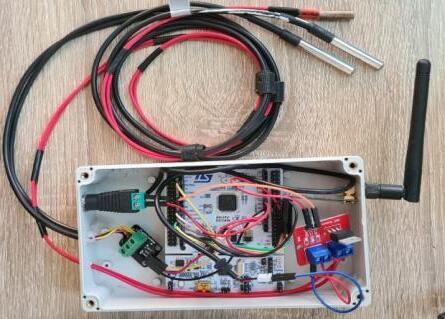
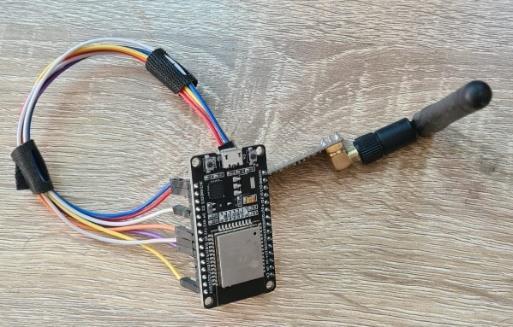
ThemeasurementmoduleconsistsofanSTM32F411Core64® microcontroller with a 32-bit ARM Cortex-M4® MicrocontrollerconnectedtotwoDS18B20digitalsensors poweredat5volts,aheatingcartridgefedbyanMOSpower modulebiasbyanindependentpowersupply.Ontheother hand,wehaveanNRF24l01®moduleresponsibleforpointto-pointwirelessradiofrequencycommunicationdirectlyto thereceivernode.Then,thereceiveruploadsthedatatothe cloudforsubsequentprocessing.
Figure 3 shows the transmitting module prototype that includesthetwotemperaturesensors,theheatingcartridge, themicrocontroller,theRFmodule,andtheothernecessary andcomplementaryelementsforthetransmittingmodule. Figure4showsthereceivingmodulewiththeRFelement.

International Research Journal of Engineering and Technology (IRJET) e-ISSN: 2395-0056
Volume: 11 Issue: 03 | Mar. 2024 www.irjet.net p-ISSN: 2395-0072
Onceinstalledthetransmittingmoduleandtheinterfaceof the receiver with the computer were connected for the functional tests, and a simple three-stage experiment was developed, introducing the sensors into a porous polyurethanefoam(shapedasabrick)capableofabsorbing water.Thesetestswerecarriedoutbyplacingthesensorsat a distance of one centimeter from above and below the heatingelementplacedinthemiddleofthefoambrick
Thedimensionsofthebrickare23centimetershighanda baseof10x10centimeters.Inthefirststage,thegreenarea showsthesensors’responsewithoutwettingthefoam.Inthe second stage, a flow of water simulating the sap flow was pouredfromthetop,andtheresponseofthesensorsarein thebluearea.Inthethirdstage,thesensorswereremoved fromthefoambrickandplacedatambienttemperature(pink area).Figure5showsthecompleteresultsofthepreliminary testsandthelocationofthesensorsandtheheater.
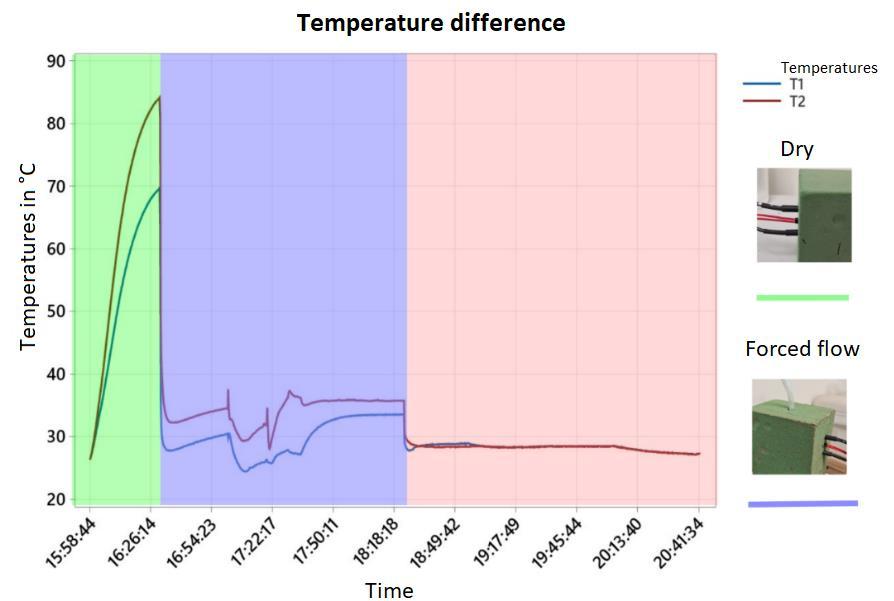
Figure 5:Preliminarymeasurementsofthesystem.
Withtheseresults,weobtainedsomeconclusionsaboutthe performance of the measurement of the implemented system; first, it is possible to differentiate T1 and T2 from each other, which is good since one of the objectives is to establish a temperature differential between the sensors. Second, as a consequence of the latter, the obtained
measurementscanbeutilizedintheprogrammedalgorithm to obtain a numerical value of the sap flow in the tree of interest.
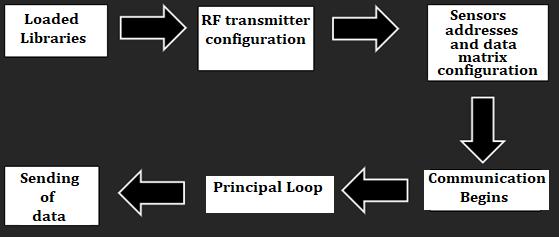
Thecodeloadedintothesendingdatadevicewasdeveloped in the STW32® programming environment, and a setting wascreatedforsendingdatatoadataarraydefinedforthe two measurements (T1 and T2), which come from the temperature sensors placed in the sapwood of the corresponding tree. It is possible to read each sensor connected to the same connection due to the 1-Wire communication protocol, and it is possible to access the informationofeachsensorthankstoourown “wire”library toadjustthemeasurementofeachsensorandthentransmit the measurement data to the receiver to be load to the platform.
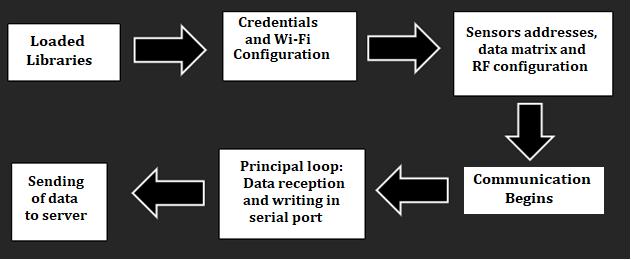
In Figure 5, you can see in the pink section how, at room temperature T1 and T2 temperatures are balanced, indicating that each sensor had almost the same measurementvaluetoreducethevariationandthusreduce the measurement error. To write the receiver code, we utilizea similarprocedureusedfor data sending,loadthe libraries for the integrated Wi-Fi, the RF communication withthereceivingantenna,andthenetworkcredentials.
UsingtheSSID(ServiceSetIdentifier)addressandnetwork password,thedataarrayparameterswereconfiguredforthe reception,alongwiththesensorandthereceivingantenna configurations;then,themaincyclebegins.Uponreceiving datafromthetransmitter,theincomingdataarewrittento the serial port and finally uploaded to the cloud platform. Thingspeak™platformperformstovisualizetheinformation. TheflowdiagramofthereceivingnodeisinFigure7,andit showsthelogicfordatauploadingtothecloudandserver forfurtherprocessing.

International Research Journal of Engineering and Technology (IRJET) e-ISSN: 2395-0056
Volume: 11 Issue: 03 | Mar. 2024 www.irjet.net p-ISSN: 2395-0072
Thefirsttestsweretoverifytheperformanceofthepoint-topointnetworkandWi-Ficommunicationconfigurationand thecorrect operationof the platforminthecloud.For the test,theemittermodulewasinstalledataheightof2meters fromthebaseofthetreewithholesof5mm.indiameter,30 mm. deep, and 25 mm. distance between the heating cartridge and both sensors. The first part of the communicationoccursintheradiofrequencyconnectionof theRFtransmitter,configuringtheaddressesofthesender andreceiverwiththesamekeytoreceivethedata;allthese werestoredinthemicroprocessor.
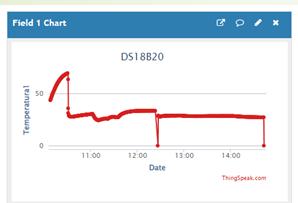
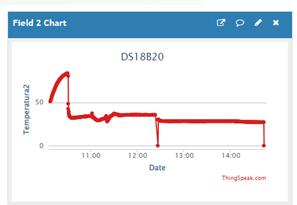
8 SampleGraphsofMeasuredTemperatures
Inthecaseofthereceiver,weconfiguredthenetworkdata, theaccesskey,andtheuserchannel,whichthenpermitsthe information to be uploaded to the platform for graphical viewing. Figure 8 shows two sample graphs of measured temperaturefromtheThingspeak™platform.UsingtheWiFi connection, data is uploaded and stored to form the measurementdatabase.
Inthissection,wewillexplaintheresultsobtainedwiththe sapflowmeasurementprototype.
Thesapflowmeasurementsystemneedstobetested,sothe prototypewasplacedtwometershighinthetrunkofatree,
asshowninFigure9.Continuoustemperaturemeasurement forthefirstperformancetestinanalivespecimenconsistsof temperature measurement for four days in an eucalyptus tree.Wechosethistreeforitsthinbarkandeasyaccessto thesapwood,inadditiontothefactthatthesetypesoftrees haveahighsapflow.
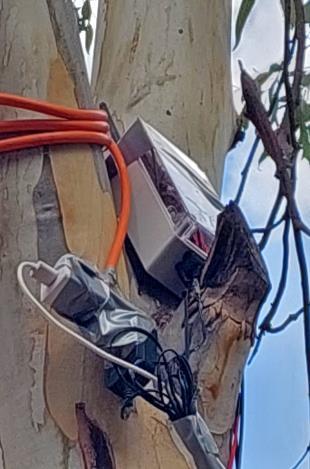
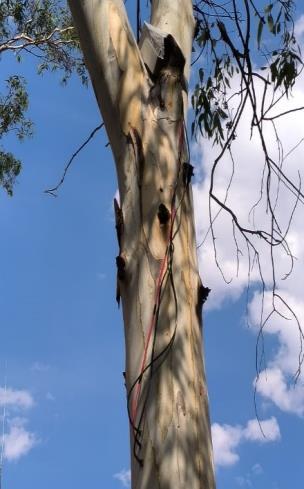
Figure 9. PlacementofSensorsandCircuitryineucalyptus tree.
Duringtwodaysconstantheatwasappliedtothetrunk,and corresponding measurements were registered. In the followingtwodays,theheatwassuspended,andmeasured temperatureswereregisteredanddisplayedinthegraphin Figure10.
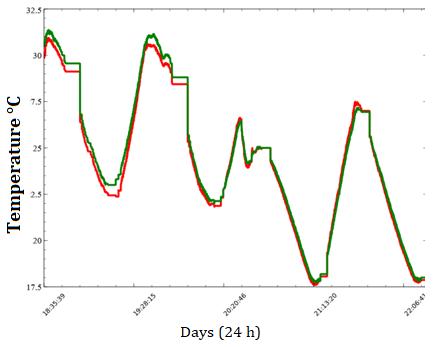
Figure 10. TemperaturesMeasuredinFourDaysTime Lapse.
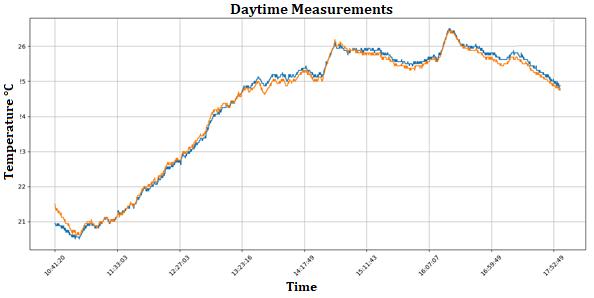
For the next temperature measurements, we placed the systeminayoungeranddifferenttree;Itwasanappletree. The measurements were taken between 10:00 and 18:00 hours,andascanbeseeninFigure11,thereisatendency fortemperaturetoraiseduringthedayandadecreasingone astheafternoonfalls

International Research Journal of Engineering and Technology (IRJET) e-ISSN: 2395-0056
Volume: 11 Issue: 03 | Mar. 2024 www.irjet.net p-ISSN: 2395-0072
The following sap flow graphs were obtained by applying equation (1) seen in previous works and using the data taken in each measurement. Equation (1), taken from Nadezhdina(2018),andwhoseparameterswereexplained insection1.4andprogrammedinPythoncode,isutilizedto obtainthevalueofsapflowgraphically.Thisequationisthe basisforthesubstitutionofdatafordifferenttypesoftrees withintheprogrammingoftheinterface,andwherethedata isadjusteddependingonthevariablesofinterest,suchas typeoftree,depth,thedistancebetweenthesensors,andthe diameteroftheanalyzedtree (1)

Thelatterisdonebecause,whencalculatingsapflowinthe algorithm, it is possible to avoid some erroneous results since data may not be changed, and the same parameters were used for another measurement. If the scenario is changed,itisalsonecessarytochangetheparametersinthe measurementsystem.
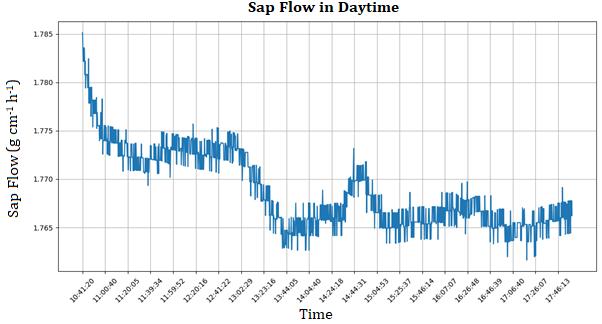
Figure12showsdaytimesapflowpersectionofapinetree testspecimen,andwecanseethatthemeasuredsapflow tendencyisaccordingtothetypicalbehaviorinatree,that sayssapflowinthemorningislessthanthatatnight,and theobtainednumericalvalueisrealisticforthatkindoftree.
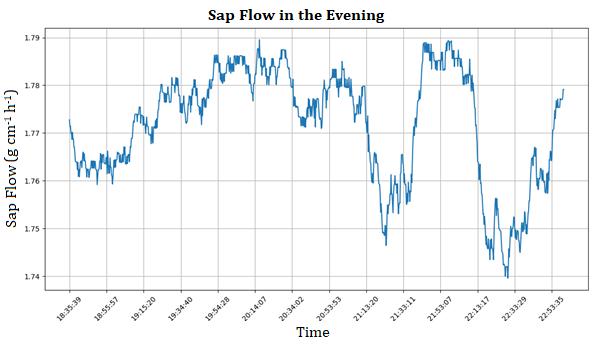
Figure13. MeasuredSapFlowintheEvening
Figure13showsthemeasuredsapflowbetween18:00and 23:00,anditpresentssomeperturbationsinitstendency, due,maybe,tosomeunseenissuesintheinstallationofthe temperature probes or the heater cartridge, but corroboratingthebehaviorofthesapflow.
This project achieved its principal objective: Design a sap flowmonitoringsystemwithlow-cost,easy-to-acquire,and cutting-edgetechnologiestoofferanefficientandlow-cost sap flow measurement system to make better and more efficient use of the water resources. The result of this research can be worthy for those who intend to develop applicationsaimedatagriculturaldevelopment,specifically inthefruittreesarea.Thesystemcangenerateadatabase that allows the producers to make better decisions when planningtheuseofavailableirrigationwater.
Ontheotherside,werecognizethesystemisonlyaworking prototype and can be improved in various aspects to enhanceitsperformance,forinstance;Theneedtorunmore testsforothertypesoftrees,designabetterpowersupply for longer operational periods, improve the handling and storage capacity of the database, and in general obtain a morerobustmeasurementsystem.
5.
[1] Siddiqi,S.A.,Al-Mulla,Y.A.,McCann,I.,AbuRumman,G., Belhaj, M., Zekri, S., ... & Rahman, S. (2021). Smart monitoring, sap-flow, stem-psychrometer and soilmoisturemeasurementstoolsforprecisionirrigationand water saving of date palm

International Research Journal of Engineering and Technology (IRJET) e-ISSN: 2395-0056
Volume: 11 Issue: 03 | Mar. 2024 www.irjet.net p-ISSN: 2395-0072
[2] Ferreira,M.I.,Silvestre,J.,Conceição,N.,&Malheiro,A. C. (2012). Crop and stress coefficients in rainfed and deficit irrigation vineyards using sap flow techniques. Irrigation, Science,30,433-447.
[3] Davis,T.W.,Kuo,C.M.,Liang,X.,&Yu,P.S.(2012). Sap flow sensors: construction, quality control and comparison Sensors,12(1),954-971.
[4] Chartzoulakis, K., & Bertaki, M. (2015). Sustainable water management in agriculture under climate change. AgricultureandAgriculturalScienceProcedia, 4, 88-98.
[5] Nadezhdina N (2018). Revisiting the Heat Field Deformation (HFD) method for measuring sap flow, iForest – Biogeosciences and Forestry, doi: 10.3832/ifor2381-011.
[6] Nadezhdina N, Čermák J (1998) The technique and instrumentationforestimationthesapflowrateinplants (inCzech).PatentNo.286438(PV-1587-98).Bureaufor InventionsandDiscoveries,Prague.
[7] NadezhdinaN,ČermákJ,NadezhdinV(1998) Heatfield deformation method for sap flow measurements. In: Čermák J, Nadezhdina N (eds) Measuring sap flow in intact plants. Proceedings of 4th International Workshop, Židlochovice, Czech Republic, IUFRO Publ. Brno,CzechRepublic:MendelUniversity,pp72–92
[8] Ictinternational.kr,(2020).