
International Research Journal of Engineering and Technology (IRJET) e-ISSN: 2395-0056
Volume: 11 Issue: 03 | Mar 2024 www.irjet.net p-ISSN: 2395-0072
International Research Journal of Engineering and Technology (IRJET) e-ISSN: 2395-0056
Volume: 11 Issue: 03 | Mar 2024 www.irjet.net p-ISSN: 2395-0072
Dr T Sankara Rao1 , A Bhanu Mythreyi2 , Ch Gayatri Sri Sowmya3, B Yasaswini4, N Lohita5
1Associate Professor, Dept. of Computer Science Engineering, GITAM University, Andhra Pradesh, India 2,3,4,5Student, Dept. of Computer Science Engineering, GITAM University, Andhra Pradesh, India
Abstract - Recognizingthetransformativepowerofdata analysis in fostering economic growth, this project endeavorstoenhancerevenuegenerationinTelanganaby focusing on its tourism and culture sector. The proposed system aims to equip the Telangana government with actionable insights to inform strategic decision-making in the tourism and culture domain. By analyzing trends and patterns related to tourist spots, domestic and foreign visitors, as well as revenue generated through taxes, the systemfacilitatesthedevelopmentoftailoredstrategiesto enrich tourism experiences, promote cultural attractions, and optimize resource allocation. To achieve these objectives,theprojectadvocatesfortheimplementationof a robust data engineering system. Data Engineering encompasses a set of operations designed to efficiently utilizedataforbusinesspurposes.Thesystem'scorefocus lies in designing and building data gathering and storage mechanisms, ensuring that raw data is meticulously prepared for in-depth analysis. Activities within the data engineering process include configuring data sources, integratinganalyticaltools,andmanagingthearchitecture oftheentiresystem.Thisprojectpositionsdataanalysisas a strategic enabler for Telangana to harness the vast potential of its tourism and culture sector. By leveraging insightsderivedfromeffectivedata analysis,thestatecan attract more tourists, encourage increased spending within its borders, and realize sustainable economic growth. Establishing a robust data analysis system is deemed crucial for Telangana to capitalize on the wealth of opportunities within its tourism and culture sector, pavingthewayforaprosperousandeconomicallyvibrant future.
Key Words: Data Engineering, Tourism, Data Pipeline, Data Warehouse, Data Visualization, Cloud Computing, StructuredQueryLanguage(SQL)
Data Engineering is a set of operations that make data efficientlyusedbybusinesses.Itisrequiredtodesignand build systems for gathering and storing data at stake and preparingitforfurtheranalysis.Itinvolvesgatheringraw datatoanalyzevaluableinsightsfromthegathereddata.It involves processes such as configuring data sources to integrating analytical tools. All these systems are to be architecture,built,andmanaged.
The data engineering process involves activities that enable us to use vast raw data for practical purposes. Stages in Data Engineering: 1. Data Ingestion 2. Data Transformation3.DataServing4.Datafloworchestration
Data Ingestion - Moves data from multiple sources to a targetsystemwhichislaterprocessedforfurtheranalysis, Data Transformation - Makes data into a valuable form of data which involves removing duplicates, and errors, normalizing the data, and converting it into the form that is required for us to perform further processes, Data Serving - Delivers transformed data to end users, Data flow Orchestration, It provides visibility into the entire processandensuresthatalltheprocessesaresuccessful
Data Pipeline - In simple terms, it is a mechanism that automatestheingestion,transformation,andservingsteps of the data engineering process. It can also be considered as a series of automated processes that move data from one system or stage to another. It combines the integration tools and connects sources to a data warehouse, and it also helps in loading information from oneplacetoanother.Theprocessesina data pipelinecan include: Extraction, Validation, Transformation, Loading, Monitoring. The data pipeline is beneficial because it would have been complicated to manually transfer data and perform extractions, transformations, and track changesindatawithoutit.
DataWarehouse-Itisacentralrepositoryforstoringdata in query able forms. It can also be considered a regular databasewhichisenhancedforreadingandqueryinghuge amountsofdata.Themainadvantageofadatawarehouse is the historical data, as the general transactional databases do not store historical data. They use data sourceslikeflatfiles,relationaldatabases,andotherforms of data. General databases normalize data by eliminating data redundancies and making them into different tables. Suchprocessesmightinvolveheavycomputationsaseach simple query demands to combine various tables. We use simple queries with fewer tables in data warehouses, improving performance. Data Analytics It involves analyzingthedatatofindvaluableinsightsanddrawvalid conclusions from the information. It involves streaming analytical results from the data processed and stored. It improvises business intelligence and helps businesses growrevenueandusedataefficiently
International Research Journal of Engineering and Technology (IRJET) e-ISSN: 2395-0056
Volume: 11 Issue: 03 | Mar 2024 www.irjet.net p-ISSN: 2395-0072
This comprehensive literature review covers the key aspects of data engineering and performance dashboards, providing a foundation for understanding their significance in analyzing tourism insights within the state ofTelangana,India.DataIntegration,Transformation,and Conversions - Effective data engineering begins with data integration, a critical foundation that facilitates the management of data from diverse sources. In the context of tourism insights analysis, data from various stakeholders, including hotels, tour operators, and government agencies, must be consolidated. Integration technologies and Enterprise Software Systems are vital tools in this process. Data Warehousing - Data warehousing plays a pivotal role in the tourism sector's data infrastructure. Understanding the distinction between Online Transaction Processing (OLTP) system and Online Analytical Processing (OLAP) system is essential. OLAP systems enable complex, multidimensional queries, making them invaluable for business intelligence and decision support in the tourism industry.
[1] Data Integration Patterns (DIP) and Enterprise Integration Patterns (EIP) contribute to effective data engineering. DIP involves mapping data elements from various sources to target data elements, providing a frameworkformodelingandtransferringdataelementsin thecontextoftourismdata.EIP,ontheotherhand,focuses on managing messaging and communication aspects within enterprise systems, complementing data integrationwithcommunicationmanagementinserviceor enterpriseapplicationintegration.
[2] Data pipelines automate data transfer, manipulation, and validation, enhancing efficiency and minimizing manual intervention. In tourism insights analysis, these pipelines are crucial for data extraction, transformation, and loading processes, ensuring that data is available for end-to-endanalysis.
[3]Datavisualizationisanessentialcomponentintourism insights analysis. It allows stakeholders to transform raw data into meaningful visual representations, revealing concealedinsights.Staticvisualizations,suchasbarcharts and pie charts, are useful for representing aggregated data, while dynamic visualizations and geospatial representationsenablereal-timemonitoringanddecisionmaking.
[4] The adoption of cloud data storage is a cost-effective shift from traditional disk-based storage. Public, private, and hybrid cloud options are available, offered by leading cloud computing providers like Amazon, Azure, and Google Cloud Platform. These services ensure scalability,
reliability, and data accessibility for tourism insights analysisinTelangana.
[5] Performance dashboards serve as vital tools for analyzing tourism insights in the state of Telangana. Originally developed for the business industry, they have found diverse applications, including tourism. Cleverley and Cleverly (2005) highlight their significance in monitoringandimprovinganorganization'sperformance, offering real-time visibility into critical performance indicators. Development and Application of DashboardsPerformance dashboards create a graphical representation summarizing decision-related data through the use of visual elements such as charts and graphs. They structure information, highlight factors for consideration, and simplify data evaluation. Dashboards areadaptablefordiversesectors,andtheirmainobjective istosupportintheprocessofmakingdecisions.
Types of Performance Dashboards - When examining insights related to tourism, three types of performance dashboards are particularly relevant: 1. Strategic Dashboards: These dashboards cater to top-level management, focusing on monitoring the execution of strategic objectives and organizational goals. 2. Tactical Dashboards: Tailored for departmental managers, tactical dashboards emphasize process tracking, analysis, and monitoring against budget and goals. 3. Operational Dashboards: These dashboards are vital for frontline professionals involved in tourism insights analysis, offering real-time monitoring of core operational processes.
Key Performance Indicators (KPIs) KPIs are essential in tourism insights analysis, helping measure progress toward organizational goals. They can encompass various categories, including visitor arrivals, popular tourist destinations, revenue generated from tourism, and visitor satisfaction.
Inconclusion,inTelangana'stourismsector,theinterplay betweendataengineeringandperformancedashboardsis indispensable for gaining valuable insights. Data integration, transformation, warehousing, pipelines, visualization,andcloudstorageprovidetheinfrastructure necessarytoprocessandanalyzetourismdata effectively. Performance dashboards offer the means to visualize and monitor these insights in real-time. Together, these components empower Telangana's tourism industry to make data-driven, informed decisions, ensuring competitiveness in the market and contributing to the state's tourism success. This literature review provides a comprehensive foundation for understanding the role of data engineering and performance dashboards in Telangana'stourisminsightsanalysis.
International Research Journal of Engineering and Technology (IRJET) e-ISSN: 2395-0056
Volume: 11 Issue: 03 | Mar 2024 www.irjet.net p-ISSN: 2395-0072
• Analyzing the district that has the highest number of touristsspots.
• Trends in tourism are based on the number of units of TSTDC (Telangana State Tourism Development Corporation) in each district and their effect on the numberofTSSartistsandtouristspots.
• Analyzing the tariff (tax) obtained by the government basedonthehotelsindifferentcitiesanddistricts.
•Analyzingthetrendsintariffbasedonthedaysofweek.
• Analyzing the tariff based on hotel price ranges of the districts.
• Analyzing the number of visitors month wise in each district
• Figuring out the district which has top number of visitors.
•Analyzingthenumberofvisitorsbasedonthenumberof touristsplaces.
• Figuring out the month in which attracts a smaller numberofvisitors.
• The district that contributes more to attracting tourists andgeneratingmorerevenue
• The districts that have more TSS artists than tourist spots,haveagreaternumberofvisitorsandothervaluable trends.
The data collected to build the system is taken from open dataTelanganawebsite(data.telangana.gov.in),whichwas launchedbyKTR,formerITMinisterofTelanganatoopen sourcetheTelanganadataandletothersaccessthedatato use for commercial or non-commercial purposes. All the insights that we generate are from the available data on thewebsiteandwill beaccurateaspertheavailabledata. In the entire project we would use the data from the mentioned website and draw useful insights which can helpthegovernmenttakedecisionsrelatedtotourismand culture.Thisprojectutilizesthebelowdata.
1. Total Tariff (Tax) collected from each hotel in different citiesbasedondaysofweek(dataupdatedasof2021).
2. Data containing information about number of tourist spots,tourismdevelopmentunitsandTSSArtists.
3. Types of visitors like foreign visitors and in country (domestic visitors) and number of visitors based on monthsfromyear2016to2020.
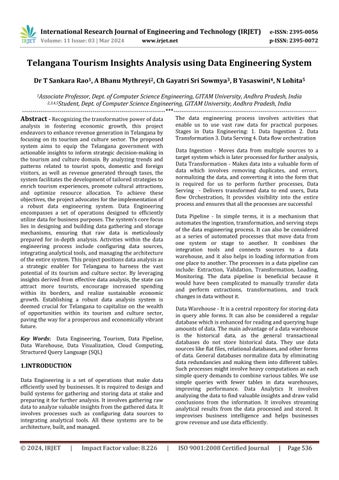
System Analysis - The system consists of three essential parts,theyaredescribedasfollows:
DataStorage:Thefirstpartservesasthefoundationofthe system, where data is stored in various formats across different locations, such as databases, local systems, and designatedstoragepoints.
Data Pipeline and Data Warehouse: The second component involves managing the data. The Data Warehouseplaysacrucialroleinstructuringdatamodels, carefully crafted through a multi-step process. This includes gathering data from various sources, making necessary changes, and combining the most important attributes from all data sources. Simultaneously, the ETL (Extract,Transform,Load)pipelineautomatestheprocess of moving data from one place to another, ensuring its smooth flow. It extracts data from multiple sources, transforms it to meet specific requirements, and loads it into the data warehouse, simplifying the data engineering process.
Data Visualization: The third component completes the system's functionality. After the data is collected, processed, and transformed, it undergoes analysis using visualization tools. This component focuses on creating user-friendly dashboards with various visual representations, such as graphs, charts, tables, and informativereports.Inessence,thiscomponentmakesthe dataaccessibleandeasytounderstand,aidingindecisionmakingandgeneratinginsights.
Bronze Layer: Raw data, which is directly obtained from thesource,muchofthisdatamightnotbeusefulforus in ourprocessofextractinginformationandinsights.
Silver Layer: This includes Transformed data, where we eliminatetheunnecessarydataandreplaceunusualdata.
International Research Journal of Engineering and Technology (IRJET) e-ISSN: 2395-0056
Volume: 11 Issue: 03 | Mar 2024 www.irjet.net p-ISSN: 2395-0072
Gold Layer: This is the critical data on which we work to generatetypicalinsights.
Docker: We utilized Docker to establish an isolated environment, enabling the installation of Apache Airflow alongside its requisite dependencies, thereby maintaining separation from the host system. Also, created a Python virtual environment within the Docker container for further encapsulation. This approach ensures a clean and self-contained setup for the Airflow project, safeguarding thelocalenvironmentfromdisruptions.
Apache Airflow: We employed Apache Airflow to create and manage our ETL (Extract, Transform, Load) pipelines. This helped us automate the process of gathering, transforming, and loading data from various sources, making our data workflows more efficient and reliable. Airflowmadeiteasiertoscheduleandmonitorthesetasks, improvingourdataprocessingcapabilities.
Mysql Workbench: WeutilizedMysqlworkbenchtostore our database, making it possible for our data pipeline to access and work with structured data. This allowed us to store and retrieve data in an organized way, making it readily available for our data processing tasks within the pipeline.
Amazon S3: We stored our data in Amazon S3 to ensure easy access and retrieval, especially when our data is updated. Amazon S3 serves as a secure and scalable storage solution, allowing us to keep our data safe and availableatalltimes.Thismeansthatwheneverourdatais refreshedorchanged,wecanstilleasilyaccessitandfetch thelatestresultswithoutanyhassle.
Snowflake: We chose to use Snowflake for our data warehousing needs. Snowflake provides a place where we can store our data in an organized and efficient manner. It's like a big storage facility where we can keep all our data safe and easy to access when we need it for analysis and other purposes. This helps us manage our data effectively.
Power Bi: We made use of Power BI to create visuals for our data. Power BI is a helpful tool that allows us to turn ourdataintomeaningfulcharts,graphs,andreports.These visuals make it much easier to understand and interpret our data, helping us make informed decisions and communicate our findings effectively. Power BI's userfriendly interface and powerful features enable us to presentourdatainavisuallyappealingandinsightfulway, makingitavaluableassetforourproject.
Datasets description
Four key datasets, namely hoteltariff, domesticvisitors, foreignvisitors, and tourismandculture, are central to this project.
hoteltariff
Attributes Data Type
Hotel text
City text
District text
Contact int
Roomtype text
TotalRooms int
SundayTariff int
MondayTariff int
TuesdayTariff int
WednesdayTariff int
ThursdayTariff int
FridayTariff int
SaturdayTariff int
domesticvisitors and foreignvisitors
Attributes Data Type
District text
Month text
Visitors_2016 int
Visitors_2017 int
Visitors_2018 int
Visitors_2019 int
Visitors_2020 int
International Research Journal of Engineering and Technology (IRJET) e-ISSN: 2395-0056
Volume: 11 Issue: 03 | Mar 2024 www.irjet.net p-ISSN: 2395-0072
tourismandculture
Attributes
Data Type
District text
tstdcunits int
touristspots int
tssartists int
ETL Pipelines:
The execution process involves ETL pipelines, which Extract,Transform, andLoadthe data.The extracted data is initially considered as the "bronze layer," and after transformation, it becomes the "silver layer." Finally, a tablewithessentialattributesiscreated,formingthe"gold layer."
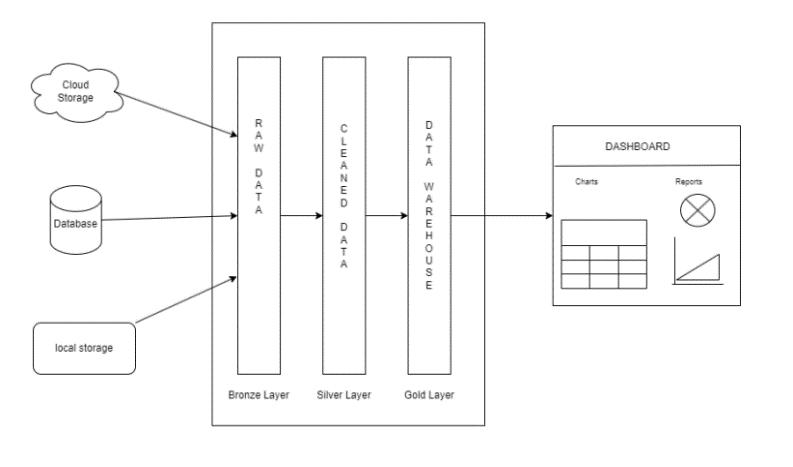
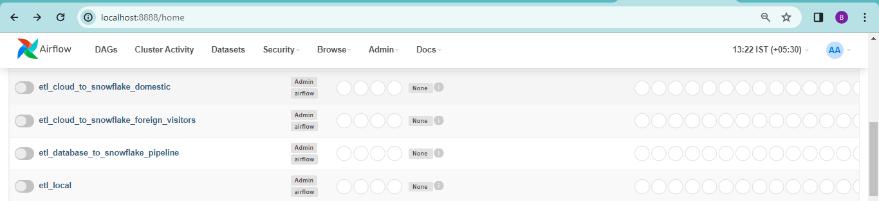
Execution Workflow:
The workflow is orchestrated through Airflow using the Python programming language. Four Directed Acyclic Graphs(DAGs)havebeenimplemented:
1.FirstDAG:
. Extraction of hoteltariff data in CSV format from the localsystem.
. Transformation includes replacing null values with strategic replacements. Weekends' tariff values are set to thehighest valueof the week,optimizing profits. Nullson weekdaysaresubstitutedwiththemodevalue.
.LoadedintotheSnowflakedatawarehousingtoolusing SQL.
2.SecondDAG:
. Extracts data from the MySQL Workbench database correspondingto tourismandculture
.Transformationinvolvesreplacingnullvalueswith0for unitsandartists,ensuringmaximumefficiency.
.LoadedintoSnowflake.
3.ThirdandFourthDAGs:
. Both DAGs share the functionality of extracting data fromAWSS3.
. Transformation involves the mean method. For domesticvisitors and foreignvisitors,theaveragenumberof visitors per district is calculated for each month throughout the year. Null values are replaced with the calculatedmean.
.LoadedintoSnowflake.
Transformation Methods:
Efficient data replacement methods, such as Mean, Median, and Mode, are employed based on dataset characteristics:
.Modeischosenfor hoteltariff,leveragingrepeatedvalues forefficiency.
. Mean is chosen for visitor data where districts attract a similarnumberofvisitors,ensuringefficiency.
DataIntegrationandVisualization:
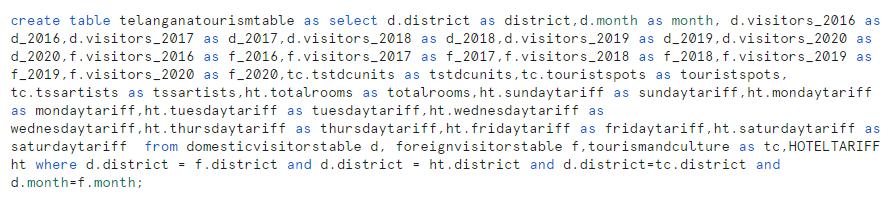
After loading into Snowflake, a new table with significant attributes is created. This "gold layer" data is then connected to Power BI, enabling the creation of diverse visualizationsforcomprehensivedataanalysis.
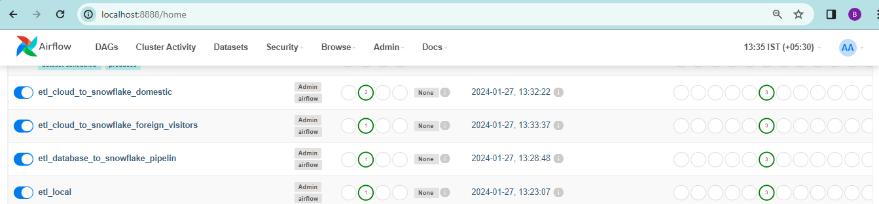
The airflow DAGs execution is illustrated in the following images.
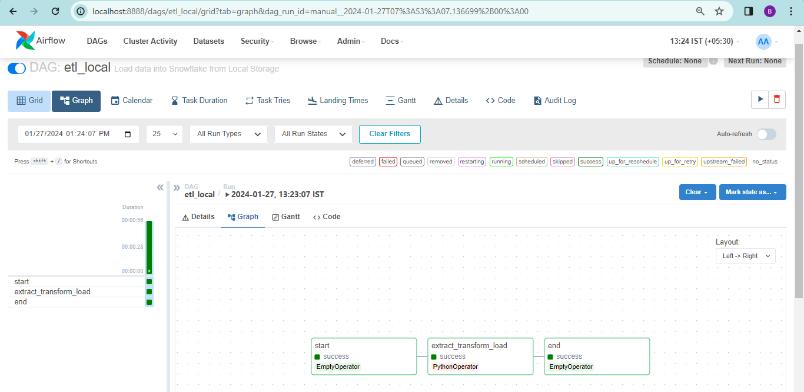
and the resulting data is stored in Snowflake as depicted below.
Similarly,allfourDAGsundergoexecution.
International Research Journal of Engineering and Technology (IRJET) e-ISSN: 2395-0056
Volume: 11 Issue: 03 | Mar 2024 www.irjet.net p-ISSN: 2395-0072
ThegenerationoftheGoldLayerisdemonstratedbelow
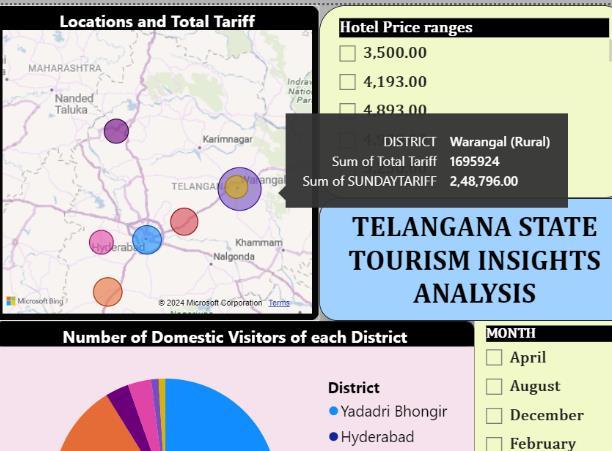
Wecangettoknowwhichdistrictgeneratesmoretariff.
7. CONCLUSION
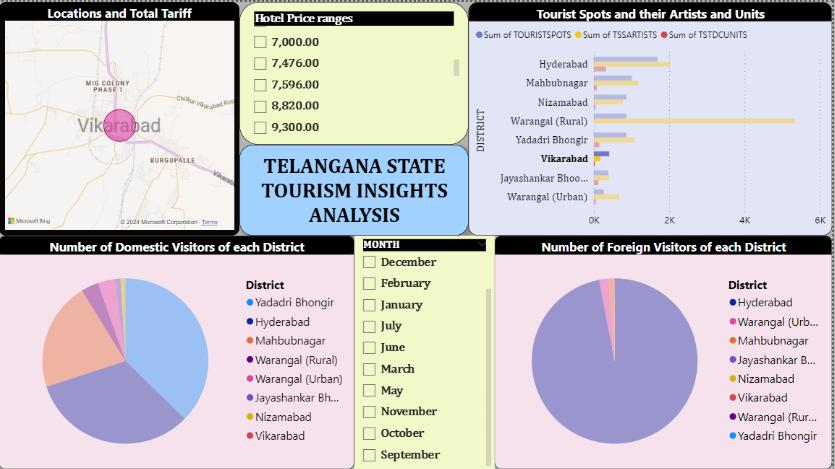
Thepictureshownbelowistheoveralldashboard.
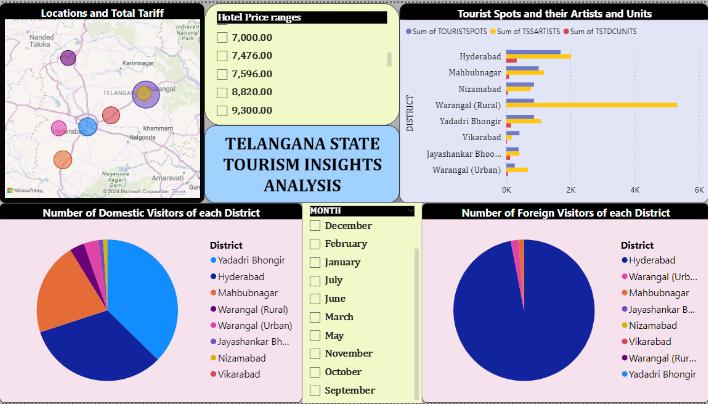
Wecanfindthenumberofdomesticandforeignvisitorsof eachdistrictateverymonth.
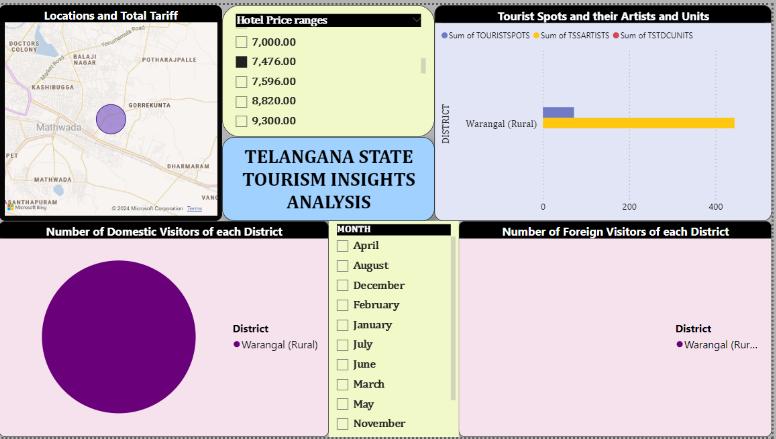
Analyzing the tariff obtained based on the hotel price rangesofthatdistrict.
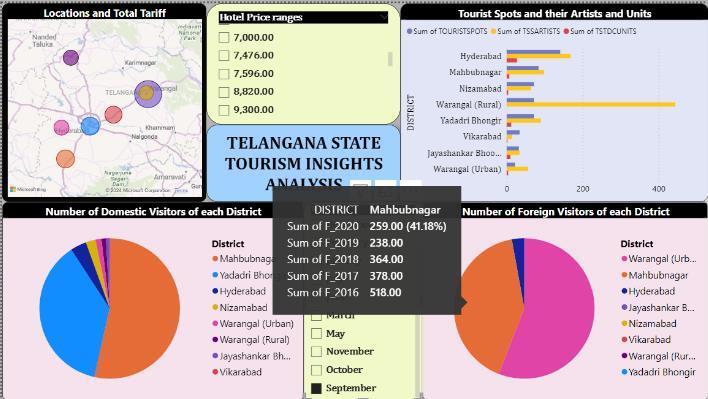
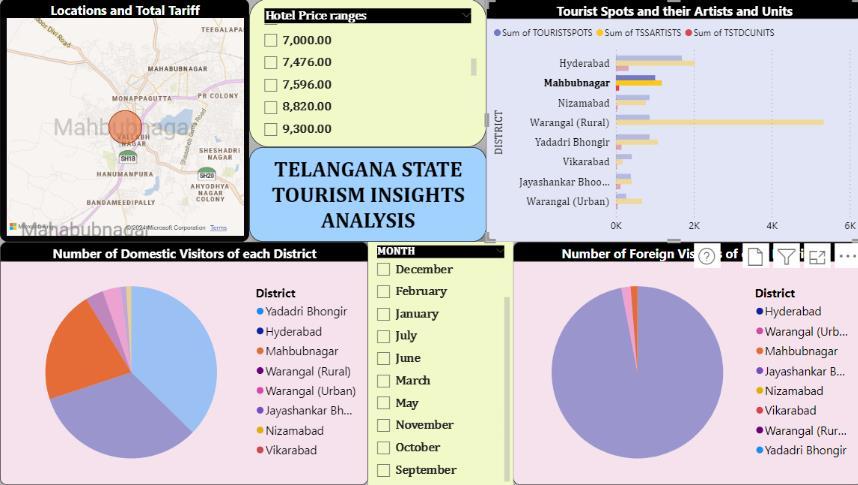
ThedistrictsthathavemoreTSSartiststhantouristspots, have a greater number of visitors and other valuable trends.
For example, if we take Mahbubnagar, it has more TSS artists than tourist spots. Hence the number of visitors is more.
International Research Journal of Engineering and Technology (IRJET) e-ISSN: 2395-0056
Volume: 11 Issue: 03 | Mar 2024 www.irjet.net p-ISSN: 2395-0072
Forexample,ifwetakeVikarabad,ithasasmallernumber of TSS artists than tourist spots. Hence the number of visitorsisnegligible.
[1] Roland J. Petranch and Richard R. Petranch, “Data Integration and Interoperability: Towards a ModelDriven andPattern-OrientedApproach”,2022,MDPI.
[2] Aiswarya raj, Jan Bosch, Helena Holmstrom Olsson, TianJ.Wang,“ModellingDataPipelines”,2020,IEEE.
[3]MatthewNOSadiku,AdebowaleE.Shadare,SarhamM. Musa,CajetanAkujuobi,“Datavisualization”,2016.
[4] Jiyi WU, jianquing FU, Zhijie LIN, jianlin ZHANG, “A surveyoncloudstorage”,Journalofcomputers,2011.
[5] Sandra C. Buttigieg, Cheryl Rathert, Adriana Pace. "Hospital Performance Dashboards: A literature review", JournalofHealthOrganizationandManagement,2017.