
International Research Journal of Engineering and Technology (IRJET) e-ISSN: 2395-0056
Volume: 11 Issue: 03 | Mar 2024 www.irjet.net p-ISSN: 2395-0072
International Research Journal of Engineering and Technology (IRJET) e-ISSN: 2395-0056
Volume: 11 Issue: 03 | Mar 2024 www.irjet.net p-ISSN: 2395-0072
Aftab Ahmad1 , Prof. Asif Husain2
1P.G. Student, Department of Civil Engineering, Jamia Millia Islamia, New Delhi, India
2Professor, Dept. of Civil Engineering, IIT Delhi, New Delhi, India
Abstract - In seismic design and engineering, the choice of earthquake scenarios and soil conditions plays a pivotalrolein ensuring the structural resilience of buildings. This studyaims to develop seismic fragility curves and comprehensively evaluate the seismic response of an 8-storeystructuresituated on stiff soil, considering both far-fault and near-fault earthquake scenarios. Thecomparativeanalysis willshedlight on the nuanced effects of ground motions originating at varying distances fromthestructure, offeringvaluable insights for seismic design and risk mitigation. For this purpose, Incremental dynamic analysis was performed and seismic fragility analysis of G+7 story moment resisting framesituated on stiff soil is utilized. Initially gravity, equivalent static and response spectrum analysis were conducted in order todesign the building according to the national building code requirements then nonlinear static pushover analysis was carried out to see the failure modes and check if there are any local failures in the structure. structure's nonlinearity was modeled using lumped plasticity to simulate the inelastic behavior of beams and columns. Selection of near-field NP (Non-Pulse) and far-field ground motions was doneaccording to ATC 63 using PEER nga-west database. IDA was performed for each group of ground motions and seismic fragility curves were developed. Modeling outcomes suggest that, in the case of two earthquakes sharing almost identical conditions, the near-fault record exhibits a greater array of displacement values. Near-fault ground motions exhibited higher recorded drift than far-field ground motions for same level of intensity both the overall and relative displacements show an incremental trend, and the significance of nonlinear behavior becomes more prominent, and the nonlinear rangeis achieved at lower percentile values.
Key Words: Near-Fault; Seismic Fragility Curves; IncrementalDynamicAnalysis(IDA);DynamicTimeHistory Analysis;Far-Fault
1.INTRODUCTION
Inseismicstudies,bothnear-fieldandfar-fieldearthquakes hold pivotal importance, offering distinct challenges and considerations for structural engineering. Near-field earthquakes, occurring near the site of interest, exhibit highergroundaccelerationsandstrongpulse-likemotions with prominent directivity effects (Erdik, M., B. Şadan 2023)[1].Theseseismicevents,typicallywithinafewtens
ofkilometersfromtheepicenter,poseuniquechallengesto structures, inducing nonlinear behavior and potential damage.Ontheotherhand,far-fieldearthquakes,situatedat a considerable distance, present different characteristics withlowergroundaccelerations,longer-durationshaking, andabroaderfrequencycontent(Bhairav,Thakur2022) [2]. Their seismic waves experience less attenuation, resulting in a more gradual decay of ground motion amplitudes.Understandingthedynamicsofbothnear-field andfar-fieldearthquakesisessentialfordesigningresilient structures. Engineers must tailor seismic design and retrofittingstrategiestoaccount for the concentratedand intense shaking of near-field events and the distributed, longer-duration shaking associated with far-field seismic waves, ensuring comprehensive resilience in seismically activeregions.Seismicfragilityanalysisisneededtoassess theprobabilityofdamagetostructuresduringearthquakes and to estimate losses before and after an earthquake. Fragility models play a crucial role in performance-based earthquakeengineering(PBEE)(V.,Bui,Tran.,Son2022) [3] by representing the probability that the engineering demandparameter(EDP)exceedsasafetythresholdgiven selectedintensitymeasures(IMs).Variousmethods,suchas empirical or analytical approaches, can be used to derive fragility curves that display the likelihood of different damage states being surpassed (Renato, Giannini., Fabrizio2022)[4].Dynamicanalysisiscommonlyusedto estimatefragilityfunctions,andstatisticalinferencemethods canbeappliedtopredictthesefunctionsandminimizethe numberofstructuralanalysesneeded.Inordertocalculate fragility functions, the definition of the limits states that characterize the state/performance of the structure is required. These limit states are defined in terms of an engineeringdemand parameter(i.e.,a form ofmeasure of the structure’s response). In this study, the maximum Interstory drift was used. The corresponding EDP (drift) valuesare1%,2%,and4%todefineastateofImmediate occupancy,lifesafety,andcollapsepreventionrespectively. ThesethresholdswereobtainedfromFEMA356(Shakeba andHamed2022)[5].Seismicfragilitymodelscanbeused forriskandvulnerabilityassessment,disastermanagement, emergency preparedness, and retrofitting prioritization (VamvatsikosandCornell2002)[6].Theobjectiveofthis research is to gather novel insights into the responses of reinforced concrete moment frames to near-fault ground motions and assess the variations compared to far-fault
International Research Journal of Engineering and Technology (IRJET) e-ISSN: 2395-0056
Volume: 11 Issue: 03 | Mar 2024 www.irjet.net p-ISSN: 2395-0072
groundmotions.Specifically,thestudyemphasizescritical parameters such as maximum top displacements, interstorey, drift ratios (IDR), probability of collapse, and responsesobtainedthroughincrementaldynamicanalysis (IDA)methodology.
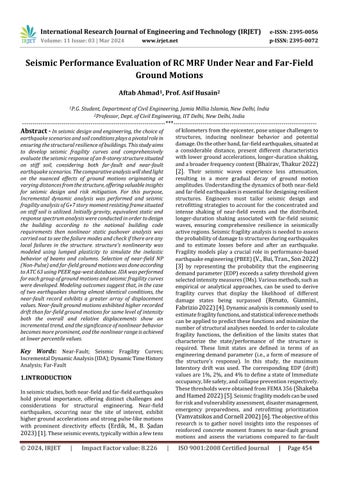
Nonlinear response history analysis (NRHA) proves valuableintheseismicassessmentofstructureswithinthe Incremental Dynamic Analysis (IDA) framework (VamvatsikosandCornell2004)[7].InIDA,theiterative application of NRHA involves employing a set of ground motions scaled to various factors, resulting in diverse responses at various levels of intensity are considered. Specifically,foranyparameterusedtodescribethestructural responseinengineering(knownasanEngineeringDemand ParameterorEDP)andameasureofintensity(referredtoas an IM), such as the 5% damped, first-mode spectral accelerationSa(T1,5%)(g),curvesknownasIncremental Dynamic Analysis (IDA) curves are created. These curves display the relationship between the EDP and IM for each record(asshowninFigure1).Traditionally,theEDP,which isthevariabledependentontheresponse,isplottedonthexaxis, while the IM, the independent variable representing intensity, is plotted on the y-axis. By examining these IDA curves,statistical distributions of response concerning the input can be illustrated using curves that depict the 16th, 50th, and 84th percentiles. (Fig. 14). The IDA curves and limit-statecapacitiesacrossallrecordscanbeconsolidated into 16, 50, and 84% fractiles based on the standard deviation (Fragiadakis and Vamvatsikos 2011) [8]. To enhance comprehension of the diverse effects of ground motion on numerical models, Figures 14(a) and 14(b) exhibitsseparateIDAcurvesandlimit-statecapacitiesacross allrecords.
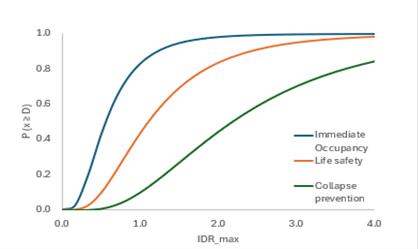
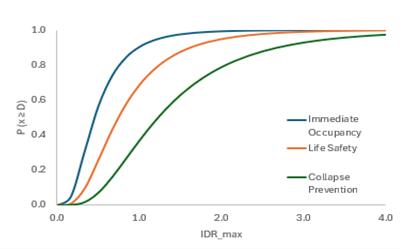
Upon the completion of the simulations and the determinationofthemaximumdisplacementatthetop of thestructureforeachgroundmotionrecord,theinitialstep involved the computation of fragility functions. This necessitatedthespecificationoflimitstatesthatcharacterize the performance of the structure. In order to assess the seismic damage states of the 8-story RC structure, the structural damage states were defined based on the allowable values of maximum inter-story drift ratios (IDRmax)of1.0%,2.0%,and4.0%.Thesevaluescorrespond totheperformancelevelsofImmediateOccupancy(IO),Life Safety(LS),andCollapsePrevention(CP),respectively.Itis worthnotingthatthelimitstatesweredescribedaccording to Table C1-3 in (FEMA 356) [9]. Subsequently, the provided formula was utilized to calculate the fragility function (BakerJW2015)[10], and the resulting plot is depicted in Figures 16(a) and 16(b). To enhance the practicalapplicabilityofthefragilityfunctions,itisadvisable to incorporate a more extensive set of ground motions, surpassing the 11 motions considered in this study. This approach ensures the development of reliable fragility functions,therebyfacilitatingaccurateseismicperformance andvulnerabilityassessments.
P (x ≥ D) = 1−0.5×(1+Erf((ln(D/μ)/2×β))
Where,P(x≥D)denotestheprobabilityofexceedanceofa specifieddamagestate'D'intermsofthedefinedEDP;Erf representstheGaussianerrorfunction;'β'isthestandard deviationofthenaturallogarithmofthedatapoints;'μ'is the median of the EDP at the given ground motion, determinedthroughexponentialregressionofuser-entered data
Ground story + 7 floor (G+7) Reinforced ConcreteMomentResistingFrameisselectedanddesignedaccording to (IS-456:2000) [11] and seismic load combinations are providedasper(IS-1893,Part1:2016)[12],andanalyzedin ETABS18.0.0.Dimensionsofcolumnsandbeamsaregivenin Table1.Thesuiteof11groundmotionisselectedfornearfault zone and far-field zone to study and compare the behaviorofstructure.Thegroundmotionscalingisdoneby matchingtheresponsespectra forzoneVwiththeground motionaccelerogram.Theguidelinesprovidedby(NajafiL.H. andTehranizadeh,M.)[13],usedforgroundmotionscaling foranytypeofsoilandengineeringdemandparameters.The Incremental Dynamic Analysis is performed. For inelastic analysistheRCframestructuremodelsareassignedwiththe properplastichingesinstructuralmemberslikebeamsand columns.Thebeamsareassignedtomomenthingesonly,and columns are assigned with the P-M-M hinges. The plastic hingesassignedtotheelementsareasperthe(FEMA-356)
International
Volume: 11 Issue: 03 | Mar 2024 www.irjet.net
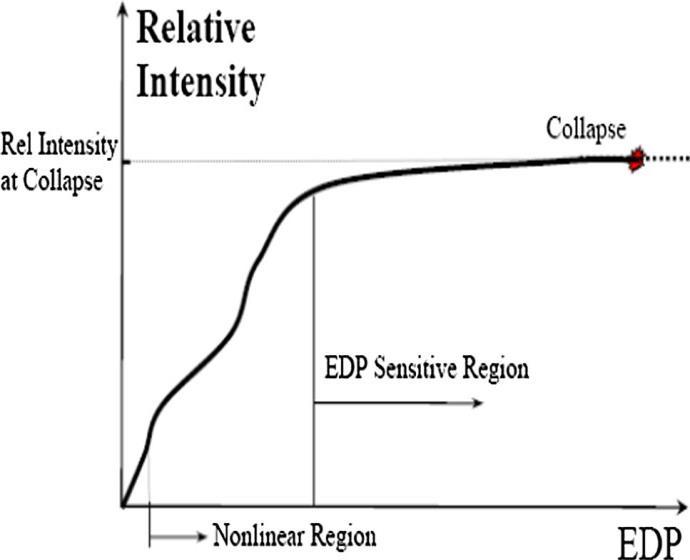
[9]and(ATC-40)[14]specified.Theseismicresponseofthe structureforhighermodesisnotconsideredasourstructure astheeffectofhighermodewillbeveryless.Thedamping ratio is kept 5% as specified in (IS-18932002) [12]. There havebeenmanyreportsontheinfluenceofgravityeffecton the calculated seismic response. In the present study, the effectofgravityloadsistakenintoaccount.Figure2depictsa structuralschematicofamulti-storybuilding,detailingthe reinforcement of its concrete members. The term "b" represents the width of beams or columns, shown as 750 mm."d"indicatestheirdepth,varyingbetween120mmand 90 mm. "s" refers to the spacing between longitudinal reinforcementbarswithinthemembers."Ptot"isthetotal percentageoflongitudinalreinforcement,and"Psh"denotes thepercentageofshearreinforcement,bothcriticalforthe structure's stability and seismic resilience. Figure 2 and 3 showselevationandplanviewofthemodelstructure.Figure 4isabackbonecurveforbeam/columninelasticplastichinge modelaccordingto(ASCE41-13)[15]
Table -1: Describes Geometrical Configuration of G+7 BuildingFrame.
Dimensions of building
25mx35m
Height of structure 25.0m
Location Guwahati,AssamState,India
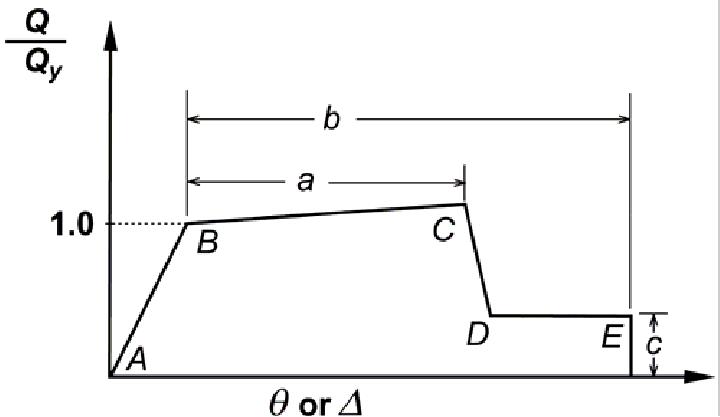
Fig - 3 Planviewofthebuilding.
Thickness of slab 150mm
Earthquake Load Zonefactor:V
Importancefactor:1
Responsereductionfactor:5
Soilcondition:Medium
Grade of concrete M30
Grade of steel Fe500 (Longitudinal bars) Fe415 (Lateral ties)
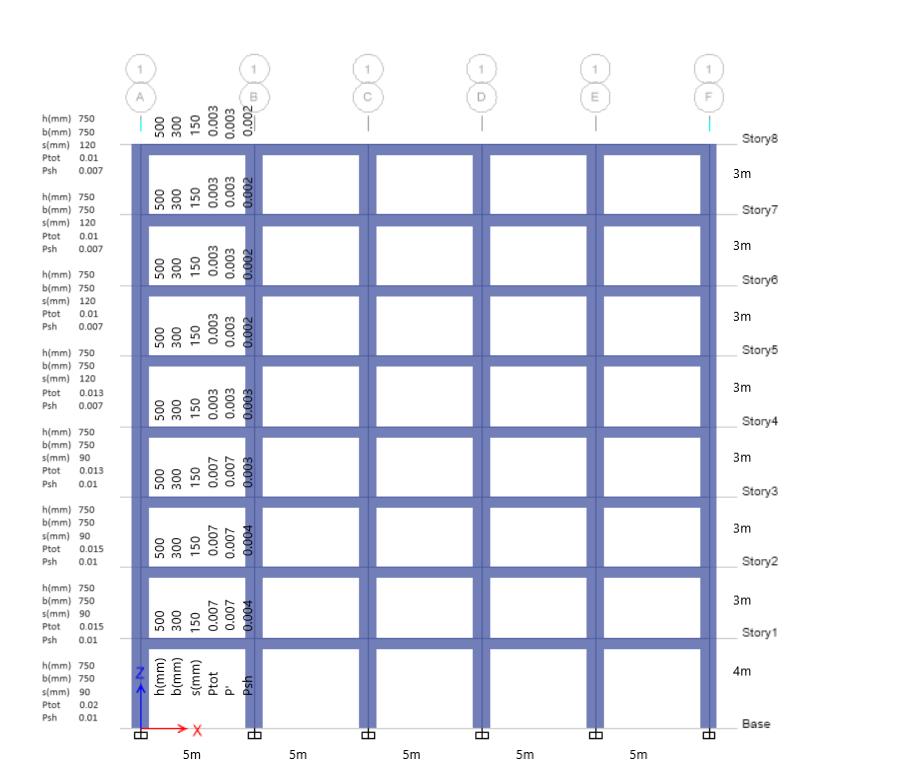
– 2: Structuraldocumentationofan8-storybuilding
International Research Journal of Engineering and Technology (IRJET) e-ISSN: 2395-0056
Volume: 11 Issue: 03 | Mar 2024 www.irjet.net p-ISSN: 2395-0072
Eleventime-historyloadsofgroundmotionwereutilizedto account for the stochastic nature of the earthquakes. The datapertainingtotheloadingwasprovidedtoETABSinthe formofanaccelerationfile,whichincludedthestepsizeand thenumberofstepsalongthein-planehorizontalaxisofthe structure.Theverticalcomponentofthegroundmotionwas disregarded.ThedatawasprocuredfromthePEERdatabase [16].Theearthquakeswerechoseninsuchamannerasto guarantee that the records accurately represent intense motion capable of causing structural collapse (Fabrizio, Paolacci 2023) [17]. Furthermore, certain minimum thresholdswereimposedonthemagnitudeoftheevents,as wellasthepeakgroundvelocityandacceleration(C.Allin Cornell2006)[18].Thesethresholdswereselectedsoasto strikeabalancebetweentheselectionofsignificantmotions andensuringthatasufficientnumberofmotionsmeetthe selectioncriteria.
a) The magnitude of the earthquakes had to exceed 6.5.
b) Thedistancebetweenthesourceandthesitehadto begreaterthan10km,whichistheaverageofthe Joyner-Boore and Campbell distances, for ground motions originating from far-field locations. For near-fieldground motions, thedistancehad to be lessthan10km.
c) The peak ground acceleration had to exceed 0.2g andthepeakgroundvelocityhadtobegreaterthan 15cm/sec.
d) The shear wave velocity of the soil in the upper 30m, for NEHRP soil types A-D, had to be greater than 180 m/s. It should be noted that all the selectedrecordshappenedtobeonC/Dsites.
e) There was a limit of six records from a single seismicevent.Ifmorethansixrecordspassedthe initialcriteria,thenthesixrecordswiththelargest peak ground velocity were selected. However, in some cases, a record with a lower peak ground velocity was used if the peak ground acceleration wassignificantlylarger.
f) The lowest usable frequency had to be less than 0.25Hz,inordertoensurethatthelowfrequency content was not eliminated during the ground motionfilteringprocess.
g) The faults considered were strike-slip and thrust faults.
The ground motions were chosen in accordance with the followingrule:theaveragespectralaccelerationresponseof alltheconsideredgroundmotionsshouldmatchorexceed andshouldnotfallbelow90%ofthemaximumconsidered earthquakewithregardstoriskovertheperiodrangeof0.2 to 2 times the highest natural period, T0, of the structure (Gandage,S.,Salgado,R.,andGuner,S.(2019)[19].Thisrule ismandatoryinmoderncodesforthestructuralanalysisof
seismicperformance.Figure5displaysthedesignspectral accelerationresponseofthewall,themaximumconsidered spectralresponse(MCR),the0.2to2timesperiodrange,and the90%targetlinefortheselectionofgroundmotion.The selectedgroundmotionsareshowninTable2and3.
Table2 Documentationofselected far-fault ground motion records.
No. Year Earthquake MW Station PGA(g)
Table 3 Documentation of selected near-fault ground motion records.
1989 Landers 74 YermoFireStation 0.51
1990 LomaPrieta 67 Capitola 0.24
1987 Manjil,Iran 67 Abbar 036
1999 LandersChi-Chi, Taiwan 73 CHY101 022
International Research Journal of Engineering and Technology (IRJET) e-ISSN: 2395-0056
Volume: 11 Issue: 03 | Mar 2024 www.irjet.net p-ISSN: 2395-0072
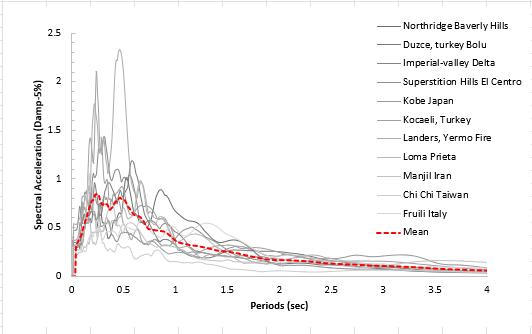
Fig.6Far-faultgroundmotions
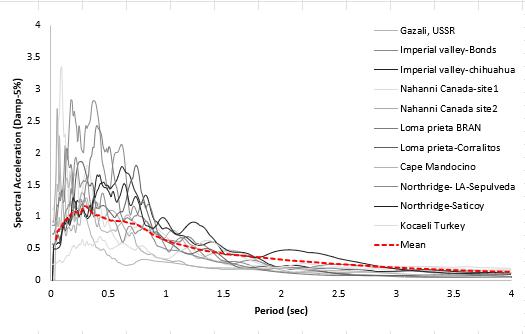
Fig.7Near-faultgroundmotions
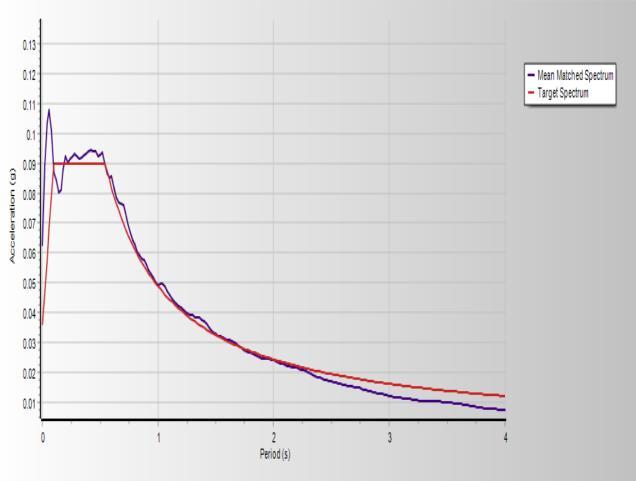
Fig.8 MeanmatchedFar-fieldgroundmotions accelerogramswithtargetspectrum.
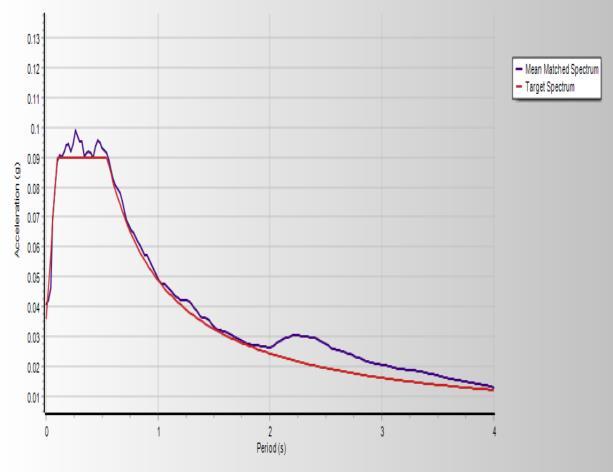
Fig.9MeanmatchedNear-fieldgroundmotions accelerogramswithtargetspectrum.
Herearetheoutcomesderivedfromtheanalysesperformed on building models exposed to near-field and far-field ground motions. The study employs incremental dynamic analysis,encompassingtheplottingandcomparisonoftotal storydisplacement,inter-storydrift(IDR),andIDAcurves. It'scrucialtounderscorethatthebuildingmodelundergoes scrutinyunderbothnear-faultandfar-faultgroundmotions, resultinginatotalof22nonlineartimehistoryanalyses.The seismicdemandparameterusedistheinter-storydriftratio, which signifies the displacement between adjacent floors divided by the story height. The nonlinear time history analysis reveals the results for an 8-story building model with a moment frame, showcasing the maximum lateral displacement under both near-fault and far-fault ground motions. It's noteworthy that far-fault motions generally entail consistent lateral displacement requirements. In contrast, near-fault conditions necessitate higher requirements.
The relative displacement between stories plays a pivotal roleindeterminingthestructure'sfailurerate,makingita crucial metric for seismic performance assessment. Upon comparing the average maximum inter-story drift ratios (IDR) under both far and near-field ground motions, a significantdifferenceisevident.Specifically,themaximum inter-story drift is observed to be 30 mm, marking a 33 percentincreasecomparedtothe22.5mmrecordedunder far-field conditions. Additionally, the maximum story displacementis235mm,indicatinga46percentincreasein comparisontothe160mmobservedinthefar-fieldscenario. The drift pattern during a far-field earthquake exhibits a more uniform distribution with less variation among differentstories,signifyingaconsistentbehaviorthroughout thebuilding'sheight.Incontrast,thenear-fieldearthquake manifests a greater fluctuation in drift between stories, particularlyattheupperlevels.Thisobservationsuggestsa
International Research Journal of Engineering and Technology (IRJET) e-ISSN: 2395-0056
Volume: 11 Issue: 03 | Mar 2024 www.irjet.net p-ISSN: 2395-0072
more pronounced influence of the near-field seismic characteristicsonthebuilding'sresponse.
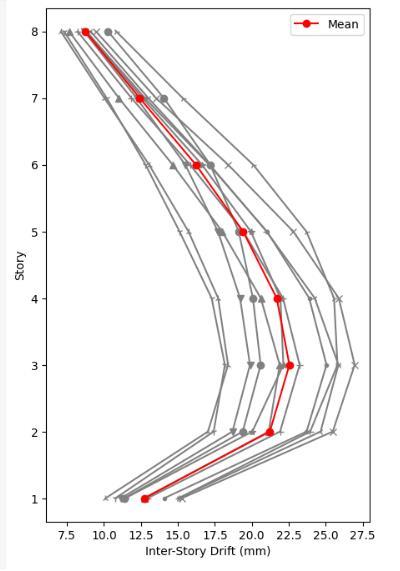
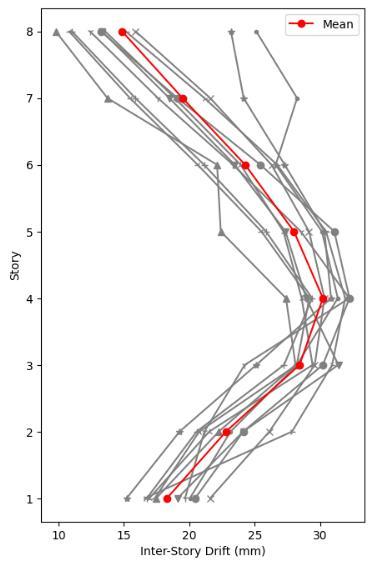
Fig.10and11SeismicResponsesfor8-storey RC frame; underfar-faultand near fault groundmotions
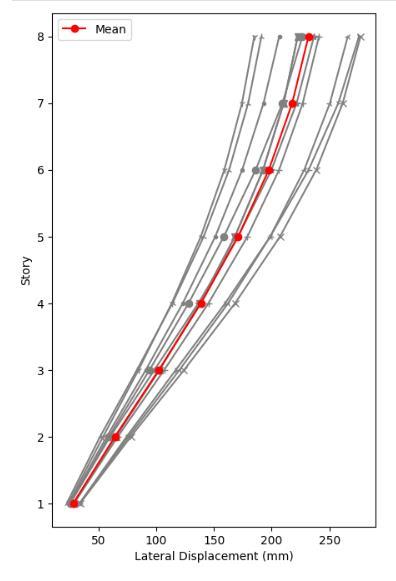
Fig.12and13Seismicresponsesfor8-storey RC frame underfarandnearfaultgroundmotions
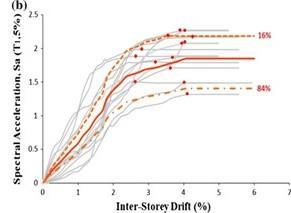
TheresultsofIncrementalDynamicAnalysisforfar-faultand near-fault earthquake scenarios is shown figure 14(a) exhibitshigherspectralaccelerationsatcorrespondinginterstorydriftlevelscomparedtofigure14(b) indicatingthat the structure has a more responsive or stiffer seismic response.Thepronounceddivergencebetweenthe16%and 84% lines in fig 14(a) denotes a greater variability in the seismicresponse,whichcouldbeattributedtofactorssuch as varying dynamic properties of the building, different modes of vibration being excited, or a broader range of possible earthquake inputs within the far-field spectrum. Conversely,fig14(b)presentsamorecondensedconfidence intervalbetweenthe16%and84%lines,whichtranslatesto amorepredictableandconsistentstructuralbehaviorunder near-field seismic conditions. This could imply that the buildinghasamoreuniformperformanceorthatthenearfieldearthquakerecordspossesslessvariabilityintermsof frequencycontentthatresonateswiththebuilding'snatural frequencies. Furthermore, the peak spectral acceleration valuesinfig14(a)surpassthoseinfig14(b),whichsuggests that the building might experience higher forces during seismic events.Thiscouldbeconsequential forthedesign anddetailingofstructuralcomponents,asitimpliesaneed forgreaterstrengthandductilitytowithstandtheseforces. In essence,theIDAcurvesdemonstratethat the structure subjected to far-field earthquake scenarios requires considerationforahigherrangeofseismicforcesandamore variableresponse,potentiallynecessitatinga morerobust designapproach.Ontheotherhand,thestructuresubjected tonear-fieldearthquakescenarios,showsa moreuniform and less forceful response, possibly allowing for a design that can be more finely tuned to a narrower range of expectedseismicactions.
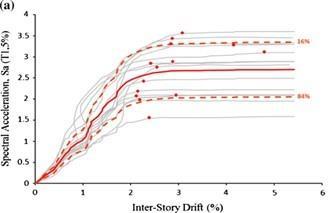
Fig.14(b)IDAcurvesfor8-storeystructure:(a)far-field earthquakerecords
International Research Journal of Engineering and Technology (IRJET) e-ISSN: 2395-0056
Volume: 11 Issue: 03 | Mar 2024 www.irjet.net p-ISSN: 2395-0072
Inseismicanalysis,thedistinctionbetweennear-faultand far-faultseismiceffectsplaysacrucialroleinunderstanding structuralbehavior.Far-faultseismicmotions,illustratedin Figure1,arecharacterizedbylower-frequencycontentand the absence of a distinct pulse. The energy input into structuresoccursgraduallyandisspreadoutoveramore extended duration. The fragility curves in Figure 1 demonstrateamoregradual increaseintheprobabilityof exceedance with rising spectral acceleration. This is attributedtothefar-faultmotionshavingalessimmediate impact on structures, allowing for increased energy dissipation over time. Understanding these distinctions is essentialfordesigningstructuresresilienttovariousseismic scenarios.Ontheotherhand,Near-faultseismiceffectsFarfaultseismicmotions,asdepictedinFigure2,exhibithighfrequencycontentandapulse-likevelocitywaveform.These characteristicscanexertsignificantdemandsonstructures, particularly those with a resonant natural period. The fragilitycurvesinFigure2(IOtoCP)illustratethisbehavior, emphasizingthesteepinitialslopes.Evenaslightincreasein ground motion intensity can substantially raise the probabilityofexceedingalimitstate,aligningwiththerapid and intense ground motions associated with near-fault earthquakes.
This research undertook an examination of the seismic performance of reinforced concrete buildings exposed to near- and far-fault ground motions using incremental dynamicanalysistechniques.Thescrutinyconcentratedon an 8-story building situated on stiff soil. Numerical simulationsrevealedthattheinfluenceofvelocitypulsesin thevelocitytimehistoryledtosubstantialdeformationsin reinforced concrete buildings, necessitating considerable energydissipationwithinoneormorecyclesofStructural PlasticsLimited.Thisrequirement-imposedlimitationson thestructure'sductilecapacity.Conversely,far-faultmotions gradually introduced input energy. Although, on average, deformationdemandswerelowerthanthoseinnear-fault scenarios,structuralsystemsunderwentmoreplasticcycles. Asaresult,thecumulativeeffectsoffar-faultrecordswere minimal.
Modelingoutcomesindicatedthat,fortwoearthquakeswith nearly identical conditions, greater displacement values were observed in near-fault scenarios. Notably, near-fault groundmotionsexhibitedhigherrecordeddriftthanfar-field groundmotions for the samelevel ofintensity measure, a
International Research Journal of Engineering and Technology (IRJET) e-ISSN: 2395-0056
Volume: 11 Issue: 03 | Mar 2024 www.irjet.net p-ISSN: 2395-0072
phenomenon attributed to differences in spectral acceleration. Near-fault ground motions demonstrated higher spectral acceleration compared to those in the far field.Consequently,thestructureexperiencedincreaseddrift witharelativelysmallerincrementofIntensityMeasure(IM) inthecaseofnear-faultgroundmotions.
The implications of this study for seismic design and retrofitting suggest that different strategies may be necessarydependingontheproximitytothefault.Near-fault seismic design might require specific considerations for energydissipationandcontrolmechanismstoaddressthe initialshockandvelocitypulse,whilefar-faultdesignmay prioritizeoverallenergyinputandductilitytohandlelongerdurationshaking.
[1] (Erdik, M., B. Şadan 2023). Near-Fault Earthquake Ground Motion and Seismic Isolation Design. doi: 10.1007/978-3-031-21187-4_9
[2] Bhairav, Thakur., Atul, K., Desai., Hemal, J, Shah., Gondaliya, Kaushik. (2022). Innovative Probabilistic Vulnerability Investigation of Nuclear Power Plant Structures under Far-Field Ground Motion. Disaster Advances,doi:10.25303/1601da14022
[3] V.,Bui,Tran.,Son,T,Mr.,Nguyen.,Van,Hap,Nguyen.,T.H.,Doan.,Duy-Duan,Nguyen.(2022).TheInfluenceof Near- and Far-field Earthquakes on the Seismic Performance of Base-Isolated Nuclear Power Plant Structures.doi:10.48084/etasr.5156
[4] Renato,Giannini.,Fabrizio,Paolacci.,Hoang,Nam,Phan., Daniele, Corritore., G, G, Quinci. (2022). A novel framework for seismic risk assessment of structures. Earthquake Engineering & Structural Dynamics, doi: 10.1002/eqe.3729
[5] (2022). Characterization of site location versus the causative fault in seismic demands of structures. Structures,doi:10.1016/j.istruc.2022.04.062
[6] VmvatsikosD,CornellCA(2002)Incrementaldynamic analysis.EarthqEngStructDyn31(3):491–514
[7] VamvatsikosD,CornellCA(2004)Appliedincremental dynamicanalysis.EarthqSpectra20(2):523–553
[8] Fragiadakis M, Vamvatsikos D (2011) Qualitative comparison of static pushover versus incremental dynamicanalysiscapacitycurves.In:Proceedingsofthe 7th hellenic national conference on steel structures, Volos
[9] FEDERAL EMERGENCY MANAGEMENT AGENCY-356: Pre-standard and Commentary for Seismic RehabilitationofBuildings.Washington,2000,pp.1-35.
[10] Baker JW (2015) Efficient analytical fragility function fittingusingdynamicstructuralanalysis.EarthqSpectra 31(1):579–599
[11] IS456:PlainandReinforcedConcrete IndianStandard CodeofPractice.BureauofIndianStandards,NewDelhi, 2000,pp.1-114.
[12] IS1893(Part1).Earthquakeloading,BureauofIndian Standards,NewDelhi,2016,pp.1-44.
[13] NAJAFI, L. H. – TEHRANIZADEH, M.: Ground Motion SelectionandScalinginPractice.PeriodicaPolytechnica CivilEngineering,Vol.59,2015,pp.233-248.
[14] Applied Technology Council, ATC-40 (1996) Seismic Evaluation and Retrofit of Concrete Buildings, Vols. 1 and2,California.
[15] ASCE41-13.:SeismicEvaluationandRetrofitofExisting buildings.AmericanSocietyofCivilEngineers,Virginia, 2013,pp.1-12.
[16] https://peer.berkeley.edu/peer-strong-ground-motiondatabases
[17] Fabrizio,Paolacci.,Renato,Giannini.,Phan,Hoang,Nam., Daniele, Corritore., G, G, Quinci. (2023). Scores: an algorithmforrecordsselectiontoemployinseismicrisk and resilience analysis. Procedia structural integrity, doi:10.1016/j.prostr.2023.01.040
[18] Jack,W.,Baker.,C.,Allin,Cornell.(2006).Spectralshape, epsilonandrecordselection.EarthquakeEngineering& Structural Dynamics, 35(9):1077-1095. doi: 10.1002/EQE.571
[19] Gandage, S., Salgado, R., and Guner, S. (2019) “FFG: Fragility Function Generator,” Macro-Enabled Excel Spreadsheet, Department of Civil and Environmental Engineering,TheUniversityofToledo,Ohio,USA