
International Research Journal of Engineering and Technology (IRJET) e-ISSN: 2395-0056
Volume: 11 Issue: 03 | Mar 2024 www.irjet.net p-ISSN: 2395-0072
International Research Journal of Engineering and Technology (IRJET) e-ISSN: 2395-0056
Volume: 11 Issue: 03 | Mar 2024 www.irjet.net p-ISSN: 2395-0072
Hafid Nanis1 , Mohamed Aly2
1Department of Geosciences, University of Arkansas, Fayetteville, Arkansas USA & College of Engineering Technology, Zuwara Libya
2Associate Professor, Department of Geosciences, University of Arkansas, Fayetteville, Arkansas USA
Abstract - Landslidesusceptibilitymodelingplaysacrucial role in sustainable development and hazard mitigation strategies. Despite the presence of numerous landslide-prone areas in Kenya, previous research has failed to address them adequately. This study aims to fill this research gap by developing a comprehensive methodology for assessing landslide susceptibility in Kenya, employing a weighted GeographicInformationSystem(GIS)andafuzzylogicmodel. The major causative factors influencing landslides, including lithology, slope, elevation, soil type, land-cover, precipitation, distancetofaultlines, distancetomajordrainages,distanceto roads,anddistancetoearthquake-occurrencelocations,were carefully investigated and weighted using the Analytical Hierarchy Process (AHP). The findings reveal that approximately 26% of Kenya's total area is susceptible to landslides. Through the integration of the weighted overlay and fuzzy logic models, four distinct landslide-vulnerability zones were identified: low, medium, high, and very high. To validatethemodels,adatasetof130historicallandslideswas employed. Remarkably, the highest zone of landslide vulnerabilityidentifiedbytheweightedoverlayandfuzzylogic models coincided with about 97% and 85% of the past landslide events, respectively. These results attest to the reliability of the developed models and their potential to contribute to future planning and the mitigation of landslide hazards in Kenya.
Key Words: Landslidesusceptibility,GIS,Kenya,weighted overlay,fuzzylogic
Landslidesposesignificantthreatsworldwide,resultingin substantial economic losses, environmental damage, and societal impacts. With the expanding population and the encroachmentofsettlementsintohazardousareas,therisks associatedwithlandslideshaveintensified[1][2](Mugagga etal.,2012;Marshak,2019).Geologistsdefinelandslidesas the downslope movement of rocks or regolith (loose unconsolidated rock and soil) due to the force of gravity. These mass movements exhibit various characteristics, includingcomposition,rateofmovement,coherence,andthe environment in which they occur, such as subaerial or submarinesettings.
Theoccurrenceoflandslidesisnotlimitedtomountainous regions; they can happen in areas with low relief as well. Weatherandclimatepatternsplayacrucialroleinlandslide occurrence.Landslidesareinfluencedbyacombinationof external triggeringfactors,suchasover-steepenedslopes, heavy rainfall, earthquakes, or volcanic eruptions, and internal inherent factors, including geological and morphologicalconditions.Geologicalfactorscompriseweak and weathered bedrock, jointed materials, fault lines, and variations in permeability. Human activities, such as improperlanduse,deforestation,excavation,andchangesin groundwatersystems,alsocontributetolandslides [2][3] (Marshak,2019,Varnes,1978)
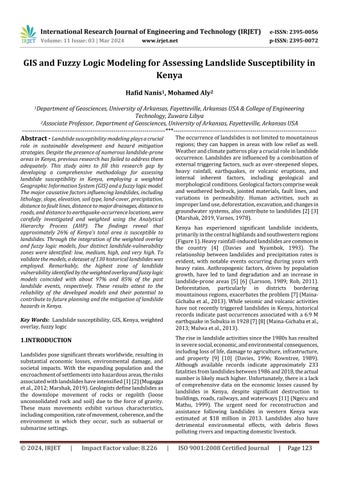
Kenya has experienced significant landslide incidents, primarilyinthecentralhighlandsandsouthwesternregions (Figure1).Heavyrainfall-inducedlandslidesarecommonin the country [4] (Davies and Nyambok, 1993). The relationship between landslides and precipitation rates is evident, with notable events occurring during years with heavy rains. Anthropogenic factors, driven by population growth, have led to land degradation and an increase in landslide-prone areas [5] [6] (Larsson, 1989; Rob, 2011). Deforestation, particularly in districts bordering mountainousregions,exacerbatestheproblem[7](MainaGichabaetal.,2013). While seismicandvolcanicactivities have not recently triggered landslides in Kenya, historical records indicate past occurrences associated with a 6.9M earthquakeinSubukiain1928[7][8](Maina-Gichabaetal., 2013;Mulwaetal.,2013).
Theriseinlandslideactivitiessincethe1980shasresulted inseveresocial,economic,andenvironmentalconsequences, includinglossoflife,damagetoagriculture,infrastructure, and property [9] [10] (Davies, 1996; Rowntree, 1989). Although available records indicate approximately 233 fatalitiesfromlandslidesbetween1986and2018,theactual numberislikelymuchhigher.Unfortunately,thereisalack of comprehensive data on the economic losses caused by landslides in Kenya, despite significant destruction to buildings,roads,railways,andwaterways[11](Ngecuand Mathu, 1999). The urgent need for reconstruction and assistance following landslides in western Kenya was estimated at $18 million in 2013. Landslides also have detrimental environmental effects, with debris flows pollutingriversandimpactingdomesticlivestock.
International Research Journal of Engineering and Technology (IRJET) e-ISSN: 2395-0056
Volume: 11 Issue: 03 | Mar 2024 www.irjet.net p-ISSN: 2395-0072
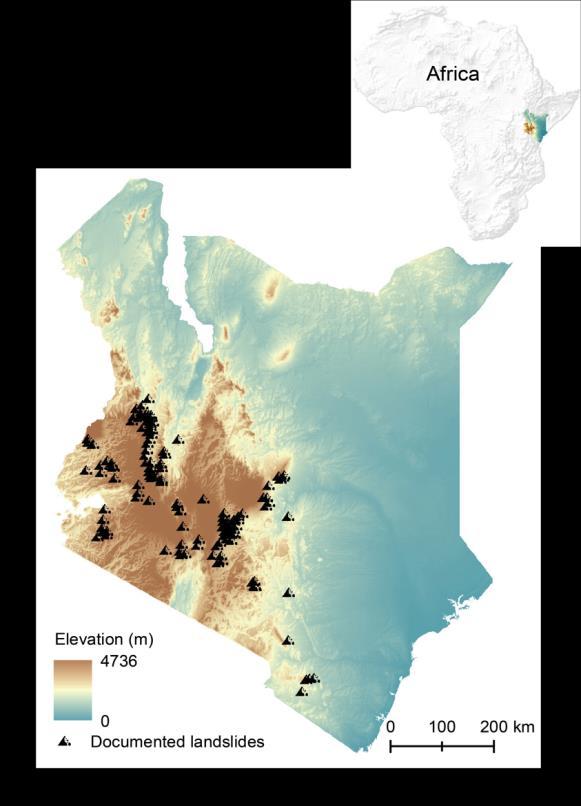
Fig -1:LocationmapofKenyashowingthedocumented landslides(blacktriangles).Thehillshadeisusedasabase map.
To address these challenges, this study aims to assess landslide susceptibility in Kenya by integrating remote sensing and Geographic Information System (GIS) technologies.Thespecificobjectivesinclude(1)creatinga landslideinventorymapfortheentirecountry,(2)acquiring and preparing necessary inputs for GIS modeling, (3) modeling landslide susceptibility, (4) validating outcomes through statistical analysis, and exploring the correlation betweenlandslidecellsandlandslideevents.Byleveraging thesetoolsandmethods,acomprehensiveunderstandingof landslide-prone areas can be achieved, aiding in effective hazard mitigation and informed decision-making for sustainabledevelopmentinKenya.
Situated in eastern Africa, the Republic of Kenya spans latitudes5°30’Nto4°30’Sandlongitudes34°00’Eto42°00’E (Figure 1). The country is divided by the equator into northern and southern regions, covering a land area of 581,61 km2. Kenya's equatorial location determines its climate,characterizedbyhotandhumidconditionsalongthe coast,temperateclimatesinthewestandsouthwest,andhot and dry climates in the north and east [12] (Climates to Travel,2019).Thecountryexperiencestworainyseasons: thelongrainsfromMarchtoMayandtheshortrainsfrom October to December. However, even between June and
September,thewesternhighlandsreceivesignificantrainfall. Precipitationlevelsrangefrom800to2,000mmannuallyin thesouthwesternpartandcoastalareas,whilethearidzone receives less than 500 mm. Notably, the El Niño weather phenomenon, occurring between May 1997 and February 1998, brought prolonged heavy rainfall, resulting in numerous landslides across the country [11] (Ngecu and Mathu,1999).Temperaturevariationsrangefrom12°Cto 36°C, with coastal regions experiencing average annual temperatures ranging from 22°C to 31°C and cooler temperatures of 12°C to 26°C in plateau areas. In 2018, Kenya's estimated population reached 51 million, representingasignificantincreaseof537%since1960when thepopulationwas8million[13](TheWorldBank,2019). The population is concentrated in high rainfall areas with fertilesoil,andapproximately90%ofthepopulationresides in rural areas, relying on agriculture for their livelihoods [10][14](Rowntree,1989;NgecuandIchang'i,1999).
Kenya'stopographycanbeclassifiedintofourmajorzones: the Coastal and Eastern Plains, the Central and Western Highlands,theRiftValleyBasin,andtheLakeVictoriaBasin. The Coastal and Eastern Plains cover approximately onethird ofthecountry andhave elevationsranging from sea level to 500 m. The Central and Western Highlands, separated by the Rift Valley Basin, encompass altitudes rangingfrom1,500to5,200m.TheRiftValley,asegmentof theEastAfricanRiftSystem(EARS),runspredominantlyina north-southdirection,withamaximumelevationof500m. TheLakeVictoriaBasin,includingLakeVictoriaitself,ranges in elevation from 500 to 1,000 m [14] (Ngecu and Mathu, 1999)
While numerous studies have explored landslides worldwide, limited research has focused specifically on landslidesinKenya[9][14][15](Davies,1996;Ngecuand Ichang'i, 1999 Kamau, 1981;). Early investigations in the 1980s by Kamau (1981) and Rowntree (1989) examined mass movements in Kangema, Murang'a District, and conductedgeographicalassessmentsoflandslidesbasedon rationalinference,respectively.Larsson(1986),Westerberg (1989),andLarsson(1989)studiedlandslidesintheCentral Kenya highlands, with the latter assessing the increase of landslidesinrelationtoland-usechangesontheslopes of Nyandarua [16] [17] [5]. Davies and Nyambok (1993) examinedtheMurang'alandslidethatclaimedeightliveson May15,1991,inGacharageVillage.Otherstudiesexplored landslidesinOlKalou[18](Johansson,1993)andconducted multidisciplinary assessments encompassing geology, hydrology,landscapeevaluation,agro-ecology,engineering, land use, and socioeconomics [19] (Christiansson et al., 1993).Ngecuand Ichang'i(1999)investigated a landslide event in Maringa village on April 30, 1997, along with its socioeconomic impact. Additionally, a few studies documented landslides triggered by the El Niño weather phenomenon during 1997-1998 [11] (Ngecu and Mathu, 1999).Subsequentstudiesexploredlandslidesignificance, distribution,andmitigationmeasuresinKenyaandUganda
International Research Journal of Engineering and Technology (IRJET) e-ISSN: 2395-0056
Volume: 11 Issue: 03 | Mar 2024 www.irjet.net p-ISSN: 2395-0072
[20] (Ngecu et al., 2004), rainfall-induced landslide probability in the central province [21] (Mwaniki et al., 2011),andthesocioeconomicandenvironmentalimpactsof landslidesinKenya[7](Maina-Gichabaetal.,2013).Remote sensingtechniqueswereutilizedtovisualizeandmappast landslidesinthecentralregionofKenya[22][23](Mwaniki etal.,2015a,2015b),whileGISwasemployedtodetermine landslide potential in the western province [24] (Nyaberi, 2016). A study compared satellite image enhancement techniquesforlandslideidentificationandmappinginthe centralregionusingsyntheticapertureradarandLandsat8 imagery[25](Mwanikietal.,2017).
Existingstudieshavehighlightedthesocioeconomicimpacts of landslides in Kenya and identified heavy rainfall in conjunctionwithnaturalgeologicalandgeomorphological conditions as primary causes of slope instability. Human activities, including road construction, excavation, and changesinlanduse,havealsocontributedtoslopefailuresin thecountry.Despitetheseinvestigations,thereisalackof comprehensive publications assessing landslide hazards using GIS and remote sensing techniques for the entire country.
Theaccuracyandreliabilityoflandslidemodelingrelyonthe quantity and quality of data obtained through scientific methods and appropriate scaling [26] (Baeza and Corominas, 2001). However, in the case of Kenya, the availability and quality of geospatial data pose significant challenges. This research faced the daunting task of data acquisitionandpreparation,ensuringthatonlyreliableand trustworthy data were utilized. Table 1 provides an overviewoftherasterandvectordataobtainedandcreated fromvarioussources.Throughmeticulousdataacquisition andpreparation,thisstudyensurestheutilizationofreliable and comprehensive datasets to enhance the accuracy and effectivenessoflandslidemodelinginKenya.
ThevectorboundaryofKenyawassourcedfromtheWorld ResourcesInstitute[27](Ndeng'eetal.,2003).Toconstruct acomprehensivelandslideinventoryfortheentirecountry, landslide events from multiple sources were combined. Forty-sixeventswereretrievedfromtheOpenDataPortalGlobal Landslide Catalog-NASA [28] (Kirschbaum et al., 2010),twoeventswereobtainedfromFatalLandslides[29] (FroudeandPetley,2018),and82eventswerederivedfrom the landslide map of Kenya provided by the Mines and Geology Department (2012) [30]. Seismic records were downloaded from the United States Geological Survey (USGS) through the Earthquake Hazards Program [31]. Kenya experiences a low to moderate level of seismic activity, with most earthquakes ranging from 3.4 to 7 in magnitudeanddepthsof10to34meters.Faulttraceswere obtainedfromtheGlobalFaultslayeraccessibleviaArcAtlas throughEsri[32](Finko,2014).Streamandroaddatawere
acquiredfromDIVA-GIS[33](Hijmansetal.,2001).Thesoil mapwasextractedfromthe2015globalsoilmapobtained fromtheUnitedStatesDepartmentofAgriculture–Natural ResourcesConservationService(USDA-NRCS)[34].
Table -1: SummaryoftheGISdatasetsusedinthisstudy.
GISlayer Typeorresolution Source
Administrative boundaries Polygon WorldResources Institute
Landslide
occurrences Point NASA&literature
Earthquakes Point USGS
Faults Line Esri
Drainages Line DIVA-GIS
Roads Line DIVA-GIS
Soil Polygon USDA-NRC
Lithology 200m USGS
Landcover 30m RCMRD
Rainfall 800m WorldResources Institute
DEM 30m USGS
Slope 30m Thisstudy
Rasterdata,includinglithologicalunits,wereextractedfrom theWorldELU2015geologicalmapobtainedfromtheUSGS, which was developed through a collaborative partnership between the USGS and Esri [35](Global Ecosystems).The main rock types encompass volcanic and metamorphic rocks, as well as unconsolidated sediments, with smaller extentsofcarbonatesedimentaryrocksandevaporites.The land cover map of 2014 was generated through the Land Cover Change Mapping program in collaboration with the Department of Resource Surveys and Remote Sensing (DRSRS),the leadgovernmentorganization,supported by the Regional Centre of Mapping of Resources for Development (RCMRD), Kenya Forest Service (KFS), and SurveyofKenya(SOK)(DRSRS,KFS,SOK&RCMRD,2016) [36].Thismapincludes11differentlandcovertypes,suchas grassland,cropland,vegetatedwetland,forest,andothers. Wooded and open grassland dominate the country's land cover.PrecipitationrecordswereobtainedfromtheWorld ResourcesInstitute[37](Hijmansetal.,2005).Theelevation map was derived from the 1 arc-sec Shuttle Radar TopographicMission(SRTM)DigitalElevationModel(DEM) obtainedfromtheUSGS'EarthExplorer[38].Theslopemap was generated from the 30-meter spatial resolution DEM, representingslopegradientsrangingfrom0%to81%.
TheflowchartdepictedinFigure2outlinesthekeystepsand methodologies employed in this study, including the applicationofweightedoverlayandfuzzylogicmodels.Due tothecomplexinteractionsamongvariouscausativefactors, no single model can serve as the optimal solution for all landslide assessments. Empirical analysis methods, which examinepastlandslidestopredictfutureoccurrencesunder
International Research Journal of Engineering and Technology (IRJET) e-ISSN: 2395-0056
Volume: 11 Issue: 03 | Mar 2024 www.irjet.net p-ISSN: 2395-0072
similar triggering conditions, are suitable for local scales ratherthanglobalscales,aslandslidecausativefactorsvary by location [39] [40] [41] [42] (Guzzetti et al., 2008; Reichenbachetal.,1998;SidleandOchiai,2006;Vennariet al., 2014). In this study, a multi-criteria decision-making methodwasemployedtoconsidertherelativecontributions of each landslide causative factor, as it is well-suited and reliableformediumtoregionalscales[43][44][45](Akgun, 2012;AyalewandYamagishi,2005;Guzzettietal.,1999).
4.1 Determining and Reclassifying the Landslide Causative Factors
To identify which cells in each thematic factor layer have experienced landslides, a GIS tool for extracting multiple valueswasutilized.Throughliteraturereviewandstatistical analysisofthecausativefactorsandthecompiledlandslide inventory map, ten factors were identified for landslide susceptibility assessment. As an example, the annual precipitation rate was chosen. The analysis revealed that only 1 landslide event (0.8%) occurred in areas with less than600mm/yr,3events(2.2%)inareaswithprecipitation ratesbetween600-700mm/yr,34events(26.4%)inareas with rates between 700-1000 mm/yr, and 92 events (approximately 71% of the total) in areas with rates exceeding 1000 mm/yr. Based on this analysis, the latter class was considered the most susceptible to landslide occurrence. Accordingly, the precipitation rate layer was reclassifiedintofourclasses:<600,600-700,700-1000,and >1000mm/yr,correspondingtolow,medium,high,andvery highsusceptibility,respectively.Table2andFigures3and4
display the documented landslides and their relationship withtheassignedclasses.
Factors that did not exhibit a discernible influence on landslideoccurrencewereexcludedfromfurtheranalysis. Forinstance,thedistributionoflandslidesacrosstheentire countrywithrespecttoaspectindicatedthatpastlandslides occurredonslopeswithvariousorientations.Therefore,the slopeaspectwasnotconsideredasacausativefactorinthis study.
Toensureconsistencyandcompatibility,allthematicmaps wereclippedtotheadministrativeboundariesofKenyaand projectedintoacommongeographiccoordinatesystem.The featureproximity(buffering)wasapplied,followedbythe conversionofpolygonstorasterformatandresamplingto match the spatial resolution of the SRTM-DEM (30 m). Finally, the thematic maps were standardized into four linear classes and utilized in the weighted overlay model (Figure3and4).Differentclassificationswereconsidered forthefuzzylogicmodel,asexplainedinthefuzzymodeling section.
The weighted overlay model employed in this study incorporates the Analytic Hierarchy Process (AHP) for weighting the identified factors, followed by a weighted linearcombination.AHPisareliablemethodforassigning weights to multiple factors using a pairwise comparison matrix. It has been widely utilized in various fields to address real-world problems [46] [47] 48] [44] [49] (Guzzettietal.,1999;Saaty,1977,1980;SaatyandVargas, 1991;AyalewandYamagishi,2005;Alyetal.,2005).
Thepairwisecomparisonmatrixinvolvescomparingeach factor with others based on its relative importance in relationtotheproblemathand.Table3presentsthescale ranging from 1 to 9, which is used for weighting the variables.Thepairwisecomparisonmatrixfortheselected causative landslide factors is displayed in Table 4, where eachcellrepresentstherelativeimportanceoftherowfactor incomparisontothecorrespondingcolumnfactor.Notably, thediagonalcellscontainavalueof1sincetheyrepresent the comparison of each factor to itself. Solving the matrix andcalculatingtheeigenvectoryieldsweightsthatindicate therelativeimportanceofeachlandslidefactor.
Toassessthematrix’sconsistency,theconsistencyratio(CR) iscomputed,whichreflectsthelikelihoodthattheratingsin thematrixwererandomlyassigned.Theratingsaredeemed acceptable when the consistency ratio is below 0.1. Consequently, the consistency index (CI) is calculated accordingtoEquation1,andCRisdeterminedusing
© 2024, IRJET | Impact Factor value: 8.226 | ISO 9001:2008
| Page126
International Research Journal of Engineering and Technology (IRJET) e-ISSN: 2395-0056
Volume: 11 Issue: 03 | Mar 2024 www.irjet.net p-ISSN: 2395-0072
Table -2: Causativefactorsandcorrespondingclasseswiththeirrelationshiptothepastlandslides.
Causativefactor Corresponding
SoilType
Aridisols(1)
Shiftingsand(0)
Alfisols(7)
Vetisols(1) Entisola(10)
(18)
International Research Journal of Engineering and Technology (IRJET) e-ISSN: 2395-0056
Volume: 11 Issue: 03 | Mar 2024 www.irjet.net p-ISSN: 2395-0072
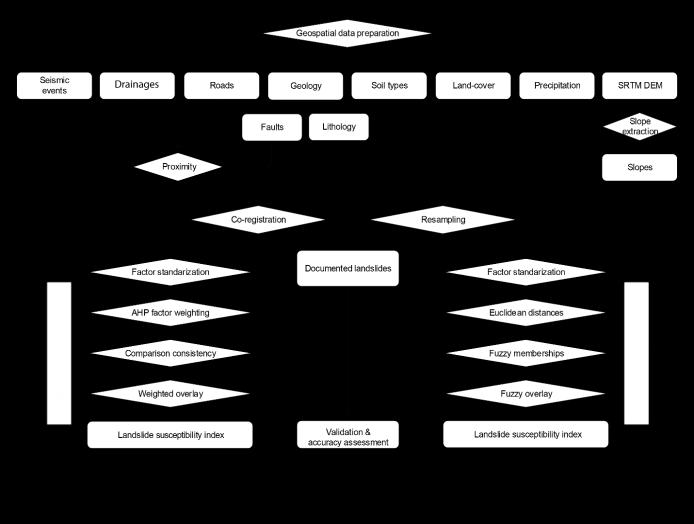
-3:Factorsusedforthelandslidesusceptibility assessment,includingelevation(a),precipitation(b), lithology(c),landcover(d),andsoil(e).
Equation2.Inthisstudy,aCRvalueof0.0034wasachieved [46][47](Saaty,1977,1980)

(1)
where λ_max represents the principle of the largest eigenvalue in the matrix, and n indicates the number of landslidefactors.

(2)
where RI is the random index determined based on the matrixorderasspecifiedbySaaty(1977,1980).
Factorsthatsignificantlycontributetolandslideoccurrence in Kenya, such as precipitation, lithology, and slope, were assignedthehighestweights(asdepictedinTable4).Finally, aweightedlinearcombinationwasperformedusingtheten inputdatalayersoutlinedintheflowcharttogeneratethe landslide susceptibility index. In this process, each input rasterlayerismultipliedbyitsrespectiveweightandthen summed, resulting in the output value denoted by S in Equation3[50](e.g.,Eastmanetal.,1995).
(3)
whereSrepresentsthelandslidesusceptibility,Wdenotes theweightoffactori,andRindicatestherankoffactori.
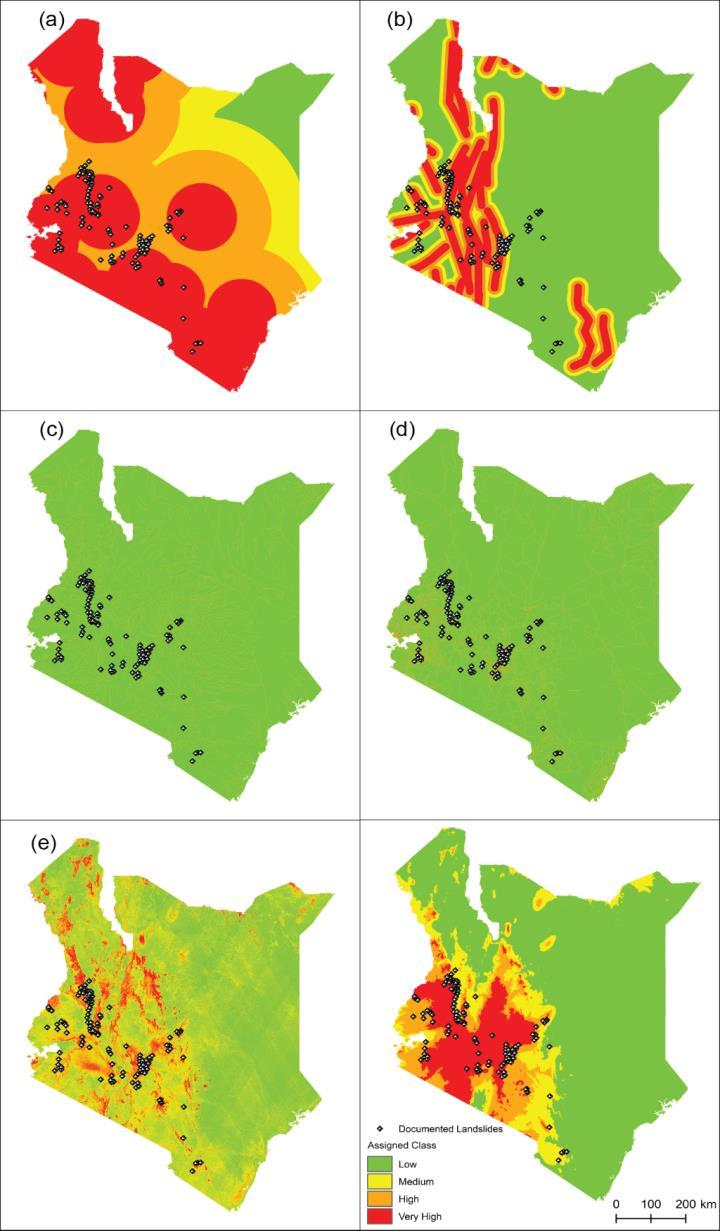
-4:Factorsusedforthelandslidesusceptibility assessment,includingearthquakes(a),faults(b),drainages (c),roads(d),andslope(e).
Volume: 11 Issue: 03 | Mar 2024 www.irjet.net
Table -3: Pairwisecomparisonscale(SaatyandVargas 1991).
Scale Definition
1
7
9
2,4,6,8
Reciprocals Forinversecomparison
Fuzzy logic is a distribution-free approach designed to overcomethelimitationsofdata-dependentapproaches[51] (Kanungoetal.,2009).ItwasintroducedbyZadeh(1965)as analternativetotheconventionalBooleansettheory,which assigns objects binary values of 0 or 1. In contrast, fuzzy logicallowsfortheassignmentofcontinuousvalues.Afuzzy set represents a class of objects with a continuum of membershipranks,characterizedbyamembershipfunction that assigns values between 0 and 1 to each object. Fuzzy membershiptransformsinputrasterdataintoalayerwith values ranging from 0 to 1, reflecting the probability of membershipwithinaspecificset.Fuzzymemberswithina setareassignedvalues>0and≤1,whilethoseoutsidethe setareassigned0.Variousconceptscanbeappliedtofuzzy sets, including inclusion, union, intersection, complement, relation, convexity, and other relationships, implemented usinglogicaloperatorssuchasAND,OR,NOT,Product,Sum, andGamma[52][53](Zadeh,1965;Bonham-Carter,1994).
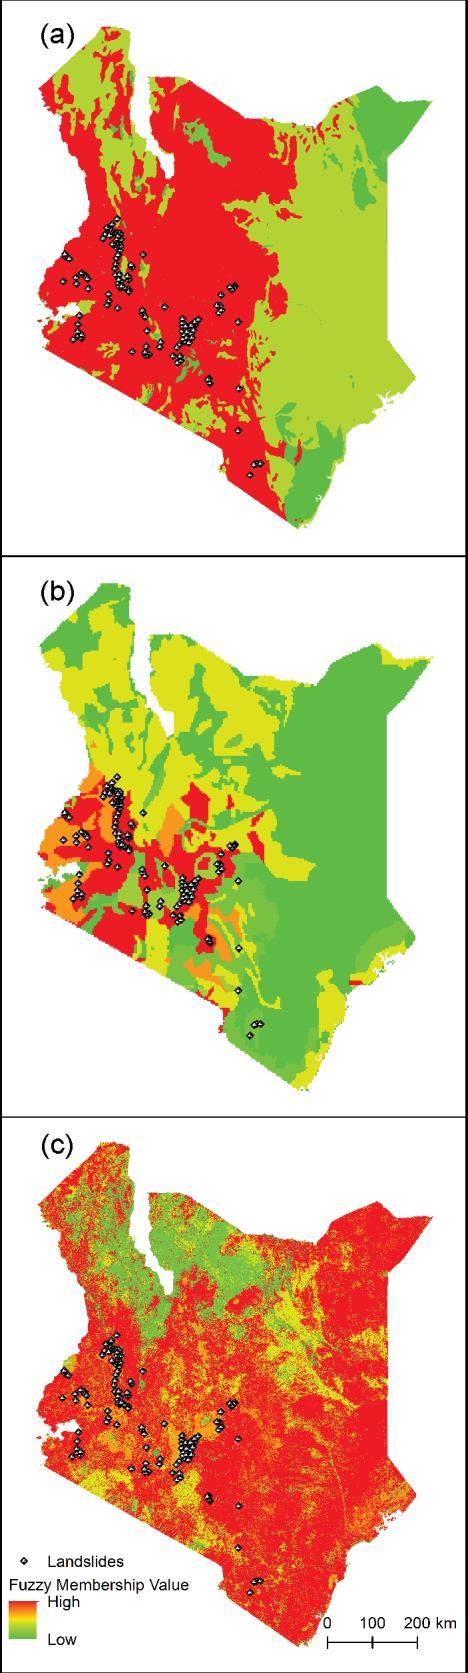
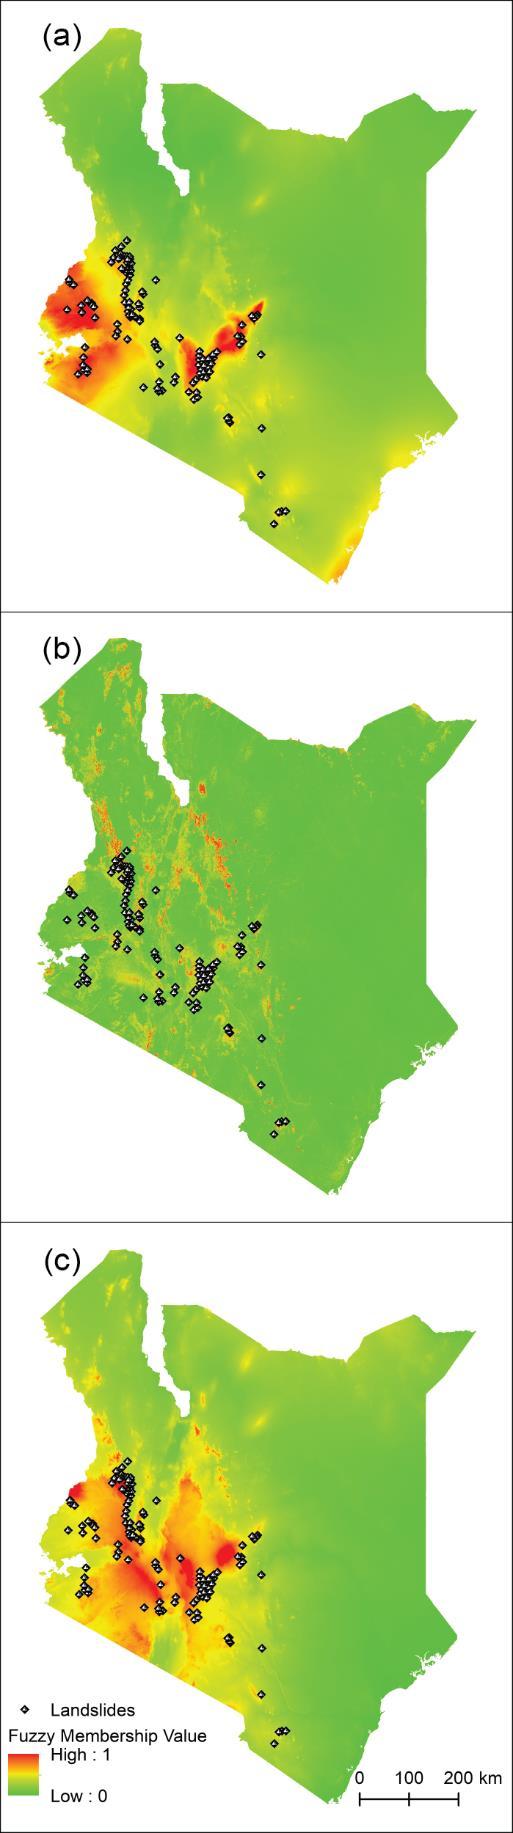
In this study, fuzzy modeling was performed using algorithms implemented in ArcGIS, including Fuzzy Small, FuzzyNear,andFuzzyLinear.Oneofthekeystepsinfuzzy modeling and fuzzy memberships is the calculation of Euclidean distance, representing the shortest distance betweentwopoints.Euclideandistanceswerecomputedfor fourcontributingvariables:faults,earthquakes,drainages, androads.FuzzySmallwasappliedtofaults,earthquakes, drainages,androads,aimingforsmallinputvaluesforset membership with spread of 0.2, 2, 1, and 1, respectively. Figure 5 presents the results of applying Fuzzy Small to thesevariableswithdifferentvaluesasshownineachfigure FuzzyNear,ontheotherhand,assignsmembershipvalues near a specific value, with the midpoint assigned a membershipof1andtheendvalueassignedamembership of 0. For lithology, soil, and land cover raster factors, reclassification was performed to 6, 8, and 8 classes, respectively,withthehighestvalueassignedamembership of 1. For example, in lithology, class 6 was assigned a membership of 1. Figure 6 provides an overview of this process. Linear data such as precipitation, slope, and elevation were transformed using the Fuzzy Linear transformation,asshowninFigure7.
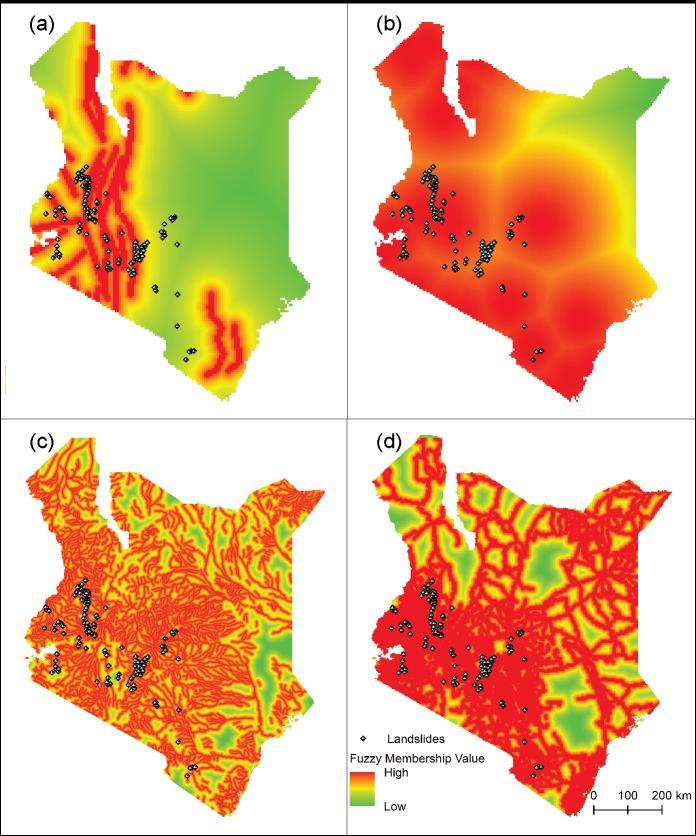
-5:FuzzySmallmembershipsincludingfaults(a), earthquakes(b),drainages(c),androads(d).
Ultimately,fuzzyoverlaywasappliedtocreatethelandslide susceptibilityindexusingtheFuzzyGammaoperator,which hasbeeneffectivelyusedinlandslidesusceptibilitymapping [51](e.g.,Kanungoetal.,2009).TheFuzzyGammaoperator isexpressedalgebraicallybyEsriasacombinationofFuzzy ProductandSum,asshowninEquation4:
(4)
where μ represents the fuzzy membership function, x representstheuniverse,and��isachosenvaluewithinthe rangeof0to1.
Theevaluationofalandslideassessmentmodel'squalityis crucial to ensure its reliability and the production of acceptable results. The primary criterion for quality evaluation is the accuracy of the model, which involves examiningtheagreementbetweenthemodeledresultsand the observed data [54] (e.g., Frattini et al., 2010). In this study, the observed data consist of past documented landslide events represented in the landslide inventory, while the modeled results are the generated landslide susceptibility indices. Statistical analysis was conducted using Equation 5 to compare the known landslide occurrenceswiththeproducedlandslidesusceptibility
Volume: 11 Issue: 03 | Mar 2024 www.irjet.net
Table -4: Pairwisecomparisonmatrixforthelandslidesusceptibilityindex.
=0.0051 RI=1.49 CR=0.0034
International Research Journal of Engineering and Technology (IRJET) e-ISSN: 2395-0056
Volume: 11 Issue: 03 | Mar 2024 www.irjet.net p-ISSN: 2395-0072
International Research Journal of Engineering and Technology (IRJET) e-ISSN: 2395-0056
Volume: 11 Issue: 03 | Mar 2024 www.irjet.net p-ISSN: 2395-0072
indices. This analysis provides a quantitative measure of how well the model aligns with the observed landslide occurrences, allowing for an assessment of the model's performanceandreliability.
(5)
whereArepresentstheaveragemodelaccuracy,Ndenotes the number of landslides within each susceptibility index, andTisthetotalnumberoflandslides.
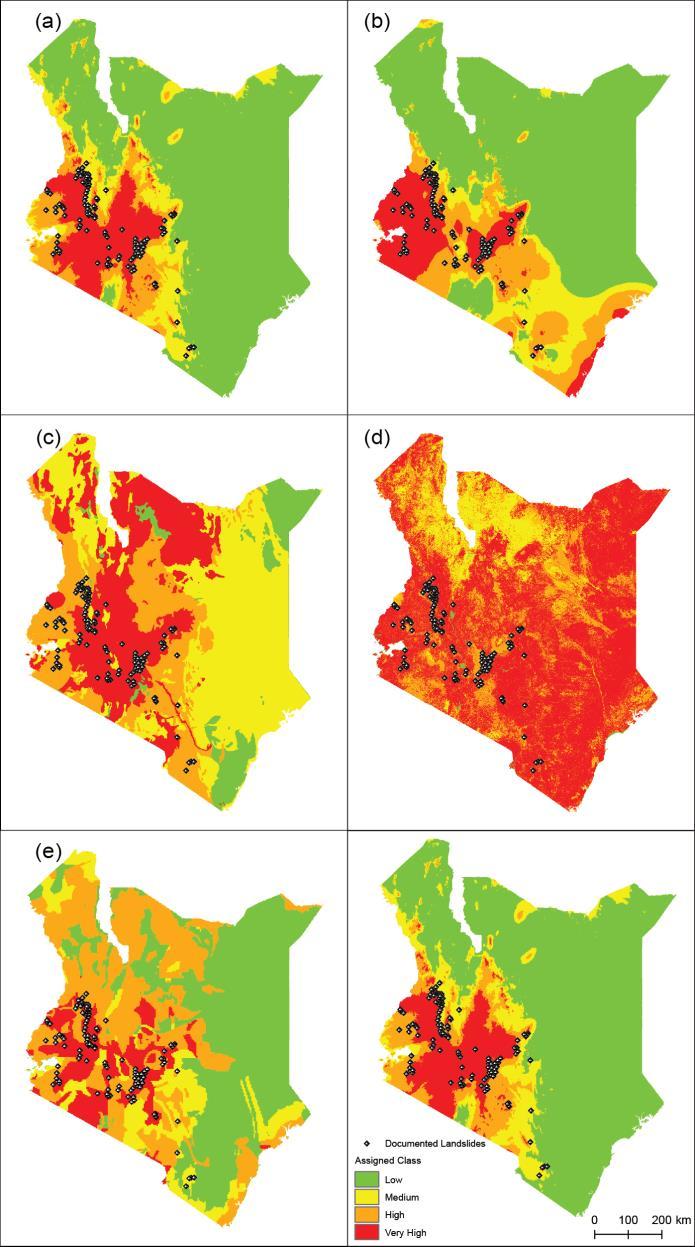
Thisstudyhasproducedvaluableoutcomesintheformofa landslide inventory map and two landslide susceptibility models. The landslide inventory map displays the distribution of past and current landslides in Kenya, encompassing130eventsthatoccurredbetween1928and 2018(Figure1).Itisimportanttonotethattheaccuracyof thesusceptibilitymodelsreliesontheavailabledocumented landslidedata,andfurtherimprovementscouldbeachieved withalargernumberofrecordedevents.Nonetheless,the created models remain reliable and offer utility for future planningandmitigatinglandslidehazardsinKenya. ThecentralandsouthwesternregionsofKenyaexhibitthe highestsusceptibilitytolandslides,asindicatedbythetwo susceptibility models. These areas are characterized by a combinationoffactorsincludinghighrainfall,steepslopes, andweatheredsoilandbedrock conditions.The weighted overlaymodelclassifiesKenyaintofoursusceptibilityindex classes (Figure 8.a): low, medium, high, and very high, coveringapproximately34%,40%,22%,and4%ofthetotal area, respectively (Table 5). The high and very high susceptibility classes encompass about 26% of the entire country, corresponding to an area of 151,22 km2 that is vulnerabletoactivelandslides.
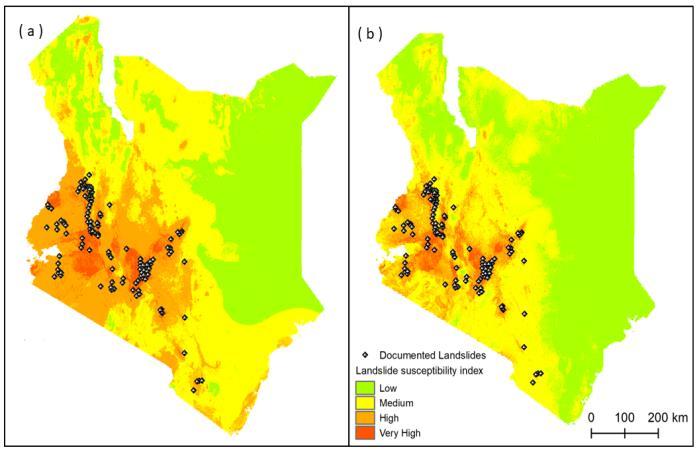
Fig -8:Landslideindexcreatedbytheweightedoverlay (a).Landslidesusceptibilityindexcreatedbythefuzzy logic(b).
Table -5: Statisticalanalysisforthelandslideindexcreated bytheweightedoverlay(WO)andfuzzylogic(FZ)withthe accuracycorrelationforthetwomodels(valuesarein%).
Incontrast,thefuzzylogicmodelproducesadistinctoutput forlandslidesusceptibility,withpixelvaluesrangingfrom0 to0.85.Italsocategorizesthecountryintofourmainclasses (Figure8.b):low,medium,high,andveryhigh,representing approximately 68%, 19%, 10%, and 3% of Kenya's area, respectively(Table5).Thesepercentagesdifferfromthose calculated by the weighted overlay model due to the variationsinfactorstandardizationapproachesemployedin eachmodelingprocedure.Statisticalanalysisrevealsthatthe weightedoverlaymodelreportsnolandslideeventsinthe low index, only 4 events in the medium index, and 126 events in the high and very high indices (Table 5). Conversely,thefuzzy model hasnolandslidesreported in thelowindex,20inthemediumindex,and110inthehigh andveryhighindices(Table5).Whenconsideringthehigh andveryhighindicesofbothmodels,theweightedoverlay modelachievesanaccuracyof97%,comparedto85%for thefuzzylogicmodel(Table5).
Unfortunately,theareasmostpronetolandslidesarealso themostagriculturallyproductiveanddenselypopulatedin Kenya, owing to their high precipitation rates and fertile soils.Long-termlandusechangesmayhavecontributedto increasedlandslideoccurrencesintheseareas.Tomitigate landslide hazards in such regions, it is crucial to avoid construction on steep slopes and existing landslides. Cultivation, deforestation, and settlement should be minimized in steep slope areas. However, if building on gentle slopes becomes necessary, slope stabilization measuresshouldbeconsidered.Plantingdeep-rootedtrees on steep slopes can also help mitigate landslides. Additionally,geodeticmonitoringshouldbeimplementedin areaspronetoactivelandslides.Thereisapressingneedfor thedevelopmentofacomprehensivelandslidemanagement programinKenyatoassesslandslidehazardsandassociated riskseffectively.
Landslidesareaprevalentphenomenoninthemountainous regionsofKenya,emphasizingtheimportanceoflandslide hazard assessment, particularly in the central and
International Research Journal of Engineering and Technology (IRJET) e-ISSN: 2395-0056
Volume: 11 Issue: 03 | Mar 2024 www.irjet.net p-ISSN: 2395-0072
southwesternpartsofthecountry.Thisstudysuccessfully createdalandslideinventorymap,encompassing130past landslideevents,bycompilingrecordsfromvariousreliable sources. Subsequently, two models, the weighted overlay modelandthefuzzylogicmodel,wereemployedtocompute landslidesusceptibilityindices.
The accuracy of the models heavily relies on the limited numberofdocumentedlandslideeventsandtheidentified causativeandtriggeringfactors.Theweightedoverlaymodel exhibited a high accuracy,with approximately 97% of the past landslides occurring in the high and very high susceptibilityindices,comparedto85%forthefuzzylogic model. These variations can be attributed to the different approaches employed for factor categorization and standardizationineachmodel.
Theresultsfromtheweightedoverlaymodelindicatethat approximately 26% of Kenya's land area is susceptible to landslides. As the first comprehensive landslide study conductedfortheentirecountry,thisresearchsignificantly enhances our understanding of landslide hazards and provides valuable insights for decision-makers in future planningandmitigatingassociatedrisksinKenya.
Furthermore, this study underscores the effectiveness of geospatial technologies in landslide assessments and emphasizestheneedforongoinggeodeticmonitoringinthe central and southwestern regions of Kenya, which are particularly vulnerable to active landslides. By predicting potentialdisastrousevents,geodeticmonitoringcanplaya vitalroleinsafeguardinglivesandinfrastructure.Thisstudy contributes to the advancement of landslide research in Kenyaandhighlightstheimportanceofproactivemeasures toaddresslandslidehazards.Continuedeffortsinlandslide monitoring, research, and implementation of appropriate mitigation strategies are crucial for the sustainable developmentandsafetyofcommunitiesinlandslide-prone areasofKenya.
Thanks to InSAR Research Group at the University of Arkansasforthediscussionsandvaluablecomments.Thanks also to the World Resources Institute, NASA: National AeronauticsandSpaceAdministration,USGS:UnitedState Geological Survey, Esri: Environmental Systems Research Institute, USDA-NRCS: the United States Department of Agriculture–Natural Resources Conservation Service, RCMRD: Regional Centre for Mapping of Resources for Development,andDIVA-GIsforprovidingthenecessarydata forthisresearch.
[1] Mugagga,F.,Kakembo,V.,&Buyinza,M.2012.“Landuse changes on the slopes of Mount Elgon and the implicationsfortheoccurrenceoflandslides.”CATENA,
90, 39–46. https://doi.org/10.1016/j.catena.2011.11.004.
[2] MarshakS.2019.Essentialsofgeology(Sixthedition). NewYork:W.W.Norton&Company.
[3] VarnesDJ.1978.Slopemovementtypesandprocesses. InLandslides Analysisandcontrol:NationalResearch Council, Washington, D.C., Transportation Research Board; p. 234. The University of California: National AcademyofSciences.
[4] DaviesTC,NyambokIO.1993.“TheMurang’alandslide, Kenya.” Environmental Geology 21(1–2):19–21. https://doi.org/10.1007/BF00775046.
[5] LarssonM.1989.“Landslidesinthemountainareasof Kenya: comparative studies of different slopes within theNyandaruaRange.”In:SoilandWaterConservation inKenya(EditedbyThomasDB,BiamahEK,KileweAM, Lundgren L, Mochoge BO) pp123-136. Proceedings ThirdNationalWorkshop,Kabete,Nairobi.
[6] Rob BK. 2011. “Landslide disaster vulnerability in Western Kenya and mitigation options: A synopsis of evidence and issues of Kuvasali landslide.” Journal of EnvironmentalScienceandEngineering5(1):110–115.
[7] Maina-Gichaba C, Kipseba EK, Masibo M. 2013. “Overview of landslide occurrences in Kenya.” In DevelopmentsinEarthSurfaceProcesses.16:293–314. https://doi.org/10.1016/B978-0-444-59559-1.00020-7.
[8] MulwaJK,KimataF,DuongNA.2013.“Seismichazard.” In Developments in Earth Surface Processes. 16:267–292. https://doi.org/10.1016/B978-0-444-595591.00019-0.
[9] DaviesTC.1996.“LandslideresearchinKenya.”Journal of African Earth Sciences 23(4):541–545. https://doi.org/10.1016/S0899-5362(97)00017-1.
[10] Rowntree KM. 1989. Landslides in Kenya: A geographical appraisal. In: Brabb EE and Harrod BL (Eds),Landslides:Extentandeconomicsignificance;p. 253–259.Rotterdam:A.A.Balkema.
[11] Ngecu WM, Mathu EM. 1999. “The El Niño-triggered landslidesandtheirsocioeconomicimpactonKenya.” Environmental Geology 38(4):277–284. https://doi.org/10.1007/s002540050425.
[12] Climates to Travel. 2019. Climate - Kenya. [accessed 2019 Feb 22]. https://www.climatestotravel.com/climate/kenya.
[13] TheWorldBank.2019.Data,Kenya.[accessed2019Feb 27].https://data.worldbank.org/country/kenya.
[14] Ngecu WM, Ichang’i DW. 1999. “The environmental impact of landslides on the population living on the easternfootslopesoftheAberdarerangesinKenya:A casestudyofMaringaVillagelandslide.”Environmental
| Page133
International Research Journal of Engineering and Technology (IRJET) e-ISSN: 2395-0056
Volume: 11 Issue: 03 | Mar 2024 www.irjet.net p-ISSN: 2395-0072
Geology 38(3):259–264. https://doi.org/10.1007/s002540050423.
[15] Kamau NI. 1981. A study of mass movements in Kangemaarea,Murang’aDistrict,Kenya[Projectreport, postgraduatediplomainsoilconservation].University ofNairobi.
[16] Larsson M. 1986. Landslides in the mountain dress of Kenya: causes, effects and rehabilitation. Unpubl. research proposal, 93p. Department of Physical Geography,StockholmUniversity.
[17] Westerberg LO. 1989. “Rainfall characteristics, soil properties, land-use and landslide erosion in the Kanyenyaini area, Nyandarua Range, Kenya.” M. Sc. thesis., Department of Physical Geography, Stockholm University.
[18] JohanssonA.1993.Astudy ofearthflowfeatures and therelationtosoilandrainfallcharacteristicsinOI’Joro OrokDivision,NyandaruaDistrict,Kenya.Unpubl.B.Sc. degree project report. Department of Physical Geography.StockholmUniversity.
[19] Christiansson C, Zobisch M, Lunden B, Davies TC, WesterbergLO,MburuD,GranitJ.1993.Landslidesand related processes in Murang’a District, Central Kenya highlands. A proposal, EDSU, University of Stockholm/DAE,UniversityofNairobi;10p.
[20] NgecuWM,NyamaiCM,ErimaG.2004.“Theextentand significanceofmass-movementsinEasternAfrica:Case studiesofsomemajorlandslidesinUgandaandKenya.” Environmental Geology 46(8):1123–1133. https://doi.org/10.1007/s00254-004-1116-y.
[21] Mwaniki MW, Ngigi T, Waithaka E. 2011. Rainfall induced landslide probability mapping for Central Province.https://doi.org/10.13140/rg.2.1.4509.9046.
[22] MwanikiMW,MöllerM,SchellmannG.2015a.Landslide inventory using knowledge based multi-sources classification time series mapping: A case study of central region of Kenya. GI_Forum.1:209–219. https://doi.org/10.1553/giscience2015s209.
[23] MwanikiMW,AgutuNO,MbakaJG,NgigiTG,Waithaka EH. 2015b. “Landslide scar/soil erodibility mapping using Landsat TM/ETM+ bands 7 and 3 Normalised Difference Index: A case study of central region of Kenya.” Applied Geography 64:108–120. https://doi.org/10.1016/j.apgeog.2015.09.009.
[24] Nyaberi GN. 2016. Analysing landslide petentiality of formerWesternProvinceKenyausingGIS.Unpublished paper.
[26] Baeza C, Corominas J. 2001. “Assessment of shallow landslide susceptibility by means of multivariate statistical techniques.” Earth Surface Processes and Landforms 26(12):1251–1263. https://doi.org/10.1002/esp.263.
[27] Ndeng'e G, Opiyo C, Mistiaen J, Krstjanson P. 2003. “Geographicdimensionsofwell-beinginKenya,where arethepoor?Fromdistrictstolocations(volumeone). Kenya.MinistryofPlanningandNationalDevelopment. Nairobi,Kenya:CentralBureauofStatistics.”Retrieved from http://datasets.wri.org/dataset/districtadministrative-boundaries-of-kenya.
[28] KirschbaumDB,AdlerR,HongY,HillS,Lerner-LamA. 2010.“Agloballandslidecatalogforhazardapplications: Method, results, and limitations.” Natural Hazards 52(3):561–575.https://doi.org/10.1007/s11069-0099401-4.
[29] Froude MJ, Petley DN. 2018. “Global fatal landslide occurrence from 2004 to 2016.” Natural Hazards and Earth System Sciences 18(8):2161–2181. https://doi.org/10.5194/nhess-18-2161-2018
[30] MinesandGeologyDepartment.2012.Mapoflandslide inKenya[Unpublished].
[31] USGS.EarthquakeHazardsProgram.[accessed2019Jan 10].https://earthquake.usgs.gov/earthquakes/map/.
[32] FinkoEA.2014.GlobalfaultslayerfromArcAtlas(Esri). [accessed 2019 Jan 22]. https://www.arcgis.com/home/item.html?id=a549601 1fa494b99810e4deb5c618ae2.
[33] HijmansRJ,GuarinoL,CruzM,RojasE.2001.“Computer toolsforspatialanalysisofplantgeneticresourcesdata: 1.DIVA-GIS.”PlantGenetResourcesNewsletter127:15–19.
[34] USDA-NRCS. [accessed 2019 Jan 12]. https://www.nrcs.usda.gov/wps/portal/nrcs/site/natio nal/home/.
[35] Global Ecosystems. 2019. [accessed 2019 Jan 15]. https://rmgsc.cr.usgs.gov/ecosystems/datadownload.sh tml.
[36] DRSRS, KFS, SOK, RCMRD. 2016. “Land cover change mappingtosupportthesystemforland-basedemissions estimationinKenya(SLEEK).”RetrievedfromRegional Centre for Mapping of Resources for Development website:https://www.rcmrd.org/sleek.
[37] HijmansRJ,CameronS,ParraJ.2005.WorldClimclimate surfaces, version 1.4. [accessed 2019 Jan 10]. http://www.worldclim.org/.
[25] Mwaniki MW, Kuria DN, Boitt MK, Ngigi TG. 2017. “ImageenhancementsofLandsat8(OLI)andSARdata for preliminary landslide identification and mapping appliedtothecentralregionofKenya.”Geomorphology 282:162–175. https://doi.org/10.1016/j.geomorph.2017.01.015.
International Research Journal of Engineering and Technology (IRJET) e-ISSN: 2395-0056
Volume: 11 Issue: 03 | Mar 2024 www.irjet.net p-ISSN: 2395-0072
[38] EarthExplorer. 2019. [accessed 2019 Jan 20]. https://earthexplorer.usgs.gov/
[39] GuzzettiF,PeruccacciS,RossiM,StarkCP.2008.“The rainfallintensity–durationcontrolofshallowlandslides and debris flows: An update.” Landslides 5(1):3–17. https://doi.org/10.1007/s10346-007-0112-1.
[40] ReichenbachP,CardinaliM,DeVitaP,GuzzettiF.1998. “Regional hydrological thresholds for landslides and floods in the Tiber River Basin (central Italy).” Environmental Geology 35(2–3):146–159. https://doi.org/10.1007/s002540050301.
[41] Sidle RC, Ochiai H. 2006. Landslides: Processes, prediction, and land use. https://doi.org/10.1029/WM018.
[42] VennariC,GarianoSL,AntronicoL,BrunettiMT,Iovine G,PeruccacciS,GuzzettiF.2014.“Rainfallthresholdsfor shallow landslide occurrence in Calabria, southern Italy.” Natural Hazards and Earth System Sciences 14(2):317–330.https://doi.org/10.5194/nhess-14-3172014.
[43] AkgunA.2012.“Acomparisonoflandslidesusceptibility maps produced by logistic regression, multi-criteria decision,andlikelihoodratiomethods:Acasestudyat İzmir, Turkey.” Landslides 9(1):93–106. https://doi.org/10.1007/s10346-011-0283-7.
[44] AyalewL,YamagishiH.2005.“TheapplicationofGISbased logistic regression for landslide susceptibility mapping in the Kakuda-Yahiko Mountains, Central Japan.” Geomorphology 65(1–2):15–31. https://doi.org/10.1016/j.geomorph.2004.06.010.
[45] GuzzettiF,CarraraA,CardinaliM,ReichenbachP.1999. “Landslide hazard evaluation: A review of current techniquesandtheirapplicationinamulti-scalestudy, Central Italy.” Geomorphology 31(1–4):181–216. https://doi.org/10.1016/S0169-555X(99)00078-1.
[46] Saaty TL. 1977. “A scaling method for priorities in hierarchical structures.” Journal of Mathematical Psychology 15(3):234–281. https://doi.org/10.1016/0022-2496(77)90033-5.
[47] Saaty TL. 1980. The analytic hierarchy process: Planning,prioritysetting,resourceallocation.NewYork; London:McGraw-HillInternationalBookCo.
[48] Saaty TL, Vargas LG. 1991. Prediction, projection, and forecasting: Applications of the analytic hierarchy process in economics, finance, politics, games, and sports.Boston:KluwerAcademicPublishers.
[49] Aly MH, Giardino JR, Klein AG. 2005. Suitability assessmentforNewMiniaCityEgypt:AGISapproachto engineering geology. Environmental and Engineering
Geoscience. 11(3):259-269. https://dio:10.2113/11.3.259.
[50] Eastman JR, Jin W, Kyem P, Toledano J. 1995. “Raster procedureformulti-criteria/multi-objectivedecisions.” Photogrammetric Engineering and Remote Sensing 61(5):539–547.
[51] Kanungo DP, Arora MK, Sarkar S, Gupta RP. 2009. “Landslide susceptibility zonation (LSZ) Mapping.” JournalofSouthAsiaDisasterStudies2(1):81–105.
[52] ZadehLA.1965.“Fuzzysets.”InformationandControl 8(3):338–353. https://doi.org/10.1016/S0019-9958 (65)90241-X.
[53] Bonham-Carter G. 1994. Geographic information systemsforgeoscientists:ModellingwithGIS(1sted). Oxford;NewYork:Pergamon.
[54] Frattini P, Crosta G, Carrara A. 2010. “Techniques for evaluating the performance of landslide susceptibility models.” Engineering Geology 111(1–4):62–72. https://doi.org/10.1016/j.enggeo.2009.12.004.