
International Research Journal of Engineering and Technology (IRJET) e-ISSN: 2395-0056
Volume: 11 Issue: 03 | Mar 2024 www.irjet.net p-ISSN: 2395-0072


International Research Journal of Engineering and Technology (IRJET) e-ISSN: 2395-0056
Volume: 11 Issue: 03 | Mar 2024 www.irjet.net p-ISSN: 2395-0072
Mohammad Faraz Idris Siddiqui1 , Bilal Ahmad2
1B. Tech Student, Department of Computer Engineering, Jamia Millia Islamia, New Delhi, India
2B. Tech Student, Department of Civil Engineering, Jamia Millia Islamia, New Delhi, India
Abstract - Traffic congestion is a pervasive challenge in megacities worldwide, significantly impacting travel times, economic productivity, and environmental quality. This study explores the impact of increasing the percentage of two-wheelers (2W) and cars on traffic performance at the Munirka Intersection and RK Puram in New Delhi, India. Using VISSIM simulation software, scenarios were simulated with incremental increases in the proportion of 2W and cars. Results show varying effects on traffic performance, with RK Puram experiencing more significant changes compared to the Munirka Intersection. Recommendations include implementing effective traffic management strategies, improving infrastructure, promoting public transportation, and utilizing data-driven decision-making to enhance traffic efficiency in urban intersections. This research provides valuable insights for optimizing traffic flow and developing targeted traffic management approaches in metropolitan regions.
Key Words: Traffic Congestion, VISSIM, Traffic Performance, Traffic Management, Urban intersections, Munirka Intersection, RK Puram
Traffic congestion is a critical problem faced by urban areas worldwide, leading to economic losses, environmental issues, and a decrease in the quality of life[1]. To effectively address this issue and plan for efficient infrastructure, it is essential to understand the factorsthatinfluencetrafficperformance[2],includingthe compositionofvehicles ontheroad [3].Different types of vehicles, such as private cars, public transport vehicles, motorcycles, and commercial trucks, interact in unique ways that affect overall traffic dynamics [3]. By analyzing various parameters like density, speed, and volume using the VISSIM simulation software [4], [5], we aim to gain valuable insights into optimizing traffic flow and mitigating congestion [6] in Munirka Intersection, New Delhi.
To conduct this analysis, we will gather comprehensive data on traffic composition in the Munirka Intersection, including different vehicle types such as two-wheelers, four-wheelers, heavy commercial vehicles, and others. Additionally, we will consider factors like traffic volume
and signal timings to develop a holistic understanding of traffic performance [7], [8]. Using VISSIM, a sophisticated traffic simulation tool, we will create virtual models that accurately replicate real-world road conditions. By observingandanalyzingthebehaviourandinteractionsof different traffic compositions under various scenarios, we can measure key performance indicators such as travel time, average speed, and queue length to assess the correlation between traffic composition and traffic performance.
By utilizing data analysis methods, our goal is to pinpoint particular traffic composition situations that have a substantial influence on traffic efficiency. This examination will offer important perspectives for shaping traffic control approaches and aiding the advancement of effective transportation systems in the Munirka Intersection and comparable urban settings. Ultimately, comprehending the link between traffic makeup and traffic efficiency is essential for addressing congestion, enhancingtransportation,andimprovingthewell-beingof residents at Munirka Intersection. The objectives of this studyareto:
Examinetheinfluenceoftrafficmakeupontraffic effectiveness in metropolitan regions, specifically focusing on the Munirka Intersection in New Delhi.
Investigate the relationship between traffic makeupandimportantperformancemetricssuch asdensity,speed,andvolume.
UsethePTVVISSIMsimulationsoftwaretocollect detailed information on different vehicle categories, such as private automobiles, public transitvehicles,bikes,andfreighttrucks[9],[10]
Consider variables like traffic volume and the configuration of signal timings in the evaluation [11].
Simulate actual road conditions in VISSIM to evaluatetheimpactofraisingtheproportionof2wheelersandcarsby5%,10%,and15%ontraffic performance.
Examine factors such as density, speed, volume, and other measurable indicators in VISSIM to recognize traffic patterns that have a substantial impactontrafficefficiency[4].

Research
Volume: 11 Issue: 03 | Mar 2024 www.irjet.net
Munirka Intersection (Fig.2.1), nestled in the vibrant locality of Munirka, stands as a crucial junction in Southwest Delhi, where historical essence intertwines seamlessly with modernity. Known for its rich cultural heritage, Munirka offers a unique blend of connectivity, community, and convenience. Situated between the coordinates28°33'28.29''Nand77°10'23.13''E,withan altitude of 237 meters, Munirka experiences moderate to hightrafficdynamics,reflectingitsimportanceintheurban landscape.
Strategically positioned at the confluence of South Delhi andaffluentareaslikeVasantVihar,R.K.Puram,andHauz Khas, Munirka enjoys superb connectivity to prominent commercial hubs, educational institutions, healthcare facilities, and recreational amenities. The area boasts an extensivenetworkofroads,includingtheOuterRingRoad, Nelson Mandela Marg, and the Munirka-Dhaula Kuan Flyover, facilitating smooth transit for residents and commuters alike. Adding to its accessibility, the Munirka MetroStationlinkstheareatootherpartsofDelhiandthe National Capital Region, enhancing its allure as a residentialandcommercialhub[12]
Munirka thrives as a diverse community, with professionals, students, and families. Renowned educational institutions like JNU and IIT Delhi enrich the vibrant student culture. Residents enjoy various recreational activities with parks and cultural centres nearby. The area boasts excellent social infrastructure, including hospitals and shopping complexes. Despite premier shopping destinations nearby, traffic at the Munirkaintersectionremainscomplex.
In Munirka, the weather ranges from scorching summers, with temperatures hitting 45°C, to chilly winters at 3-4°C. Monsoon rains often flood the streets, creating challenges for commuters. Recent downpours submerged roads, particularly affecting low-lying areas and poorly drained regions. The Outer Ring Road near Munirka is severely affected, with vehicles struggling to navigate through the floodedstreets,causingsignificantinconvenience.
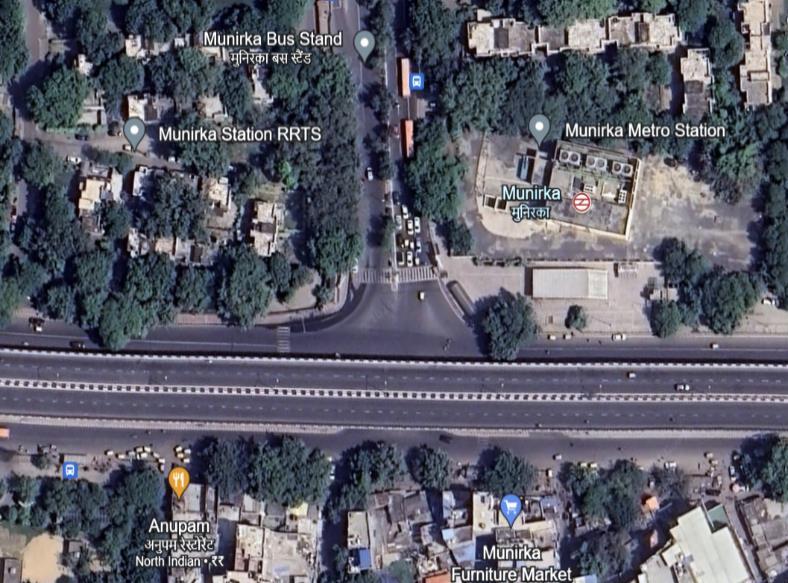
Traffic volume data collection at the Munirka intersection in New Delhi was conducted using videobased surveys, the approach would involve the following steps:
3.1
• Identify suitable vantage points: Select locations at the Munirka intersection that provide a clear view of the trafficmovements.
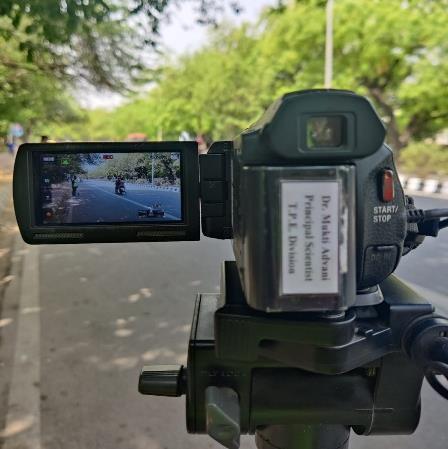
• Camera placement: Install video cameras at the chosen vantagepointstocapturethetrafficflow.
3.2 Video Data Collection:
Video recording: Record video footage of the traffic at the Munirka intersection (Fig. 3.1) for a specific duration. This period should be representative of the traffic patterns and variationsthroughoutthetimeofthesurvey.

International Research Journal of Engineering and Technology (IRJET) e-ISSN: 2395-0056
Annotation and counting: Analyze the recorded videos and manually count the vehicles of each classseparatelyforeach5-minuteTimeinterval.
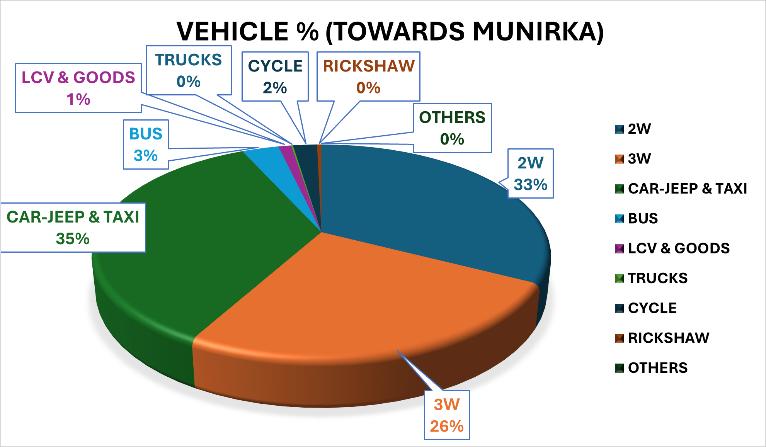
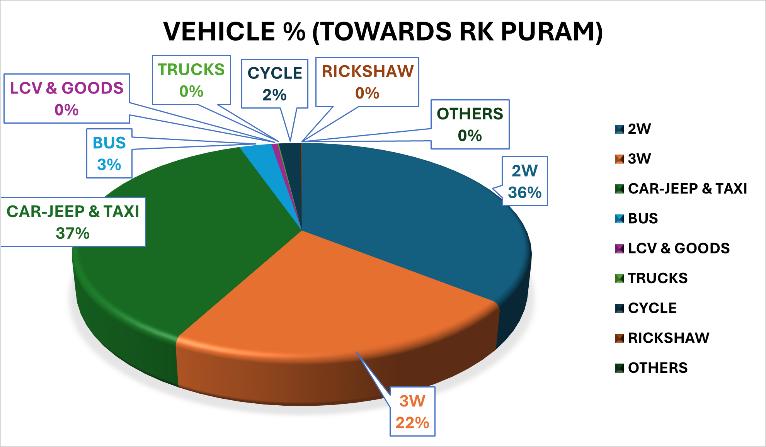
Traffic volume calculation (Fig. 3.2 & Fig. 3.3): Summaries the vehicle counts from each fiveminutetimeintervaltodeterminethetotaltraffic volumeatthetrafficstreaminbothdirections[7], [8],[11].
3.3 Calculate Average Speed:
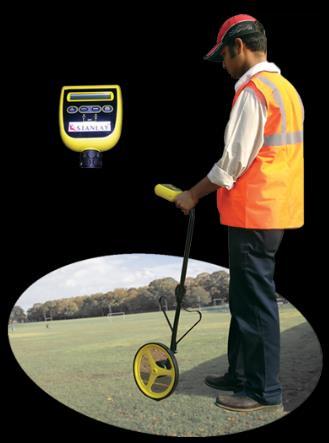
Set up the 30-meter road section by using the roadometer (Fig. 3.4) and traffic cones (Fig. 3.5) placedatitsboundariestomarkthestartandend points.
Ensure that the selected road section is visible in the video camera and there are no obstacles or hazards.
By using the HCM software to find the average speed for each class of vehicle in the given traffic stream[13]
Take 5 samples of each vehicle class for every 5minuteinterval.
Find out the speed of each sample and take the average of all samples to get the final value of
average speed. This should be done for each vehicleclassseparately[14]
4. METHODOLOGY
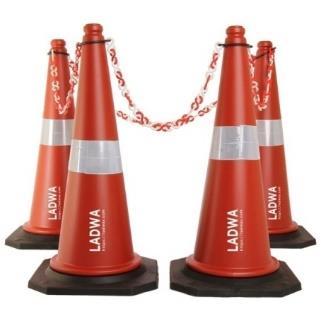
Fig. 4.0 explains the flow chart of the methodology followedtoachievetheobjectives.
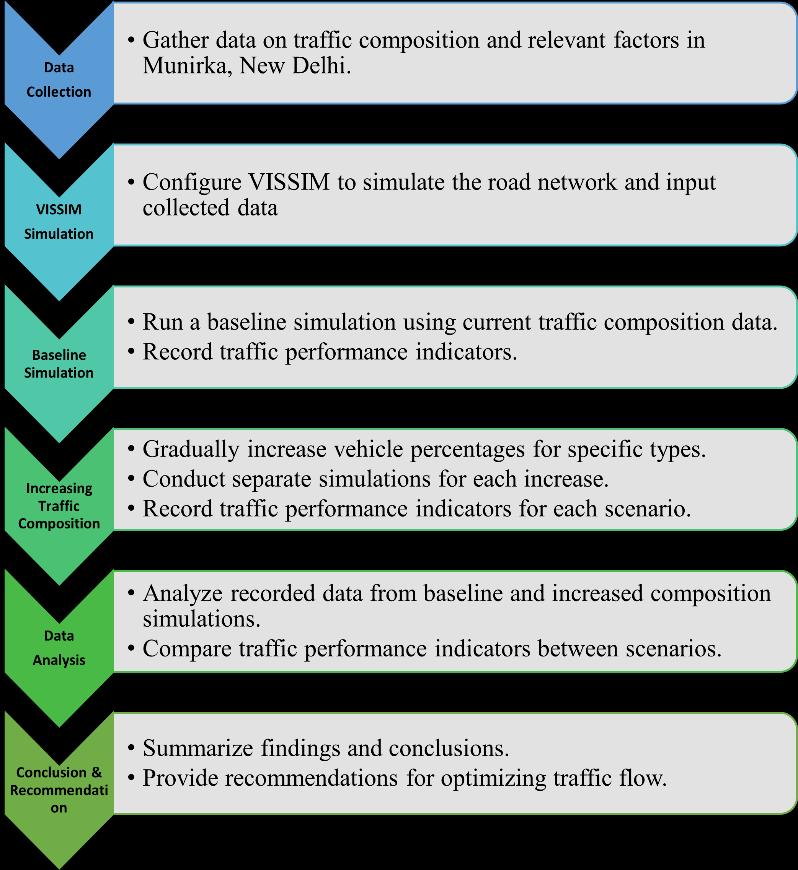
Fig. 4.0: The flow chart of the methodology
4.1 VISSIM Simulation Setup:
4.1.1 Network Design:
TheroadnetworkoftheMunirkaintersectionwas accurately modelled in PTV Vissim. This involved creating lanes and connecting road segments accordingtotheactuallayoutoftheintersectionin NewDelhi[4],[9],[10]
Volume: 11 Issue: 03 | Mar 2024 www.irjet.net p-ISSN: 2395-0072 © 2024, IRJET | Impact Factor value: 8.226 | ISO 9001:2008 Certified Journal | Page1267

International Research Journal of Engineering and Technology (IRJET) e-ISSN: 2395-0056
Volume: 11 Issue: 03 | Mar 2024 www.irjet.net p-ISSN: 2395-0072
Enterthenumberoflanes,lanewidthandnameof theroad.
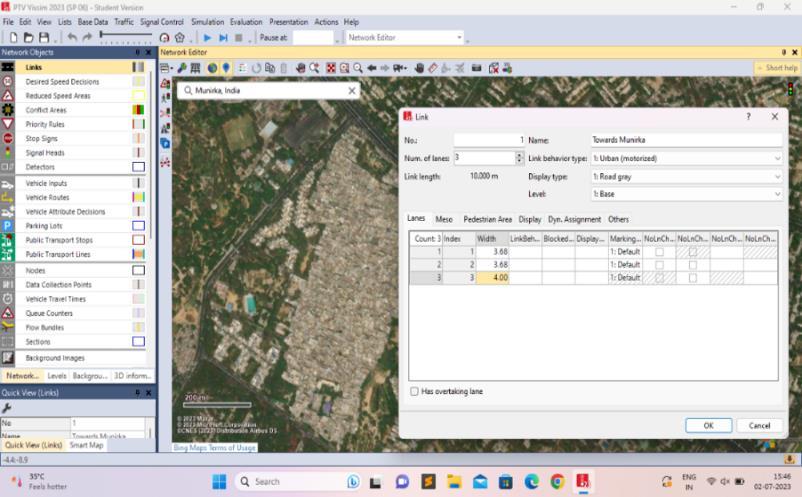
Fig. 4.1
Add Vehicle: Add the vehicle by selecting “Vehicle Input” from the “Network Objects” menu. Enter theinputvolumeinVeh/hrforeachLink.
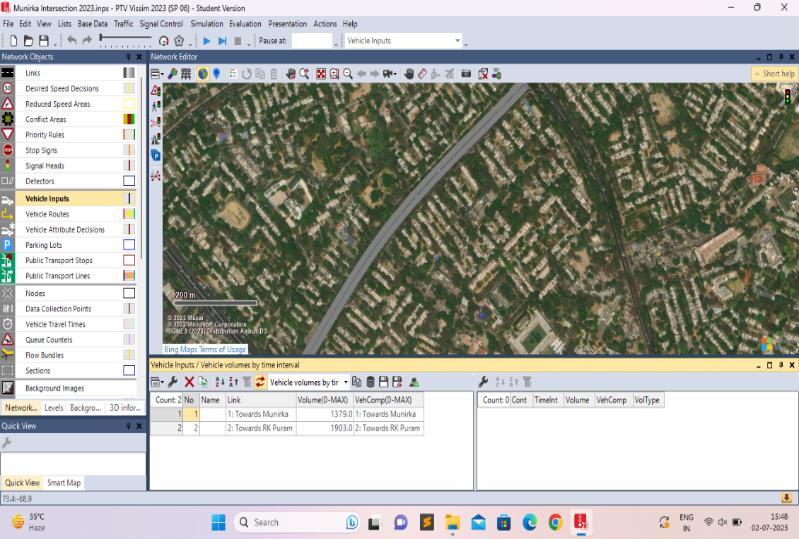
Fig. 4.2
Afterthatclickonthevehiclerouteanddefinethe vehiclepath.
4.1.2 Define Vehicle Composition:
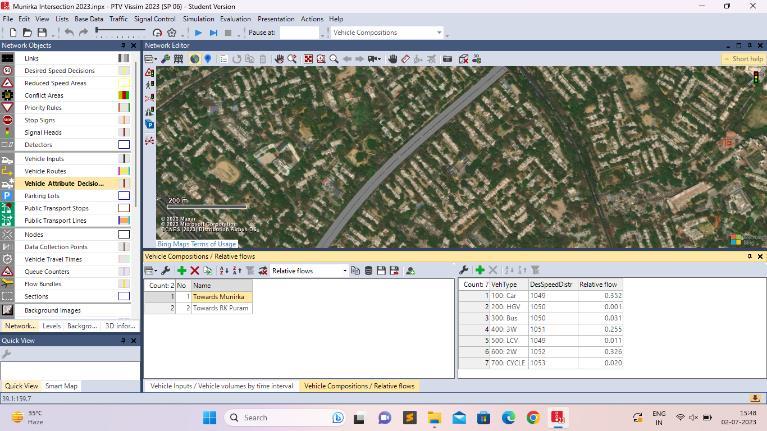
Add different vehicle types to represent the various categoriesofvehiclesinyoursimulation.Vehicletypescan bedefinedbasedonparameterssuchassizeandspeed.
4.1.3 Vehicle Composition Distribution:
After defining the vehicle types, we need to specify the distribution of these vehicle types within the traffic flow. Such as the proportion of each vehicle type in the traffic stream.
4.3
4.1.4 Place Data Collection Point:
Position the data collection object at the desired location within the road network where you want to collect data. Thiscanbedonebyclickingontheappropriatelocationin thePTVVissimworkspace.
4.1.5 Specify Data Collection Parameters:
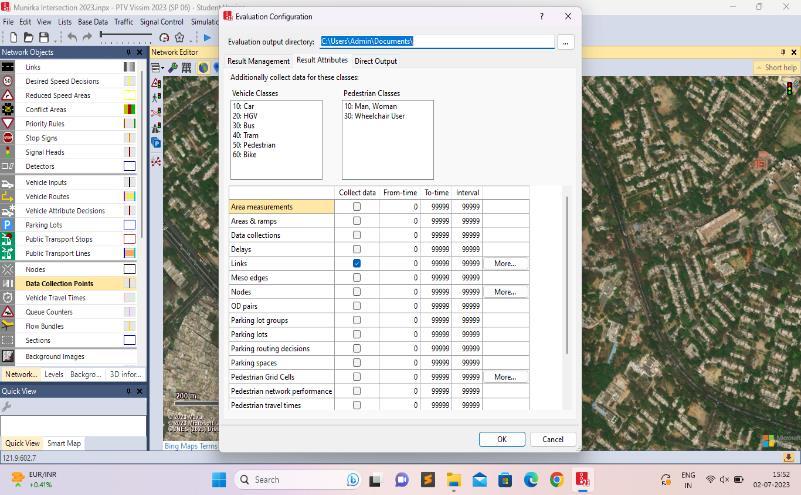
Once the data collection object is placed, you can specify the parameters for data collection. This includes selecting thetypeofdatayouwanttocollect,suchasvehiclecounts, traveltimes,speeds,delay,orotherrelevantmetrics.
4.4
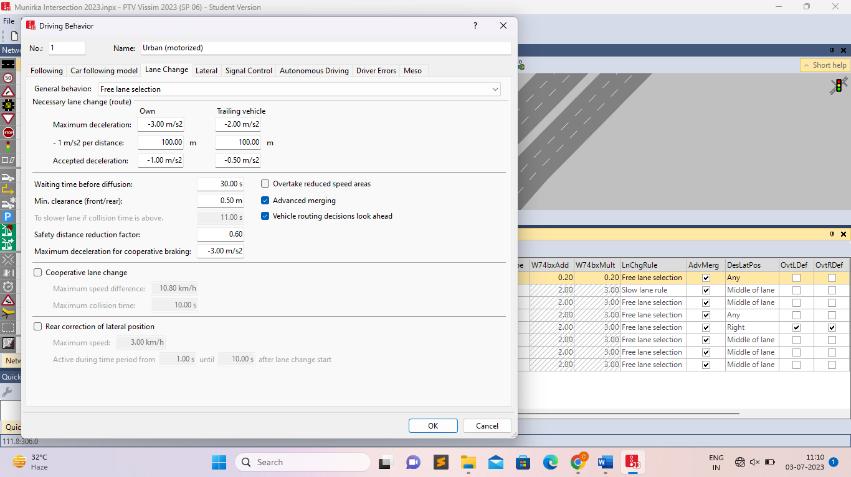
4.1.6 Add Driving Behavior Parameter sets as Per India:
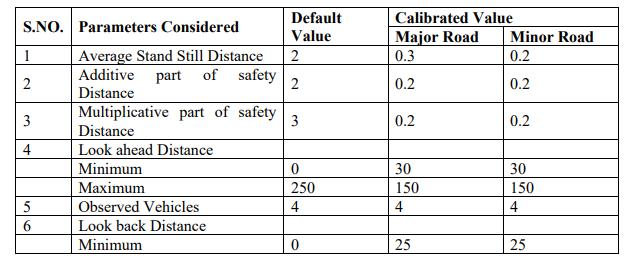
To effectively design traffic flow models and advanced driverassistancesystems,understandingdriverbehaviour inaspecificregioniscrucial[15],[16].Thesetables(Table 1&2)presenttypicalvaluesforvariousdrivingbehaviour parameters in India, including factors like following distances, reaction times, and braking capabilities. The values are further categorized for both minor and major roads[17],[18]
2024, IRJET | Impact Factor value: 8.226 |

International Research Journal of Engineering and Technology (IRJET) e-ISSN: 2395-0056
Volume: 11 Issue: 03 | Mar 2024 www.irjet.net p-ISSN: 2395-0072
By utilizing PTV Vissim and following this methodology, theimpactofvehiclebreakdownsontrafficflow,including factorssuchasvolume,speed,anddelay,canbeaccurately analysed and evaluated. This information is crucial for understanding the consequences of breakdown incidents anddevelopingeffectivestrategiesfortrafficmanagement andcongestionmitigation.
4.2 SPEED DATA
CalculatedspeeddataispresentedinTables3&4below.
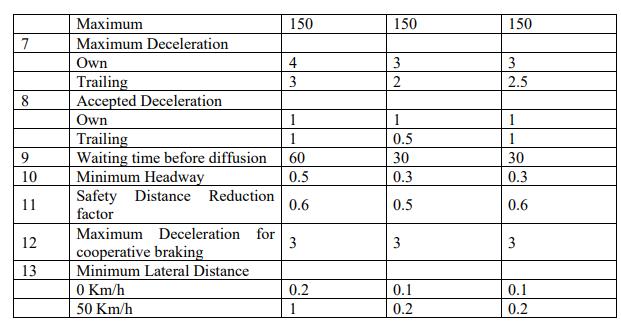
Table 1 Table 2
4.5
4.1.7 Parameters and Assumptions:
The simulation assumed that vehicles follow traffic rules and regulations, including lane discipline, speed limits, and traffic signal compliance.
Vehicleinteractionsandbehaviourweremodelled based on general traffic flow principles, considering acceleration, deceleration, lane changing,andgapacceptance.
The breakdown scenario assumed that the disabled vehicle occupies one lane, creating a bottleneckintrafficflow.
DIRECTION TOWARDS MUNIRKA
VEHICLE TYPE AVERAGE SPEED (KM/H) 2W 4986562199 3W 4047680028 CAR 56.54487127 BUS 353495979 CYCLE 1046826319
Table 3
DIRECTION TOWARDS RK PURAM
VEHICLE TYPE AVERAGE SPEED (KM/H)
Table 4
Runabaselinesimulationusingthecurrenttraffic compositiondatainVISSIM.Thiswillserveasthe referencescenarioforcomparison.
Monitor and record various traffic performance indicators during the simulation, including density, speed, volume, and queue length. These indicators will provide insights into the existing trafficperformanceinMunirka.
5.0 RESULTS AND RECOMMENDATIONS:
Traffic congestion is a pervasive challenge in megacities worldwide, significantly impacting travel times, economic

International Research Journal of Engineering and Technology (IRJET) e-ISSN: 2395-0056
Volume: 11 Issue: 03 | Mar 2024 www.irjet.net p-ISSN: 2395-0072
productivity, and environmental quality [1]. Beyond just volume,thecompositionoftrafficflow,specificallythemix ofvehiclesliketwo-wheelers(2W)andcars,caninfluence performanceatintersections[3].Thisstudyexploresthe impact of increasing the percentage of 2W and cars on traffic performance at two intersections in New Delhi, India. Utilizing a VISSIM traffic simulation model, we systematically increased the proportions of 2W and cars for specific vehicle types. The corresponding traffic performance indicators, including average speed, density, relative delay, and volume, were recorded for each simulation scenario. Our findings aim to contribute to a deeperunderstandingofhowtrafficcompositioninteracts with intersection performance, aiding in the development oftargetedtrafficmanagementstrategies.
Wegraduallyincreasedthepercentageof2Wand Car by 5%, 10%, and 15% for specific vehicle types (two-wheelers, four-wheelers, heavy commercial vehicles, etc.) in the VISSIM simulation.
For each increased percentage, we conducted a separate simulation and recorded the corresponding traffic performance indicators mentionedearlier.
Volume(towards Munirka)
5.1: 2W-Graph showing density comparison (towards Munirka)
Comparision(towards Munirka)
5.3: Car-Graph showing density comparison (towards Munirka)
Avg. Volume(towards Munirka)

Volume: 11 Issue: 03 | Mar 2024 www.irjet.net p-ISSN: 2395-0072
Density Comparision(towards RK Puram)
Density Comparision(towards RK Puram)
5.5: 2W-Graph showing density comparison (towards RK Puram)
5.7: Car-Graph showing density comparison (towards RK Puram)
Avg. Volume(towards RK Puram)
5.6: 2W-Graph showing volume comparison (towards RK Puram)
Table 8: Car- Average of parameters (towards RK Puram)
5.8: Car-Graph showing volume comparison (towards RK Puram)
TowardsMunirkaIntersection:
Increasing the percentage of 2W (two-wheelers) by 5%, 10%, and 15% resulted in a slight decrease of 0.5 Km/hr,0.42 Km/hr and 0.70 Km/hr in average speed respectively, with a minimal impact on average density and relative delay.
Increasingthepercentageofcarsby5%,10%,and 15% also showed a minor decrease in average speed,0.07Km/hr,0.1Km/hrand0.3Km/hrwith slightly higher average density and relative delay comparedtothenoincreasescenario.
Overall, the impact of increasing traffic composition on traffic performance towards the MunirkaIntersectionwasrelativelyminimal,with smallchangesobservedinaveragespeed,density, relativedelay,andvolume.
TowardsRKPuram:
Increasing the percentage of 2W (two-wheelers) by 5%, 10%, and 15% resulted in a decrease of 0.52 Km/hr,0.46 Km/hr and 0.73 Km/hr in averagespeedrespectively,anincreaseinaverage

International Research Journal of Engineering and Technology (IRJET) e-ISSN: 2395-0056
Volume: 11 Issue: 03 | Mar 2024 www.irjet.net p-ISSN: 2395-0072
density, and a significant increase in relative delay.
Increasingthepercentageofcarsby5%,10%,and 15% showed a similar pattern, with a decline of 0.09 Km/hr,0.13 Km/hr and 0.36 Km/hr in average speed, higher average density, and a notableincreaseinrelativedelay.
Herearesomerecommendationsderivedfromthisstudy:
The impact of increasing traffic composition on traffic performance towards RK Puram was more significant comparedto the Munirka Intersection, withnoticeablechangesinaveragespeed,density, relativedelay,andvolume.
Traffic Management: Implement effective traffic management strategies to mitigate congestion and reduce relative delay. This could include optimizing traffic signal timings, implementing traffic flow control measures, and considering capacityexpansionwherenecessary.
Infrastructure Improvement: Assess the road infrastructure in areas experiencing high density and relative delay. Identify potential bottlenecks and consider infrastructure enhancements such as widening roads, adding lanes, or improving intersectionstoimprovetrafficflow.
Public Transportation: Promote the use of public transportation as an alternative to individual vehicles to reduce the overall volume of vehicles ontheroadandalleviatecongestion.
Data-Driven Decision Making: Continuously monitorandanalyzetrafficdatatomakeinformed decisions regarding traffic management, infrastructure planning, and policymaking. Use data-drivenapproachestoidentify problemareas andprioritizeinterventions.
7. CONCLUSION:
1. Density:
Generally, as the percentage increase in density occurs,thedensityofvehiclesperkilometretends toincreaseacrossalltimeintervalsandsections.
The increase in density may indicate a higher concentration of vehicles, which can lead to increased traffic congestion and reduced traffic flow.
2. RelativeDelay:
With the increase in density, there is a corresponding increase in relative delay in most cases.
Higherdensityresultsinslowertrafficmovement and increased travel time, leading to higher relativedelay.
Therelativedelayisinfluencedbyfactorssuchas road capacity, traffic management, and infrastructure.
3. Speed:
As density increases, the average speed tends to decrease across various time intervals and sections.
Higher density leads to traffic congestion, which resultsinreducedspeedsandslowertrafficflow.
Lower speeds can impact the overall efficiency andeffectivenessoftransportationsystems.
4. Volume:
Thevolumeofvehiclesperhourshowsvariations depending on the specific time interval, section, andpercentageincrease.
Insomecases,thevolumeincreasesasthedensity increases, indicating a higher number of vehicles passingthroughaparticulararea.
Itisessentialtoconsidervolumealongwithother factorslikespeedanddensitytoassesstheoverall trafficconditionsaccurately.
[1] I. Research, T. Reed, and J. Kidd, “Global Traffic Scorecard,”2019.
[2] S. Narayanan, E. Chaniotakis, and C. Antoniou, “Factors affecting traffic flow efficiency implications of connected and autonomous vehicles: A review and policy recommendations,” Advances in Transport Policy and Planning, vol. 5, pp. 1–50, Jan. 2020, doi: 10.1016/BS.ATPP.2020.02.004.
[3] A. Boora, I. Ghosh, S. Chandra, and K. Rani, “Measurementoffree-flowconditionsonmultilane intercity highways under heterogeneous traffic conditions,” Journal of the South African Institution of Civil Engineering, vol. 60, no. 1, pp. 2–9, Mar. 2018,doi:10.17159/2309-8775/2018/v60n1a1.
[4] A.Ul,H.Bhat,andR.Gupta,“AREVIEWPAPERON STUDY OF TRAFFIC VOLUME AND ITS SAFETY MEASURES ON NATIONAL HIGHWAYS,” International Research Journal of Engineering and Technology, p. 1346, 2008, Accessed: Mar. 28, 2024.[Online].Available:www.irjet.net
[5] Z. YANG, G. LI, X. ZHANG, and P. WANG, “Research on Microscopic Traffic Simulation Model in VISSIM,” DEStech Transactions on Computer Science and Engineering, no. ammms, Jan. 2019, doi: 10.12783/DTCSE/AMMMS2018/27223.

International Research Journal of Engineering and Technology (IRJET) e-ISSN: 2395-0056
Volume: 11 Issue: 03 | Mar 2024 www.irjet.net p-ISSN: 2395-0072
[6] H.Al-Msari,S.Koting,A.N.Ahmed,andA.El-shafie, “Review of driving-behaviour simulation: VISSIM and artificial intelligence approach,” Heliyon, vol. 10, no. 4, p. e25936, Feb. 2024, doi: 10.1016/J.HELIYON.2024.E25936.
[7] A.Ul,H.Bhat,andR.Gupta,“AREVIEWPAPERON STUDY OF TRAFFIC VOLUME AND ITS SAFETY MEASURES ON NATIONAL HIGHWAYS,” International Research Journal of Engineering and Technology, p. 1346, 2008, Accessed: Mar. 28, 2024.[Online].Available:www.irjet.net
[8] “(PDF) TRAFFIC VOLUME STUDY AND SUITABLE SOLUTION FOR HIGHWAY INTERSECTION AT ‘TECHNICAL -JUNCTION, DHAKA’.” Accessed: Mar. 28, 2024. [Online]. Available: https://www.researchgate.net/publication/36835 6866_TRAFFIC_VOLUME_STUDY_AND_SUITABLE_ SOLUTION_FOR_HIGHWAY_INTERSECTION_AT_TE CHNICAL_-JUNCTION_DHAKA
[9] D. Lin, X. Yang, and C. Gao, “ScienceDirect 13th COTA International Conference of Transportation Professionals (CICTP 2013) VISSIM-based Simulation Analysis on Road Network of CBD in Beijing, China,” Procedia-Social and Behavioral Sciences, vol. 96, pp. 461–472, 2013, doi: 10.1016/j.sbspro.2013.08.054.
[10] E. W. Utomo, F. Ramadhan, and A. Imran, “VISSIM Simulation-Based Analysis for Improving Traffic Conditions in Bandung Indonesia,” International journal of simulation: systems, science & technology, Dec.2020,doi:10.5013/IJSSST.A.21.03.05.
[11] “(PDF) Traffic Volume Study.” Accessed: Mar. 28, 2024. [Online]. Available: https://www.researchgate.net/publication/27183 3441_Traffic_Volume_Study
[12] “Ministry of Urban Development Government of India REPORT OF THE HIGH POWERED COMMITTEE ON DECONGESTING TRAFFIC IN DELHI Ministry of Urban Development GovernmentofIndiaPhoto:IndiaGate,NewDelhi.”
[13] “Generalrelationshipbetweenspeedandflowrate (Source: HCM 2016) | Download Scientific Diagram.” Accessed: Mar. 28, 2024. [Online]. Available: https://www.researchgate.net/figure/1-Generalrelationship-between-speed-and-flow-rate-SourceHCM-2016_fig1_334684918
[14] “Simplified Highway Capacity Calculation Method for the Highway Performance Monitoring System,” 2017.
[15] “A Review Paper on Driving Behavior Modelling”, doi:10.21275/SR20414075403.
[16] “(PDF) Calibration and Validation of VISSIM Driving Behavior Parameters for Signalized and UN-Signalized Intersections in Bangalore City.” Accessed: Mar. 28, 2024. [Online]. Available: https://www.researchgate.net/publication/34599 5325_Calibration_and_Validation_of_VISSIM_Drivin g_Behavior_Parameters_for_Signalized_and_UNSignalized_Intersections_in_Bangalore_City
[17] H.Al-Msari,S.Koting,A.N.Ahmed,andA.El-shafie, “Review of driving-behaviour simulation: VISSIM and artificial intelligence approach,” Heliyon, vol. 10, no. 4, p. e25936, Feb. 2024, doi: 10.1016/J.HELIYON.2024.E25936.
[18] G. Anand, “DRIVING BEHAVIOR MODELLING ON NATIONAL HIGHWAYS,” vol. 13, no. 03, 2022, Accessed: Mar. 28, 2024. [Online]. Available: www.jespublication.com