
International Research Journal of Engineering and Technology (IRJET) e-ISSN: 2395-0056
Volume: 11 Issue: 03 | Mar 2024 www.irjet.net p-ISSN: 2395-0072
International Research Journal of Engineering and Technology (IRJET) e-ISSN: 2395-0056
Volume: 11 Issue: 03 | Mar 2024 www.irjet.net p-ISSN: 2395-0072
Aswin Saji1 , Shaheer Akhthar C P2, Shilpa B3
1Department of Marine Geology, Mangalore University, Karnataka, India
2 3 Department of Geography, Mangalore University, Karnataka, India
Abstract - The state of Kerala had witnessed massivefloods during the years 2018 and 2019 which had affected the majority of its population. The scale of the damage wassovast that everyone suddenly started giving spatial planning the importance it always required. Geographical Information System (GIS) and other spatial tools can be used to generate flood maps which can help us in analyzing the trend thus reducing the damages to an extent. The findings can be utilized for strategizing the flood planning of a city.
Key Words: GIS,flood,urbanfloodspatialplanning,flood hazard
Floodingisconsideredoneofthemostcatastrophicdisasters becauseofitsmagnitudeofdevastatingimpactsonoverall humanwell-being[1].Mostofthefloodsoccurthroughout themonsoonandaresometimesrelatedtotropicalstorms, depressions and active monsoon conditions. Because of theseconditions,floodsoccurinthemajorityofwaterbasins inIndia[2].
Chen(1998)[3]definedGISasthesoftwaresystemfor gathering,preparingandinvestigatingspatialtopographical data. It is a basic instrument for big business associations, private structures and government divisions to adopt proactivestrategiesandsettleonsignificantchoicesbroadly and universally. GIS has been providing for over 40 years. These product innovations are firmly identified with the advancement of geological science [4]. According to Lawal (2011),[5]GIShasgrowntobeinterestingandoutstanding software that controls flood threats along with risk zone estimationsofgeographicalareas.Thisisthereasonitisone ofthemostpowerfultoolstocreateafloodriskmap
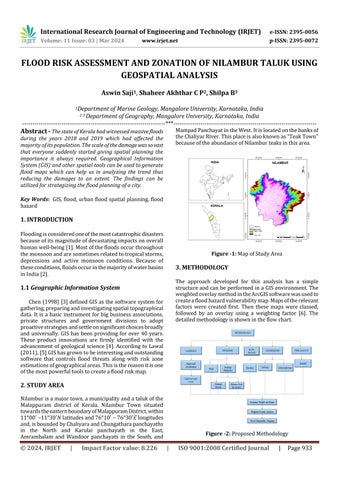
Nilamburisamajortown,amunicipalityandatalukofthe Malappuram district of Kerala. Nilambur Town situated towardstheeasternboundaryofMalappuramDistrict,within 11°00′−11°30′��latitudesand76°10′−76°30′��longitudes and,isboundedbyChaliyaraandChungatharapanchayaths in the North and Karulai panchayath in the East, Amrambalam and Wandoor panchayats in the South, and
MampadPanchayatintheWest.Itislocatedonthebanksof theChaliyarRiver.Thisplaceisalsoknownas“TeakTown” becauseoftheabundanceofNilamburteaksinthisarea.
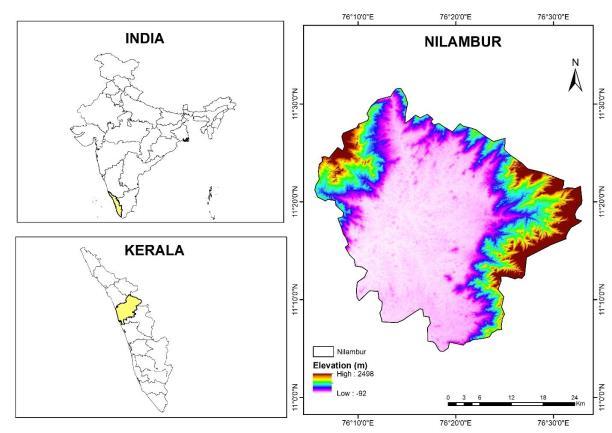
The approach developed for this analysis has a simple structureandcanbeperformedinaGISenvironment.The weightedoverlaymethodintheArcGISsoftwarewasusedto createafloodhazardvulnerabilitymap.Mapsoftherelevant factors were created first. Then these maps were classed, followed by an overlay using a weighting factor [6]. The detailedmethodologyisshownintheflowchart.
International Research Journal of Engineering and Technology (IRJET) e-ISSN: 2395-0056
Volume: 11 Issue: 03 | Mar 2024 www.irjet.net p-ISSN: 2395-0072
Table -1: ContributingFactorsanditsWeightage
CONTRIBUTING FACTORS
Weightedoverlayanalysisisusedtoidentifytheplaces which are vulnerable to hazards. In this case, weighted overlayanalysisisappliedtoidentifyandmapthefloodrisk zonesinNilamburtaluk,basedoneightfloodconstructive variables. All parameters were generated in vector format andeachparameterconsistsofadifferentrangeofvaluesand classeswhichareassignedwiththeranks.
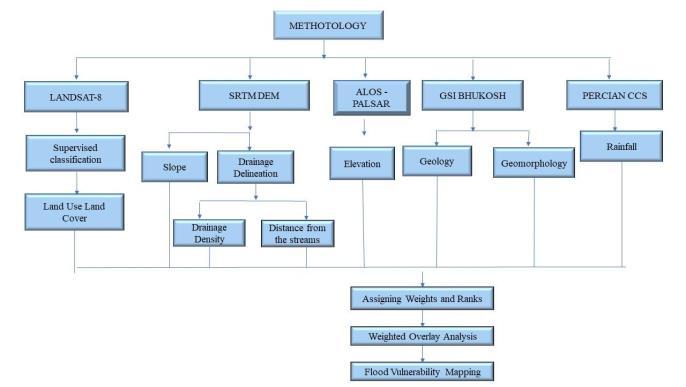
4.1 Slope Map
Floodhazardsusceptibilityisgreatlyinfluencedbytheslope ofthearea.Areasinhigherelevationswithsteeperslopesare less vulnerable to floodingwhileareas inlower elevations withflatterrainaremorevulnerable.UsingDEMandslope generation tools of ArcGIS software slope map was developed.Nilamburtalukhasalmostaflatterrainandthe sloperangesapproximatelybetween180 and820 .
4.2 Elevation Map
Elevation of the area can influence its flood hazard susceptibility. The chance of flooding increases with a
decreaseinelevation.Thelayerhasbeenassignedwiththe weightsandrisk rates,infloodriskzonationpointofview lowelevatedareasaremorevulnerable,andhighelevated areasareatlowrisk.Themajorpartofthestudyarealiesin veryhighflood-riskzonesintermsofelevation
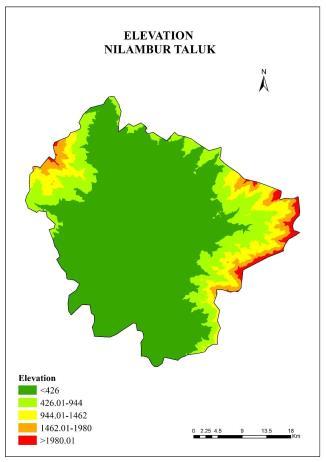
– 4: Elevation Map
4.3 Rainfall Map
Therainfallmapshowsthedistributionofrainfalloverthe studyarea.Heavyrainfallreacheslandwithinashortperiod and the incapacity of the natural watercourse to convey excesswaterduringheavyrainfallcausesfloods.Therainfall distribution map was prepared by the IDW interpolation methodusingArcGISandthespatialanalysttool.InNilambur taluktheactualrainfallwasmorethantheaveragerainfall during the years 2018 & 2019. Rainfall has a significant relationshipwiththeriverdischargeanditdirectlycontrols theoccurrenceoffloods[7].
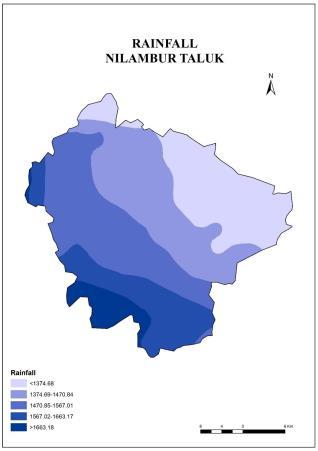
Figure – 5: RainfallMap
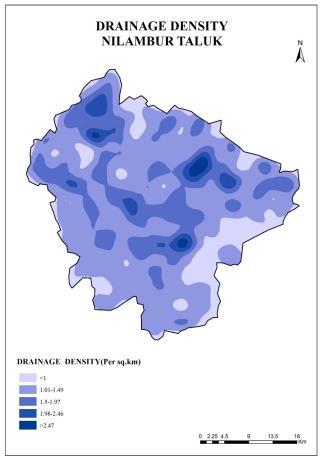
4.4 Drainage Density Map
The drainage density map represents the closeness of the spacingofstreamchannels.Itisameasureofthetotallength ofthestreamsegmentofallordersperunitarea[8].Since
International Research Journal of Engineering and Technology (IRJET) e-ISSN: 2395-0056
Volume: 11 Issue: 03 | Mar 2024 www.irjet.net p-ISSN: 2395-0072
flowvelocityishigherinriverdrainagedensitysignificantly affects theconcentrationtimeandthereforethepeak flow magnitude.Itfollowsthatincreasingdrainagedensityimplies increasingfloodpeaks.
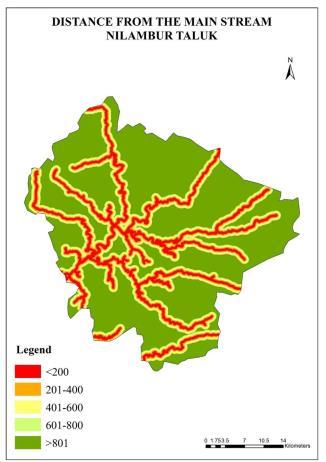
4.5 Euclidean Distance Map
The distance fromthe mainstreamisone of the important factorstobeconsideredduringfloodzonationmapping.The distance from the mainstream is classified into 5 classes <200, 201- 400, 401-600, 601-800, >801. The area which comeswithin<200ofmainstreamsisathigherriskandthe places which lie more than 800 meters away from the mainstreamareatverylowriskintermsofdistancefromthe mainstream
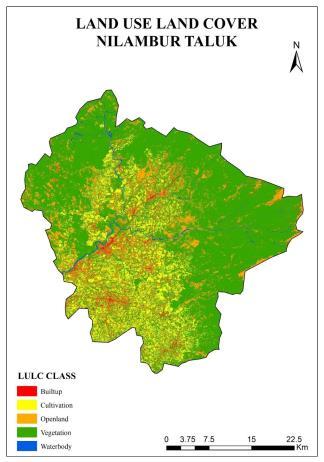
A landusemapshowsthe various types andintensitiesof differentland uses ina particulararea.Landuse influence infiltration rate. In this study area, the land use classes identified were vegetation, built-up area, water body, cultivationandopenland.Agriculturalareafavorsmedium infiltrationwhereasbuilt-upareasupportsoverflowofwater
which ultimately leads to flood. Nilambur taluk is mainly coveredbyvegetationandcultivationareas.
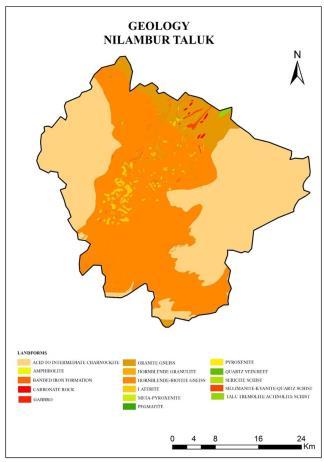
4.7 Geology Map
Geologyistakenasaninfluencingfactorforthisstudyasthe capacityofthegroundtoabsorbwaterisdirectlyrelatedto theunderlyinggeology.ThegeologyofNilamburtalukwas extracted from the Geographical Survey of India. Such geologicalterrainswillthusbesusceptibletorapidrun-off, enhancing the potential for serious flooding downstream duringhighrainfallevents
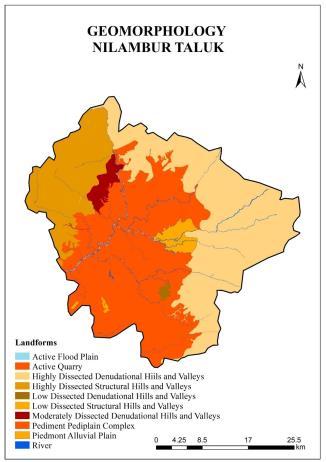
4.8 Geomorphology Map
Geomorphologyisthescientificstudyofnature,thehistoryof landformsonthesurfaceoftheearth,andtheprocessesof their creation. It focuses on the compositions, shape, and topographyofthematerialsandthegeologicprocessesthat giverisetoandmodifythem.Itcanhelpindeterminingthe physicalcharacteristicsofvariouslandformsbywhichareas pronetofloodscanbeidentified.
International Research Journal of Engineering and Technology (IRJET) e-ISSN: 2395-0056
Volume: 11 Issue: 03 | Mar 2024 www.irjet.net p-ISSN: 2395-0072
Thehazardsthatoccurredduetofloodinthestudyareaare estimated by contributing weightage to the map of each factors and overlaying them. Overlaying was done by the weighted overlaying tool in ArcGIS. The study area is categorisedintodifferentzonesdependingontheriskfactor asveryhighrisk,highrisk,moderaterisk,lowriskandvery lowriskzones.
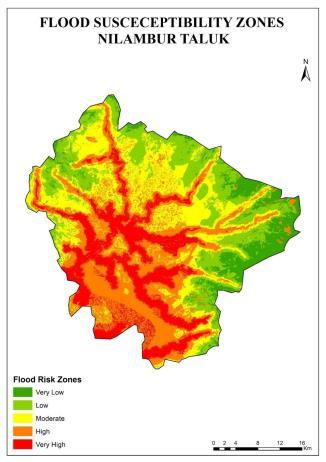
Table -2: AreaindifferentRiskZones
The study was an attempt to prepare a spatial plan to minimizetheriskanddamagecausedduetotheincidenceof floods in Nilambur municipality. The study formulated strategiesandproposalstominimizetheriskduetofloods [9].
As can be observed in the map the very high-risk zonesareneartomainriverchanneloftheChaliyarRiver, whichhasmostsettlements,andagriculturalland,withlow elevation and slope and moderate rainfall and drainage density. Vegetation plays a crucial role as the areas categorisedundervegetationarefoundtobewithinlowto verylow-riskzones.
Nilamburwasoneofthemostimpactedareasafter the flood in Kerala. The entire area is considered to be vulnerable to floods. The consecutive floods have destabilized many areas. The geological survey of India emphasizes land use planning and zoning regulations to reduceflooddisastersandstrengthendisasterpreparedness.
Geospatialtechniquesareveryusefulinidentifying theareasthatareriskatoffloodinghazards.Theriskzone maps are useful for the steps of authorities to reduce damagesduetofloodsandhelpinreducingthelossoflife and property. This study emphasizes the need for spatial planningandnon-structuralmeasureswhichhelptomake interventions at the planning level to ensure sustainable developmentwithconcerntotheenvironmentinthestudy areaandalsotoreduceitsfrequencies
The authors are thankful to the Department of Marine Geology and Department of Geography, Mangalore University AuthorsalsowishtoacknowledgeGSIBhukosh forprovidingthedatafreeofcost.
[1] Katiyar, V.; Tamkuan, N.; Nagai, M. Near-Real-Time Flood Mapping Using Off-the-Shelf Models with SAR Imagery and Deep Learning. Remote Sens. 2021, 13, 2334,https://doi.org/10.3390/rs13122334.
[2] Mishra J.P,Kumar D & Agarwal S(2011),Disaster managementinIndia,NewDelhi:GovernmentofIndia
[3] Chen Shupeng, Zhong Ershun, 1998. 2nd Annual GIS Infrastructure Planning and Management Conference, Beijing,China.pp.312-314
[4] Luo,J.,Zu,X.,Zhang,C.,&Wu,X.(2012).“TheOriginof BuildingGISSoftwareDevelopmentModel,”2,914–920. https://doi.org/10.1016/j.ieri.2012.06.191
International Research Journal of Engineering and Technology (IRJET) e-ISSN: 2395-0056
Volume: 11 Issue: 03 | Mar 2024 www.irjet.net p-ISSN: 2395-0072
[5] Dano Umar Lawal, 2011. Geographic Information System and Remote Sensing Applications in Flood Hazards Management: A Review. Research Journal of Applied Sciences, Engineering and Technology 3(9): 933-947
[6] Ajin, R. S., Krishnamurthy, R. R., Jayaprakash, M., & Vinod, P. G. (2013). Flood hazard assessment of VamanapuramRiverbasin,Kerala,India:anapproach using remote sensing & GIS techniques. Advances in AppliedScienceResearch,4(3),263-274.
[7] Yadav,A.,Hema,H.C.,Kappadi,P.,&Agasnalli,C.(2021, November). Geospatial Approach for the Assessment andAnalysisofFloodRisk intheregionofNanjangud town, Mysore District, Karnataka, India. In IOP Conference Series: Materials Science and Engineering (Vol.1197,No.1,p.012032).IOPPublishing.
[8] Singh, P., Gupta, A., Singh, M., 2014. Hydrological inferencesfromwatershedanalysisforwaterresource managementusingremotesensingandGIStechniques. Egyptian J. Remot. Sens. Space Sci. 17 (2), 111–121. https://doi.org/10.1016/j.ejrs.2014.09.003.
[9] Dou, X., Song, J., Wang, L., Tang, B., Xu, S., Kong, F., & Jiang, X. (2018). Flood risk assessment and mapping basedonamodifiedmulti-parameterfloodhazardindex modelintheGuanzhongUrbanArea,China.Stochastic environmental research and risk assessment, 32(4), 1131-1146.