
International Research Journal of Engineering and Technology (IRJET) e-ISSN: 2395-0056
Volume: 11 Issue: 02 | Feb 2024 www.irjet.net p-ISSN: 2395-0072
International Research Journal of Engineering and Technology (IRJET) e-ISSN: 2395-0056
Volume: 11 Issue: 02 | Feb 2024 www.irjet.net p-ISSN: 2395-0072
Huma Matloob
Assistant Professor, Architecture Section University Polytechnic, AMU, Aligarh
Abstract - Outdoor Thermal Comfort Indices (THI, WBGT and RSI) were determined for the Aligarh city. It is found that climatic conditions lead to the uncomfortable conditions in (May –September). Long-term trends of annual kurtosis and skewness values indicate negative and positive trends respectively and maximum change is exhibited by THI. Long-term trends of Outdoor Thermal Indices indicated that lower range of indices have increased in last century. Among the indices, the RSI indicated continuous increase throughout the century, while THI and WBGTindicatedsuddenchangeinvaluessince,1980s.
Key Words: Aligarh, Outdoor Thermal Indices, Climate Change
Dramatic changes in land use/land cover is witnessed by developing country particular Indian and China. These changes impact on thermal regime of land especially over the city areas. Changes in urban climate is linked to the industrial output and also impact on health of urban population. Based on climatic parameters numbers of studiesatvariousscalesandindiceshavebeendeveloped forthermalcomfortandheatstresswhichgivesnumerical relations or graphs for evaluating thermal comfort [1]. Based on cities, their climate type, indices used and comfort reporting was studied for selecting appropriate thermal comfortindex.Eachindexhastheirown strength in terms of comprehensiveness, usability, validity and completeness [2]. PET (Physiological Equivalent Temperature) was observed as a widely used outdoor thermal comfort index in tropics. Other indices such as Thom’s (DI) Discomfort Index [3] and Relative Strain Index(RSI)arecommonly usedin urbanclimate studies[ 4, 5]. Temperature Humidity Index(THI) is used to describe thermal sensations experienced by people as a result of modifications in the climatic conditions of the urbanareas[6,7]Itisamoresuitableindexforthetropics [8]. WBGT index (Wet Bulb Global Temperature) is recommended by the International Organization for Standardization (ISO) and widely used in numbers of studies. A comparative formulas table for the various indicesispresentintable1.
RSI allows the effect of clothing and net radiation to be considered along with the effects of temperature and humidity. The RSI for a healthy 25-year-old male, un acclimatized to heat and in a business clothing; with an internalheatproductionof100W/m2andintheabsence of direct solar radiation and a wind speed of 1 m/s [5]. Both indices, RSI and DI, use temperature and relative humidity (RH) meteorological parameters only to deduce the thermal comfort. Unlike PET and UTCI (Universal Thermal ClimateIndex),other factorssuchasvariation in solar radiation, wind velocity, and clothing condition are not taken into account in these indices. At city level, local comfort assessment requires a large number of monitoring stations which account these parameters. Many studies often focus over temperature and RH data andextrapolateotherparametersusingWeatherResearch and Forecasting model (WRF) [9] or obstacle-resolving numericalmodels[10].
Present study is designed to determine the various outdoor thermal indices. Characteristics of the indices were analyzed for the Aligarh city. Indices similarity, monthly distribution, long trends have been discussed in detail.
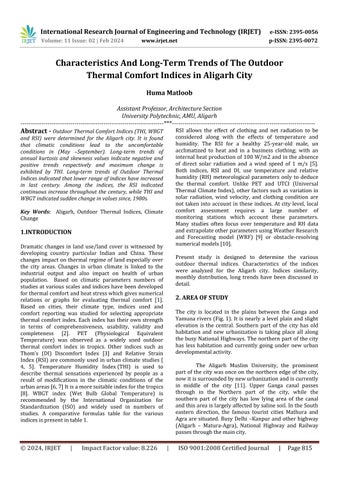
The city is located in the plains between the Ganga and Yamuna rivers (Fig. 1). It is nearly a level plain and slight elevation is the central. Southern part of the city has old habitation and new urbanization is taking place all along thebusyNational Highways.Thenorthernpartofthecity has less habitation and currently going under new urban developmentalactivity.
The Aligarh Muslim University, the prominent partof the citywasonce on the northern edge ofthecity, nowitissurroundedbynewurbanizationandiscurrently in middle of the city [11]. Upper Ganga canal passes through in the Northern part of the city, while the southern part of the city has low lying area of the canal andthisareaislargelyaffectedbysalinesoil.IntheSouth eastern direction, the famous tourist cities Mathura and Agra are situated. Busy Delhi –Kanpur and other highway (Aligarh – Matura-Agra), National Highway and Railway passesthroughthemaincity.
International Research Journal of Engineering and Technology (IRJET) e-ISSN: 2395-0056
Volume: 11 Issue: 02 | Feb 2024 www.irjet.net p-ISSN: 2395-0072
The area is located on the fringe area of the arid zone (Rajasthan) and falls under the semi-arid climatic conditions.Climateintheareacanbemarkedwithdistinct five seasons winter, spring, summer, monsoon and autumn..Thewinterprevailsforthreemonths(December – February). During this time, area is under influence of western disturbances and receive winter showers and foggy conditions prevails in the December and January. The spring season prevailshardly for two months (March –April) with moderate dryness and temperatures. The summer prevails for about three months (May – June) with high dryness and strong hot winds from South Western direction from arid land in Rajasthan. These windsbringdustandcausedtohighdustconcentrationin June-July.Monsoonseason(July–September)inthearea is characterized by high humidity and rainfall. Autumn season(OctobertoNovember)intheareacommenceafter retreat of monsoon. In one climatic year the atmosphere events show high concentration of dust in June and foggy conditionsinDecemberandJanuary.
4. DATA AND METHODS
In this study the monthly mean temperature and vapor pressure of Aligarh city is download from http://www.cru.uea.ac.uk/cru/data/hrg/. The 4.04 releaseoftheCRUTSdatasetcoverstheperiod1901-2019 andavailablewith0.5-degreeglobalresolution[12].
The CRU TS (Climatic Research Unit gridded Time Series) dataset provides a high-resolution, monthly grid of landbasedobservationsgoingbackto1901andconsistsoften observed and derived variables. Individual station series
are animalized using their 1961–1990 observations, then gridded to a 0.5° regular grid using angular distance weighting (ADW). Present data for the study area is griddedbasedon8surroundingweatherobservatories.
The description of outdoor thermal comfort is present in table 1. Each index is described in separate along with values and corresponding comfort level for the RSI, THI andWBGT.
Table 1:ThermalIndicesandtheirformulas
ThermalComfortIndex
RSI=T-21/58-E
THI= T–(0.55–0.00RH).(Ta-14.5)
WBGT= 0.567×T��+3.94+0.393×��
Variablesused
Ta= Average air Temperature (°C), E = vapor pressure (hpa)
Ta= Average air Temperature (°C), RH= Relative humidity(%)
Ta = Average air temperature(°C),RH = Relative humidity (%), E = water vapor pressure(hPa)
RSI index is used to assess the heat stress of outdoor environments. It is obtained from two variables of air temperature (°C) and water vapor pressure (hectopascal) (Equation1).Duetothefactthatatsomestationsthereis noaccessto watervapor pressurevariable, therefore this parameterisdetermined by usingthetwovariablesofair temperature and relative humidity, using [4] and [14]. A table of different level thermal comfort of Relative Strain Index(RSI)ispresentedinTable2
RSI=T-21/58-E (1)
Unfortunately, due to the lack of measurement of globe temperature (Tg) by meteorological stations, it is not possible to report the heat stress conditions based on the WBGT index provided by the International Organization for Standardization (ISO) (Equation 2). Therefore, the modelpresentedbytheAustralianBureauofMeteorology (ABM) was used in this study (Equation 2) used in [14]. This model has been used in several studies abroad [15, 16,17,18]
WBGTout=0.7Tnw+0.2Tg+0.1Ta (1)
International Research Journal of Engineering and Technology (IRJET) e-ISSN: 2395-0056
Volume: 11 Issue: 02 | Feb 2024 www.irjet.net p-ISSN: 2395-0072
Where, Tnw, Ta and Tg are natural wet temperature, dry temperature and globe temperature in terms of (°C) respectively[19].The water vaporpressureinequation 5 isuseddirectlyfromthedataclimatedataset.
��������=0.567����+3.94+0.393 (2)
Ta=Averageairtemperature(°C)
RH=Relativehumidity(%)
E=watervaporpressure(hPa)
Theclassificationofthisindex bytheAmericanCollege of SportsMedicine(ACSM)ispresentedintheWBGTtable 3, whichiscategorizedinfourlevels[20].
Table 2.Classificationoftherelativestrainindexlevels (Blażejczyk,2011).
Relative Strain Index InterpretationofIndex
RSI<0.15 Discomfortforsensitiveindividuals suchastheelderlyandchildren
0.15≤RSI<0.25 Discomfortforallpeople
0.25≤RSI<0.35 The risk of exposure to excessive heat (heat stroke risk) for 50% of peopleandmore
0.35≤RSI<0.45 The risk of hyperthermia for all people
RSI≥0.45 Discomfortforsensitiveindividuals suchastheelderlyandchildren
Table 3.RiskLevelsoftheWBGTindex.
4.3 Thermo-Hygrometric Index (THI)
The THI formula proposed by [4] was also used in the current study. This formula incorporates air temperature (T)andrelativehumidity(RH):
THI=T–(0.55–0.00RH)(Ta-14.5) (3)
Where T is air temperature (0C) and RH is relative humidity(%).Forcomfortvalues,[21]delimited(21.1 0C) as a threshold separating comfort from hot discomfort (Table 4). The comfortable conditions range between 15
0C and 20 0C [5]. Eight THI categories were calculated (very cold, cold, cool, comfortable, hot, very hot and torrid). Water vapor pressure (hPa) data were derived from psychometric formula using monthly of relative humidityandtemperaturedata.
Table 4.ThecategoriesoftheTHI.
THICategory THIValues(0C)
Extremelycold -19.9to-10.0
Verycold -9.9to-1.8
Cold -1.7to12.9
Cool 13.0to14.9
Comfortable 15.0to19.9
Hot 20.0to26.4
VeryHot 26.5to29.9
Uncomfortable <30
Exposure to heat stress can cause a wide range of disorders and complications in people and in some cases can cause death [ 17, 22]. Moreover, it can reduce the productivity and performance of individuals [23]. Therefore, evaluation of this harmful factor in outdoor environments can be considered as a priority. In this regard,differentindicesareusedtoassesstheheatstress andeachofthemhasadvantagesanddisadvantages[9].
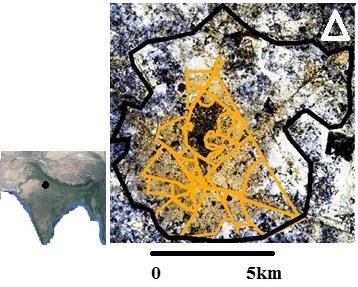
In this study, the THI, RSI index along with the WBGT index offered by the Australian Meteorological agency werestudiedforAligarhcity.IntheAligarhcityduringthe last 120 years, the maximum mean monthly air temperature was observed in June (34.07± 0.99 0C), the maximum vapor pressure in July (31.14 ± 1.13) hPA. While,minimummonthlytemperatureandvaporpressure wererecordedinJanuary(14±0.95)and(9.8±0.61)hPA. The long-term trends were determined for the mean atmospheric temperature 0C and vapor pressure hPA on monthlybasis.Slopeanalysisindicatedhighestincreaseis during autumn months and moderate increase in winter months. However, summer months show lowest increase (fig.2).TrendanalysisinotherstudiesinIndiancontinent also showed a continuous increase in lower temperature regimeofwinterandautumnandalsoimpactedontrends ofthethermalcomfortindices(fig.3).
The monthly RSI, WBGT and THI indices are separately presented in figure 4. The RSI, WBGT and THI showed higher discomfort level during the months of May to September. However, discomfort levels were observed
International Research Journal of Engineering and Technology (IRJET) e-ISSN: 2395-0056
Volume: 11 Issue: 02 | Feb 2024 www.irjet.net p-ISSN: 2395-0072
slightshorterbyRSIcomparetoWBGTandTHI. Trendsof the skewness and kurtosis for the 120 yrs. (1900 -2019) are presented in fig. 4. It indicated negative and positive trends for the skewness and kurtosis respectively for the different indices. But the slopes of trends were different for each index. Trends of skewness and kurtosis of THI showed highest slope for the long-term trend of THI. It suggestedthatTHIismostinfluencedbyclimatechangein last century. Long term temporal distribution of annual RSI, WBGT and THI indicate rising trends with different degree of growth. It indicated sudden increase in THI startedfrom1980onwards.ButthegrowthpatternofRSI and WBGT indicate continuous increase in index values since1900(fig.5).
Monthly variation in indices shows similarity between WBGT and THI and slightly differ with RSI. A significant correlation between studied indices, shows appropriateness of using the RSI, THI and WBGT. Present study also indicated that bioclimatic indices WBGT and THI show very good exponential relation. However, RSI and THI, WBGT and RSI showed linear relation with high correlationcoefficient(fig.5).
Regarding the advantage of using Thermal comfort indices, it should be noted that data measured by meteorological organizations can be used to predict and timely announce the state of heat stress in a region. If preventive management measures are taken by the relevant organizations, the occurrence of stressful conditions and its complications will reduce among exposed people. The low cost for measuring and easy interpretation of thermal index is one of its benefits. On the other hand, given the climate change phenomena and global warminginthecomingdecades,theamountofthis indexbyconsideringdifferentscenariosofclimatechange can be predicted. It is hoped that this way steps to maintain and protect the health of individuals can be taken, especially the manpower of outdoor work environments.
The long-term trends for the mean atmospheric temperature and vapor pressure on monthly basis indicated highest increase is in autumn and moderate increase in winter months, while summer months show minimum increase. These climatic trends also impact on trendsofthethermalcomfortindices. RSI,WBGTandTHI showedhigherdiscomfortlevelduringthemonthsofMay toSeptember.Trendsoftheskewnessandkurtosisforthe 120 yrs. (1900 -2019) indicate highest change for THI. It showed highest increase in Kurtosis and decrease in skewness indicated as result of climate change in the last century. Long term trends of annual RSI, WBGT and THI mean value indicating rising in indices values from 1980
onwards. But the long-term trends suggested that RSI showingacontinuousincreasesince1900inindexvalues.
Trendofthemothlyairtemperaturein 0C jan Feb. Nov. Dec.
= 0.3093
Figure 2:Longtermtrendsofthemonthlyatmospheric temperature(0C)forthelast120(1900-2020).
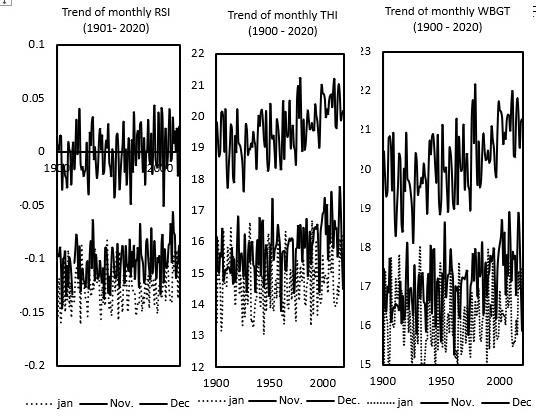
Figure 3:Longtermtrendsoftheoutdoorthermalindices forthelast120(1900-2020)yearsinAligarh y = 0.0019x + 11.04 R² = 0.0046 y = 0.0131x - 8.1349 R² = 0.1359 y = 0.0159x - 10.252
International Research Journal of Engineering and Technology (IRJET) e-ISSN: 2395-0056
Volume: 11 Issue: 02 | Feb 2024 www.irjet.net p-ISSN: 2395-0072
Figure 4: Monthlychangeinoutdoorthermalindices(a), Longtermannualskewnessandkurtosistrendsofthe differentbioclimaticIndicesforthelast120years(19012019) lues.
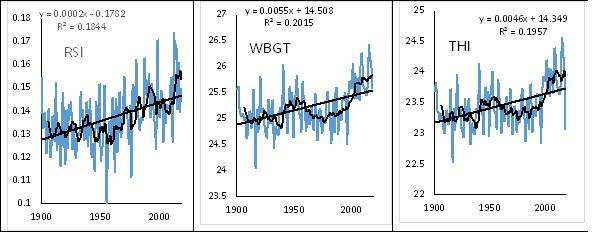
Figure 5:Temporalchangeinannualmeanoutdoor thermalindices(RSI,WBGTandTHI).Blackthickline indicated6yearrunningaverage.
ACKNOWLEDGEMENT
The authors would like to express their sincere thanks to Principal, University Polytechnic, Aligarh Muslim University for providing the laboratory and library facilities.
[1] A. Abdel-Ghany, I. Al-Helal and M. Shady, “Human Thermal Comfort and Heat Stress in an Outdoor Urban Arid Environment: A Case Study, ” Advances in Meteorology, 2013, 1-7. doi:10.1155/2013/693541
[2] C Freitas and E Grigorieva, “A comparison and appraisal of a comprehensive range of human thermal climate indices,” Int J Biometeorol, 2017, 61(3), pp.487-512. [http://dx.doi.org/10.1007/s00484-016-1228-6]
[3] S. Nieuwolt, “Tropical climatology. An introduction to the climates of the low latitudes. John Wiley and Sons”,1977.
[4] W Kyle, “Summer and winter patterns of human thermal stress in Hong Kong”, In: Kyle, W., Chang, CP., (Eds.), Proceedings of the 2nd Int, Conference on east asia, and western pacific meteorology and climate,HongKong557-83,1992
[5] J.Unger, “Comparisons of urban and rural bioclimatologicalconditions inthecaseofaCentral European city,” Int. J. Biometeorol. 1999, 43, 139–144.
[6] A. Polydoros and C.Cartalis, “Assessing thermal risk in urban areas - an application for the urban agglomeration of Athens”, Advances in Building Energy Research, 2014, 8, 74-83. doi:10.1080/17512549.2014.890536.
[7] M. Stathopoulou, C. Cartalis, and A. Andritsos, “Assessing the thermal environment of major cities in Greece” In 1st International Conference on Passive and Low Energy Cooling for the Built Environment,Santorini,GreeceMay2005.
[8] R. Emmanuel, “Thermal comfort implications of urbanization in a warm-humid city: the Colombo MetropolitanRegion(CMR),SriLanka.Buildingand Environment, 2005, 40(12), 1591-1601. doi:10.1016/j.buildenv.2004.12.004.
[9] I. Bajsanski, D. Milosevic, and S. Savic, “Evaluation and improvement of outdoor thermal comfort in urban areas on extreme temperature days: Applications of automatic algorithms. Building and Environment”, 2015, 94, 632-643. doi:10.1016/j. buildenv.2015.10.019.
[10] J. Fischereit and K. Schlunzen, “Evaluation of thermal indices for their applicability in obstacle resolving meteorology models” International
International Research Journal of Engineering and Technology (IRJET) e-ISSN: 2395-0056
journal of biometeorology, 2018, 62(10), 18871900.doi:10.1007/s00484-018-1591-6.
[11] S. Farooq and S. Ahmad, “Urban sprawl development around Aligarh city: a study aided by satellite remote sensing and GIS,” Jour. Indian Soc. RemoteSensing, 2008, 36(1),pp.77-88.
[12] I. Harris, T. Osborn, P. Jones, “Version 4 of the CRU TS monthly high-resolution gridded multivariate climate dataset” Sci Data, 2020, 7, 109 https://doi.org/10.1038/s41597-020-0453-3
[13] N Ionac and S Ciulache, “The bioclimatic stress in Dobrudja. Present Environment and Sustainable Development,”2007,1,168-78.
[14] B. Lemke and T. Kjellstrom, Calculating workplace WBGT from meteorological data: A tool for climate change assessment. Ind Health, 2012, 50(4), 26778.[http://dx.doi.org/10.2486/indhealth.MS1352].
[15] T Kakamu, K Wada, D Smith, S Endo and T Fukushima, “Preventing heat illness in the anticipated hot climate of the Tokyo 2020 Summer Olympic Games. Environ Health Prev Med, 2017, 22(1), 68. [http://dx.doi.org/10.1186/s12199-0170675-y].
[16] S, Leroyer, S, Belair, S, Spacek, L and I. Gultepe, “Modelling of radiation based thermal stress indicators for urban numerical weather prediction. Urban Climate, 2018, 25, 64-81. [http://dx.doi.org/10.1016/j.uclim.2018.05.003]
[17] S Farhang, A Mehri, F. Golbabaei and M. Beheshti, “Heatstressassessmentin outdoorworkplacesofa hot arid climate based on meteorological data: a casestudyinqom,Iran” JournalMilMed,2015,17, 89-95.
[18] R. Hajizadeh, A. Mehri, S. Jafari, M. Beheshti, and H. Haghighatjou,“FeasibilityofESIindextoassessheat stressin outdoor jobs. Journal Of Occupational And EnvironmentalHealth,2016,2,18-26.
[19] P.Nassiri,M.Monazzam,F.Golbabaei,S.Dehghan,S. Rafieepour, A Mortezapour, and M.Asghari, Application of Universal Thermal Climate Index (UTCI)forassessmentofoccupationalheatstressin open-pit mines. Ind Health, 2017, 55(5), 437-43. [http://dx.doi.org/10.2486/indhealth.2017-0018].
[20] Y. Epstein,and D. Moran, “Thermal comfortandthe heat stress indices”, Ind Health, 2006, 44(3), 38898.[http://dx.doi.org/10.2486/indhealth.44.388.
[21] E. Thom, “The Discomfort Index. Weatherwise,” 1959, 12, 57-60 http://dx.doi.org/10.1080/00431672.1959.992696
[22] M.Asghari,P.Nassiri,M.Monazzam,F.Golbabaei, A. Shamsipour, and H. Arabalibeik, “Provision of an empiricalmodeltoestimatetheadaptivecapacityof workers at risk of heat stress Health Scope”, 2018, 7.
[23] A. Mazloumi, F. Golbabaei, S. Mahmood Khani, Z. Kazemi, M. Hosseini, M Abbasinia, M and S. Farhang Dehghan, “Evaluating effects of heat stress on cognitive function among workers in a hot industry”, Health Promot Perspect, 2018, 4(2),2406.
Volume: 11 Issue: 02 | Feb 2024 www.irjet.net p-ISSN: 2395-0072 © 2024, IRJET | Impact Factor value: 8.226 | ISO