
International Research Journal of Engineering and Technology (IRJET) e-ISSN:2395-0056
Volume: 11 Issue: 02 | Feb 2024 www.irjet.net p-ISSN:2395-0072
International Research Journal of Engineering and Technology (IRJET) e-ISSN:2395-0056
Volume: 11 Issue: 02 | Feb 2024 www.irjet.net p-ISSN:2395-0072
Assefa Molla Terefea , Mehari Mariyea , Markos Medhin Asheboa , Agimasie Demewozb
aTongji University, College of Environmental Science and Engineering, Shanghai,200092, China, b Ministry of Planning and Development, Addis Ababa, Ethiopia ***
Abstract
There has been discussion over how various parts of the world's agricultural output may be affected by climate change. The agriculture industry has been adversely impacted on a global scale by recent climate change, resulting in negative effects across all economicsectors. Thisstudyaims toassesshowEthiopia'sagricultural productivityhas been impacted byclimate changebetween1991and2021.Byinvestigatingtherelationshipbetweenagriculturalinputsandoutputsandconcentrating ontheeffectsofclimatechangeonagriculturalproductivityinEthiopia'sagriculturalsector,thisstudyaimstoclosethe gaps above in knowledge. Todetermine the relationship between the study variables and the data used to analyze how climate change may affect Ethiopia's agricultural productivity, the autoregressive distributed lag (ARDL) approach was used. When everythingelseisequal,anincreaseinthecoefficientofvariationoftemperaturewill,overtime,resultina3.84%increasein theagriculturalproductivityofland,accordingtotheresultsoftheARDLtechnique.Similarly,anincreaseintheprecipitation coefficient as a percentage will result in a 0.48% rise in the land's agricultural productivity. Citrus Paribus, as well as The annual average temperature and precipitation, which are the study's primary variables and are employed as indicators of climate change, have mean values of 23.374 degrees Celsius and 86.938 mm, respectively. Additionally, the lowest recorded temperature during the period of 1991 was 22.92 degrees Celsius, while the highest recorded annual average temperature figure for 2013–2014 was 23.67 degrees Celsius. The findings of the correlation indicate a positive relationship between agricultural output and the following variables: yearly temperature, annual precipitation, fertilizer use, animal stock, and pesticides. The output of agriculture is negatively correlated with other factors, such as labor employment. Ethiopia will encounterdifficultieswithfoodsecurityandsafety asa resultofitsgrowingpopulation.Toensurethatthereisenoughfood fortheexpandingpopulationandtomitigatethenegativeeffectsofclimatechangeonagriculture,theEthiopiangovernment needs to take possible steps. To put it succinctly, the analysis indicates that policy experts and lawmakers should recognize that climate change would alter the total output factors and that, as a result, an adaptation to the total factor of production patternspecifictoacountyorcropisrequired.
Keywords: agriculturalproductivity,climatechange,Ethiopia
1. Introduction
Agricultureisconsidered themostvulnerabletoglobal climatechange, thesecurity offood isanotherissuethatneedsgreat concern to all humankind, and the influence of climate change on agriculture has attracted huge attention [1, 2] . Agriculture servesasaprimarysourceofincomeformanyruralcommunitiesandbearsthebruntofclimatechangeimpacts tosafeguard thelivelihoodsofimpoverishedruralhouseholds.Additionally,agricultureplaysacrucial roleinupholdingfoodsecurity[3, 4] The agriculture sector's dependence on climate variability is a significant issue for economic progress, given that a large portionofthepopulationresidesinruralareasandisinvolvedinbothagriculturalandnon-agriculturalpursuits[3,5] Farmers continually strive to adjust to fluctuations in weather and climatic conditions. Nevertheless, the broader scope of environmental and global climate changes has heightened the demand for farmers to devise and deploy more extensive resilience strategies [6-8] . One approach to mitigating the risks of climate change and safeguarding livelihoods and local food securityistoadjustandadaptwithintheexistingagriculturalsystem.Thoughthetypeandscopeofadaptationstrategiesvary fromregiontoregion,socio-economicand agro-ecologicalenvironmentsareconstantly changing [9-12] Hence,theproduction offoodisfacing disruptions duetoshiftsinweatherpatternsandclimatechange.Investigating theimpactofclimatechange onagriculturalproductivityinEthiopiaisimperative.
International Research Journal of Engineering and Technology (IRJET) e-ISSN:2395-0056
Volume: 11 Issue: 02 | Feb 2024 www.irjet.net p-ISSN:2395-0072
The global population is projected to reach approximately 10 billion, and understanding and addressing these challenges becomeincreasinglycrucial[13] .Theescalatingintensityofextremeweathereventsandthefrequentoccurrenceofwidespread issues significantly impact agriculture. Farmers regularly contend with unpredictable rainfall, pest infestations, and natural disasters. Examples include encountering heavy rains, floods, pests, droughts, and fluctuations in market prices[14-18] On the other side, in most parts of Ethiopia, climate warming usually shortens the growth cycle of food crops, which leads to demurating the average production [19-23] . Because of the numerous seasonal droughts, there is a spatial and temporal gap betweenprecipitationandirrigation,whichensuresadequatechallengesinirrigationandwatersupply [24-26].Inthefuture,the climate change in Ethiopia may bring more uncertainty in the agricultural productivity. Previously research is conducted in this area for instance, [27-29] The initial two studies examined how climate change affects agriculture. in this study, authors have investigated the correlation between agricultural productivity with temperature, precipitation, fertilizer, livestock, and pesticides by using an autoregressive distributed lag (ARDL) bounds testing approach to check the association among the studyvariables.Hence,thisresearchseekstoaddressthegapsabovebyexaminingtheinteractionbetweenagriculturalinputs andoutputs,specificallyfocusingontheimpactofclimatechangeonagriculturalproductivity,afixedinputintheagricultural sectorinEthiopiabyusingARDLmodeltimeseriesdatathatspanfrom1991-2021.
2. Material and methods
2.1. Data and Data Source
A summary of the secondary sources of data as depicted in Table 1 like agricultural productivity, Agricultural employment sector, fertilizer,Animal stock,andPesticidewerecollectedfrom the WorldBank Index(WBI).data likeannual temperature andannualprecipitationscanbeusedintheclimatechangeknowledgeportal(CCKP).
Table 1 Asummaryofthesecondarysourcesofdata
Typeofvariable
Agriculturalproductivity
Agriculturalemploymentsector
temperature
precipitation
fertilizer
Animalstock
Pesticideused
Unitofvariable
Metricton
Farmlaborforce
DegreeCelsius
mm
Metricton
Metricton
Metricton
Source:WBI=WorldBankIndex,CCKP=climatechangeknowledgeportal
2.2. Methods
Source
WBI
WBI
CCKP
CCKP
WBI
WBI
WBI
Datawascollectedthroughsecondarydatasources.Theresultswerepresentedusingtables,percentages,graphs,andmean values to give a general picture from which conclusions and recommendations were drawn. Statistical analyses have been carried out to examine the impact of climate change on agricultural productivity in Ethiopia, using the following methods: First, descriptive statistics (i.e., mean and standard deviation) of the variables (both dependent and independent) were calculated over the sample period which states using descriptive statistics methods helps the researcher in picturing the existingsituationandallowsrelevantinformation. Theautoregressivedistributedlag(ARDL)approachwasappliedtoassess the association among the study variables with the evidence to evaluate the influence of climate change on Ethiopia’s agricultural productivity analysis. Data collected from different sources were analyzed by using the STATA 17 software package (According to Stata Corp(2016), Stata is a comprehensive and integrated statistical software package designed to offerallthenecessarytoolsfordataanalysis,datamanagement,andgraphics.WithStata,youcanstoreand handlebothlarge andsmalldatasets,performstatisticalanalyses,andgeneratevisuallyappealinggraphs. Thissoftwareiswidelyemployedby health researchers, especially those dealing with extensive datasets, given its robust capabilities that enable versatile data manipulation.It'scrucialtoemphasizethatwhileStataisapowerfulstatisticaltool,it'snotthesoleoptionavailable. Thereare numerous other statistical software programs that you may encounter in my professional journey involving data analysis. Basedontheliteraturethenetagriculturaloutputadjustedforinputcosts,ishypothesizedtobeinfluencedbyvariousfactors foreachtime,denotedast.Thesefactorsincludetheareaoflandavailable(At),theareaofannualprecipitation(Pr),thelevel
International Research Journal of Engineering and Technology (IRJET) e-ISSN:2395-0056
Volume: 11 Issue: 02 | Feb 2024 www.irjet.net p-ISSN:2395-0072
oflaboremployedintheagriculturesector(Lt),thetemperature(Tt),thequantityofanimalstock(St),theamountoffertilizer used(Ft),andthevolumeofpesticidesused(Pt).Thisrelationshipcanberepresentedintheequation1asfollows:
Where:
LtRepresentstheamountoflaborengagedintheagriculturesectorduringtheperiodt.
Atdenotesthetotalareaofcultivatedlandperperiodt.
Ftdenotesthequantityoffertilizerappliedduringperiodt.
Strepresentsthenumberoflivestockunitsavailableduringperiodt.
Ptrepresentsthevolumeofpesticidesusedduringperiodt.
Ttrepresentstheannualtemperaturerecordedduringperiodt.
Prsignifiestheannualprecipitationobservedduringperiodt.
Agricultural productivity can be evaluated through either single-input factor productivity or total factor productivity. In this study, a single-input productivity measure has been utilized due to data availability constraints. This choice is primarily influenced by the critical importance of land productivity in Ethiopia, where there is a fixed amount of arable land, varying adaptabilitytotechnology,andasteadilygrowingpopulationovertime.
Consequently,Equation(2)willbedividedbytheareaoflanddedicatedtoagriculture(At).
Now,byintroducingclimatechangeindicatorvariables,specificallythecoefficientofvariationinaveragetemperatureand the coefficient of variation in average precipitation, we can account for the impact of climate on agricultural productivity. It's importanttonotethatthesevariablesarebeyondthecontrolofthefarmerandwerepreviouslyomitted.
Consequently,
Where:
-perc-representsthecoefficientofvariationinprecipitation. -temp-representsthecoefficientoftemperaturevariation
ThegeneralizedARDLmodelcanbedefinedasfollows:
Basedontheequationpresentedabove,themodelutilizedinthisstudycanbeexpressedasfollows:
Where:
International Research Journal of Engineering and Technology (IRJET) e-ISSN:2395-0056
Volume: 11 Issue: 02 | Feb 2024 www.irjet.net p-ISSN:2395-0072
β1toβ7aresofassociatedindependentvariables.
2.2.1. Unit root test
Aunitroottestisa fundamental toolfordetectingnon-stationarityintimeseriesdata.Non-stationaryprocessescanarisein twomainforms: trendstationary, wherethetrendcan be predicted frompastobservations, anddifferencestationary, where the process is not predictable from past data points. As a result, many time series variables exhibit stationarity only after differencing. However, differencing can lead to a loss of long-term properties or information regarding the equilibrium relationshipsbetweenthevariablesbeingstudied.Varioustestsareavailabletoassessthepresenceofunitroots,includingthe Durbin-Watson(DW)test,theDickey-Fuller(DF)test(1979),theAugmentedDickey-Fuller(ADF)test(1981),andthePhillipsPerron (PP) test (1988). It's worth noting that these tests represent only a selection of the available methods for conducting unitroottests.
Dicky-Fuller (DF) test: As per the specification outlined by Dickey and Fuller in their article titled "Distribution of the Estimators for Autoregressive Time Series with a Unit Root," they have provided a method for testing the presence of a unit rootinanautoregressivemodel.
Augmented Dicky Fuller (ADF) test: The distinction between the DF and ADF tests for stationarity is related to the characteristicsoftheerrorterm.Whentheerrortermisuncorrelated,the Dickey-Fuller(DF)testcanbeapplied.However,if the error term exhibits correlation, then the Augmented Dickey-Fuller (ADF) test becomes necessary. In the ADF test, lagged valuesofthedependentvariableareincorporatedaswell.
Phillips Perron (PP) test: Nonparametric statistical techniques are employed to tackle the issue of serial correlation in the errortermsbyintroducinglaggeddifferenceterms.Thisapproachistakenbecausetheasymptoticdistribution ofthePhilipPerron(PP)testalignswiththatoftheAugmentedDickey-Fuller(ADF)teststatistic.
The ARDL method involves estimating a total of (p + 1) k regressions to determine the most suitable lag length for each variable, where prepresentsthe maximumnumberoflagsandk isanother parameter. Thechoice ofthe modelcanbemade using model selection criteria such as Schwartz-Bayesian Criteria (SBC) and Akaike's Information Criteria (AIC). SBC is recognized for favoring a more parsimonious model by selecting the smallest possible lag length, while AIC tends to favor a modelwiththemaximumrelevantlaglength.Toapplythesecriteria,calculatethefollowingstatisticsforthesystemateachlag lengthandchoosethemodelwiththelowestAICorSBCvalue.
3. Result and Discussion
3.1.
Table 2 showsthatinthedatathatrunsfrom1991to2021fordescriptiveStatisticsofanalysis,theVariable'saveragelevelof gross agricultural output per input land is found to be $44.67 while its standard deviation, minimum, and maximum values exhibited$22.435,$8.974,and$78.645perkilometersquare,respectively.Thesevaluesreveal thatthereisa hugevariation over time for agricultural output per land since the value of standard deviation is less than its mean. The study’s main variableswhichareusedasindicatorsofclimatechange,annualaveragetemperature,andprecipitation,haveshownamean value of 23.374 degrees Celsius and 86.938 mm, respectively. Further, the maximum annual average temperature value was registered in 2013- 2014 to be 23.67 degrees Celsius while the minimum value during the period 1991 was 22.92 degrees Celsius which were registered. The mean amount of fertilizer used per area of land was found to be 20.156 kg per square kilometerwhichalsoexhibiteda slightlylowerlevel of thestandarddeviationof10.594kgpersquarekilometer.Duringthe study period, the minimum and maximum values are 5.702 kg and 44.26 kg per square kilometer, respectively. One of the maininputsforouragriculturalproductioninEthiopia,animalstock,hasregisteredameanvalueof80.365livestockunits per
International Research Journal of Engineering and Technology (IRJET) e-ISSN:2395-0056
square kilometer. the other main input for the agricultural sector in Ethiopia, agricultural labor, has been found to employ 73.232 employees per square kilometer. Further, the minimum and the maximum values are 42 and 126.9 number of employeespersquarekilometer,respectively.
Table 2 SummaryofDescriptiveStatisticsoftheVariables
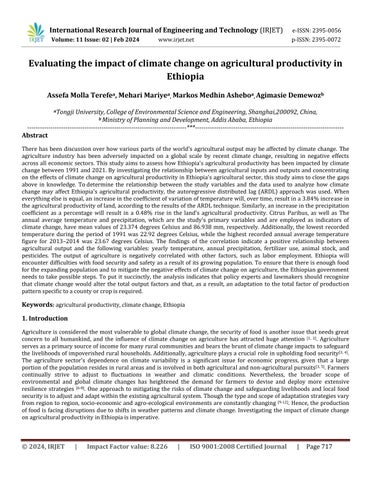
The growth in agricultural productivity, as depicted in Figure (a), can be attributed to a series of strategic initiatives implementedbytheEthiopiangovernment,particularlysincearound2003.Theseinitiativesencompassmultifacetedsupport systemsaimedatenhancingtheagriculturalsector.Investmentsininfrastructure, suchasroadsandirrigationsystems,have facilitated better access to markets and improved transportation of agricultural goods. Additionally, the government has prioritized research and development, leading to the introduction of advanced farming techniques, high-yield crop varieties, and more efficient agricultural practices. Extension services play a crucial role in disseminating knowledge and providing technical assistance to farmers, enabling them to adopt modern technologies and best practices. Furthermore, subsidies for inputslikeseedsandfertilizershave made essential resourcesmoreaccessible tosmallholderfarmers, empoweringthem to increase their productivity and yields. This comprehensive approach to agricultural development has not only boosted productivitybuthasalsocontributedtofoodsecurity,povertyreduction,andoveralleconomicgrowthinEthiopia.Asaresult, the agricultural sector has become a cornerstone of the country's economy, driving progress and prosperity for rural communitiesandthenationasawhole.
ThetrenddepictedinFigure(b)highlightstherelationshipbetweenfertilizerusageandagriculturalproductivityinEthiopia. The observed constancy in fertilizer use up to 2002 suggests a relatively stable agricultural landscape during that period. However, as the curve becomes progressively steeper in the years following 2002, it indicates a significant increase in fertilizerapplication.
Severalfactorscontributetothistrend,includingpopulationgrowthandthe consequentriseindemandforfoodproduction. With a growing population, there is heightened pressure on farmers to increase their yields to meet the increasing food requirementsofthenation.Inresponse,farmersintensifytheiragriculturalpractices, relyingmoreheavilyoninputssuchas fertilizers to enhance soil fertility and crop productivity. Moreover, as agricultural productivity becomes increasingly crucial forfoodsecurityandeconomicdevelopment,farmersareincentivizedtoadoptmodernfarmingtechniquesthatoftenrequire greaterfertilizerapplication.Thisintensificationofagriculturalpracticesisreflectedinthesharperupwardtrendinfertilizer usage over time. Overall, the correlation between fertilizer use and agricultural productivity underscores the pivotal role of fertilizers in sustaining and enhancing crop yields in Ethiopia. However, it's essential to ensure sustainable fertilizer managementpracticestomitigateenvironmentalrisksandpromotelong-termagriculturalresilience.
The trend illustrated in Figure (c) highlights the growth trajectory of animal stock in Ethiopia, indicating a steady increase over time with a sharper upward curve post-2002. This upward trend mirrors the expansion in agricultural productivity, suggesting a correlation between livestock rearing and overall agricultural output. Several factors contribute to this trend. Firstly, as mentioned, the rising Ethiopian population has led to increased demand for meat, dairy, and other livestock products.Thisdemographicpressurenecessitatesanexpansionoflivestockproductiontomeetthegrowingdietaryneedsof
Volume: 11 Issue: 02 | Feb 2024 www.irjet.net p-ISSN:2395-0072 © 2024, IRJET | Impact Factor value: 8.226 | ISO 9001:2008 Certified Journal | Page721
International Research Journal of Engineering and Technology (IRJET) e-ISSN:2395-0056
Volume: 11 Issue: 02 | Feb 2024 www.irjet.net p-ISSN:2395-0072
the populace. Additionally, urbanization plays a significant role in shaping dietary preferences and driving the demand for animal products. As more people migrate to urban areas, there is a shift towards diets that include a higher proportion of animal-based foods. This shift is driven by factors such as increased disposable income, exposure to urban lifestyles, and culturalinfluences,allofwhichcontributetoagreaterdemandforlivestockproducts.Moreover,advancementsinagricultural practices, including improved animal husbandry techniques, veterinary services, and access to better-quality feed, have contributed to the growth of the livestock sector. These advancements have enabled farmers to raise healthier and more productive animals, thereby increasing overall agricultural productivity. The correlation between animal stock growth and agricultural productivity underscores the interconnectedness of livestock rearing and crop production within the broader agriculturalsystem.Aholisticapproachtoagriculturaldevelopmentthatintegratesbothcropandlivestocksectorsisessential forensuringfoodsecurity,povertyalleviation,andsustainablerurallivelihoodsinEthiopia.Additionally,it'scrucialtoaddress challenges such as disease management, land degradation, and resource constraints to ensure the long-term viability and resilienceofthelivestocksector.
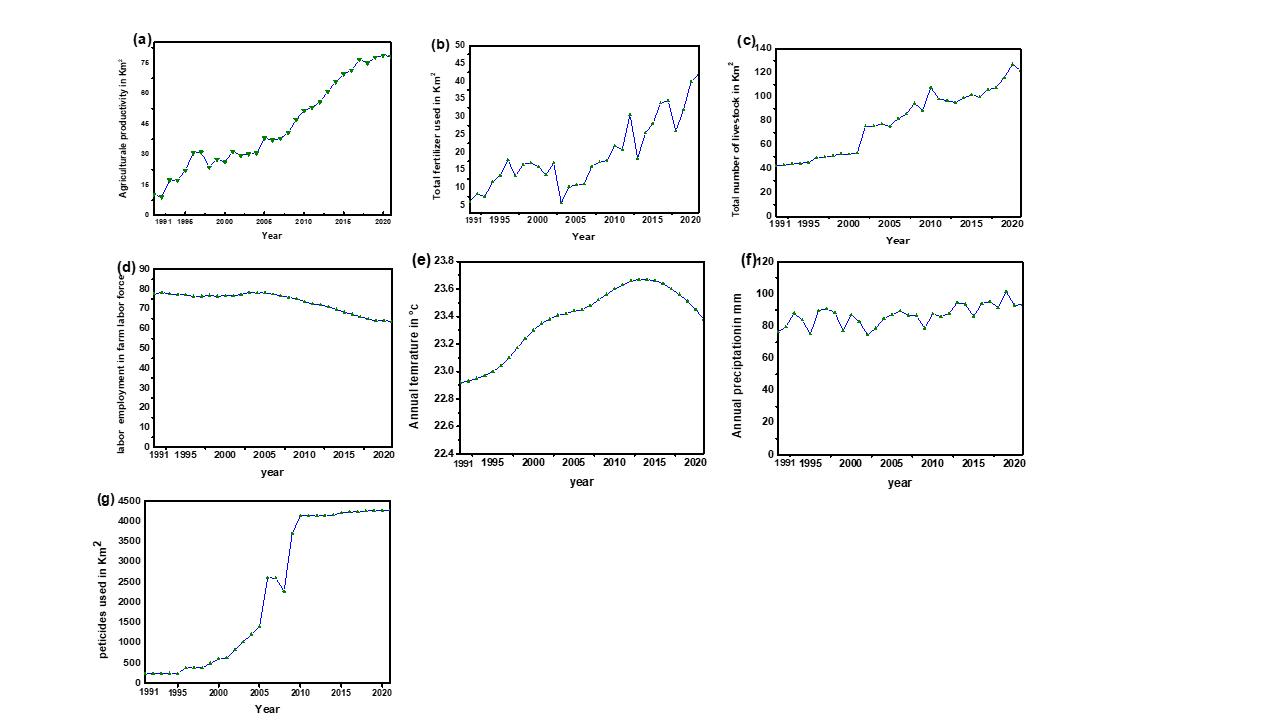
Figure 1 (a)Agriculturalproductivityperyear,(b)Fertilizerusedperyear,(C)Animalstockperyear,(d)Laboremployment peryear,(e)annualtemperatureperyear.(f)annualprecipitationperyearand(g)Pesticidesusedperyear.
The trend depicted in Figure (d) regarding labor employment in agriculture reveals a notable shift in dynamics, particularly after2005.Whilethereisconsistencyinthetrendbefore2005,withachangeobservedthereafter,thegrowthbecomesflatter, suggesting a decrease in labor employment alongside agricultural productivity gains. This inverse relationship indicates a
© 2024, IRJET | Impact Factor value: 8.226 | ISO 9001:2008 Certified Journal | Page722
International Research Journal of Engineering and Technology (IRJET) e-ISSN:2395-0056
Volume: 11 Issue: 02 | Feb 2024 www.irjet.net p-ISSN:2395-0072
negativecorrelationbetweenlaboremploymentandagriculturalproductivityduringthisperiod.Severalfactorscontributeto this phenomenon. One significant factor is the increasing adoption of automation and technological advancements across various industries, including agriculture. As farmers embrace mechanization, precision farming techniques, and advanced machinery, the demand for manual labor in agriculture diminishes. Jobs that are routine and repetitive, such as planting, harvesting, and field maintenance, are increasingly being replaced by automated systems and machinery, leading to a reductioninlabor employment.Furthermore,theshiftawayfromlabor-intensiveagricultural practicestowards mechanized farming not only increases efficiency and productivity but also reduces the overall labor requirements in the agricultural sector. This trend is further exacerbated by factors such as rural-to-urban migration, as young people seek employment opportunitiesin non-agricultural sectorsanddemographic changesthataffectthecomposition oftherural workforce. While thedeclineinlaboremploymentmayinitiallyseemconcerningfromasocio-economicperspective,itisimportanttorecognize that increased productivity resulting from technological advancements can lead to overall economic growth and improved livingstandards.However, policymakersmust address the potential challengesassociated with job displacement and ensure the availability of alternative employment opportunities, as well as invest in education and training programs to equip the workforce with the skills needed for emerging industries. Additionally, measures to mitigate the impact on marginalized communities and promote inclusive growth should be prioritized to ensure a more equitable transition to a technologically advancedagriculturalsector.
The trend depicted in Figure (e) regarding annual temperature fluctuations suggests variability within a relatively narrow range, typically between approximately 22.9 and 23.66 degrees Celsius. This range indicates a consistent pattern of temperature variation over time, with fluctuations occurring around a central value. However, without a clear upward or downward trend,it'sdifficulttoascertainanytrend-dependentmovementsolelybasedontheprovidedinformation.Annual temperature fluctuations within this range can be influenced by various factors, including seasonal variations, weather patterns, and natural climatic cycles. Additionally, localized factors such as altitude, proximity to water bodies, and land use patterns can also contribute to temperature variability in specific regions. It's essential to consider longer-term data and conductamorecomprehensiveanalysistodetermineifthereareanydiscernibletrendsorpatternsintemperaturevariation over time. The trend-dependent movement would require consistent directional changes in temperature over an extended period,whichmayindicateunderlyingclimaticshiftsortrends,suchasglobalwarmingorregionalclimatechange.Togaina deeperunderstandingoftemperaturedynamicsandtheirimplications,furtheranalysisincorporatinghistoricaldata,climate models,andregionalclimatictrendswouldbenecessary.Thisholisticapproachcanprovidevaluableinsightsintothedrivers oftemperaturevariabilityandinformdecision-makingprocessesrelatedtoclimateadaptationandmitigationstrategies.
The trend depicted in Figure (f) regarding inter-seasonal rainfall from 1991 to 2021 reveals a fluctuating pattern with variations swinging between approximately 60.9 and 100 mm of rainfall. This variability in rainfall can significantly impact agricultural productivity, as it directly influences soil moisture levels, crop growth, and overall agricultural output. The correlation between rainfall patterns and periods of famine in Ethiopia is well-documented. When annual precipitation falls below average, it can severely limit agricultural production, leading to food shortages and famine. The two major periods highlighted in the graph, 1995 and 2002, where Ethiopia experienced low average annual precipitation of 75mm and 74mm respectively, coincide with significant challenges in food security and famine conditions. Fluctuations in rainfall and temperatureconditionscanhavefar-reachingconsequencesbeyondagriculturalproductivity.Insufficientrainfallcanleadto shortages of potable water, exacerbating water scarcity and sanitation challenges. Loss of soil fertility due to inadequate moisture and prolonged drought conditions can further reduce agricultural yields and threaten food security. Moreover, soil erosion and land degradation are exacerbated during periods of erratic rainfall, as extreme weather events such as heavy rainfall followed by drought can accelerate soil erosion processes. This degradation of natural resources undermines the resilience of rural communities and exacerbates vulnerability to climate-related shocks. Addressing the challenges posed by fluctuating rainfall patterns requires a multifaceted approach that includes investments in water resource management, climate-resilient agricultural practices, and disaster preparedness measures. Building infrastructure for water storage and irrigationcanhelpmitigatetheimpactsofdroughtwhilepromotingsustainablelandmanagementpracticesthatcanenhance soil health and resilience. Additionally, early warning systems and social safety nets are essential for providing timely assistancetovulnerablepopulationsduringperiodsoffoodinsecurityandfamine.Byaddressingboththeimmediateimpacts andunderlyingdriversofvulnerability,Ethiopiacanbuildresiliencetoclimatechangeandpromotesustainabledevelopment.
The trend illustrated in Figure (g) regarding the use of pesticides shows fluctuations during the first decade of the study, followed by a consistent upward trend in the two consecutive decades after 2003. This increasing trend in pesticide usage reflects various dynamics within the agricultural sector, including changes in cropping patterns and pest management
International Research Journal of Engineering and Technology (IRJET) e-ISSN:2395-0056
Volume: 11 Issue: 02 | Feb 2024 www.irjet.net p-ISSN:2395-0072
practices. Onefactorcontributingtotheobservedtrendistheevolvinglandscapeofcropcultivation.Changesin thetypesof cropsgrown,drivenbymarketdemand,agronomicfactors,andclimaticconditions,caninfluencetheprevalenceandtypesof pests encountered by farmers. If there is a shift towards crops that are more susceptible to pests or diseases, farmers may respond by increasing their use of pesticides as a means of pest control and crop protection. Additionally, as agricultural productivity becomes increasingly important for meeting food security and economic development goals, farmers may intensifytheirpestmanagementeffortstosafeguardtheiryields.Thisintensificationcaninvolvetheuseofchemicalpesticides tocombatpestsandreducecroplosses,particularlyinregionswherealternativepestmanagementstrategiesmaybelimited or less effective. However, while pesticides can effectively control pests in the short term, their indiscriminate use can have adverse environmental and human health impacts. Pesticide runoff can contaminate water sources, harm non-target organisms,andcontributetothedevelopmentofpesticideresistanceinpestpopulations.Furthermore,exposuretopesticides posesriskstofarmworkers,consumers,andecosystems.Toaddressthesechallenges,itisessentialtopromoteintegratedpest management(IPM) approachesthatcombinevarious pest control methods,suchas biological control,crop rotation, and the use of resistant crop varieties, with judicious pesticide use. By adopting IPM strategies, farmers can minimize reliance on chemical pesticides while effectively managing pest populations and preserving ecosystem health. Additionally, regulatory frameworksandextensionservicesplayacrucialroleinpromotingsafeandsustainablepesticideusepractices,ensuringthat farmers have access to information, training, and resources to make informed decisions about pest management. By promotingresponsiblepesticideuseandsupportingintegratedpestmanagementapproaches,policymakerscanhelpmitigate the environmental and health risks associated with pesticide use while ensuring the long-term sustainability of agricultural production.
3.3. Unit root test
Table3revealsthatalllagselectioninformationcriteriahaveshownsimilaroptimallaglengthsexceptforallvariablesatthe same time. Using this result further the variables have been diagnosed for the presence of unit root test based on the AugmentedDickey-FullerandPhillips-Perrontestes.Bothmethodstrytoassesifthevariablesandtheirlaggedvalueshavea serial correlation.Inthis test,our objective isto rejectournull hypothesis thatstatesthere isa unit roottest whichimplies thatthevariableisnotstationary.Ifthevariablehasbeenfoundnonstationary(i.e.ifwefailtorejectournullhypothesis)at level,thentheirfirstdifferenceis checkedusingthesameprocedure.
Results from Table to of the ADF unit root test imply that two of the variables the researcher considering are stationary at level. The variables are climate indicators coefficient of variation of temperature and precipitation. The calculated t-value6.32226and6.43163]orCV oftemperatureandprecipitationrespectivelyislessthanthe1%criticalvalue.Hence,wehave sufficientevidencetorejectournullhypothesisstatingthereisaunitroot.Thesameresulthasbeenexhibitedbytheintercept andtrendmodel.Then,forthosevariables,aunitrootisobservedanADFhasbeenrunontheirfirstdifferencebothusing the intercept term only and intercept & trend term models. Before regression of the model is executed both dependent and independent variables have been checked for the presence of unit root. The stationary test is performed using augmented Dickey fuller and Phillips-Perron testes. One of the requirements of these tests is to find the optimal length of the lagged variables.Hence,heretheoptimallaglengthisshownaccordingtotheinformationcriteriaofAIC,theHQIC,andSBIC.
Variable
Agriculturegrossoutputperkm2oflandinmetrictone 5.37439[1]
Annualaveragetemperature -6.32226[4]
Annualaverageprecipitation 6.43163[1]
Fertilizerusedperkm2ofland 6.14355[2]
Pesticidesusedperkm2ofland 14.5929[4]
Laboremploymentperkm2land 1.80075[4]
AnimalStockperkm2ofland
6.73839[1]
International Research Journal of Engineering and Technology (IRJET) e-ISSN:2395-0056
Volume: 11 Issue: 02 | Feb 2024 www.irjet.net p-ISSN:2395-0072
As shown in Table 4 the results of the Augmented Dickey-Fuller (ADF) and Phillips-Perron unit root tests have provided valuableinsights intothestationarity properties of the variablesconsideredin the study.Theconfirmationthatall variables arestationaryafterafirstdifferenceiscrucialforconductingatime-seriesanalysis,particularlyinthecontextofestimatingan AutoregressiveDistributedLag(ARDL)model.Herearesomekeypointstofurtherdiscusstheimplicationsofthestationarity resultsand thesuitability of using anARDL model: - Thestationarity of a time seriesis essential for ensuringthe reliability andvalidityofstatisticalanalyses,suchasregressionmodels.Astationarytimeserieshasaconstantmeanandvarianceover time,makingiteasiertomodelandinterprettherelationshipsbetweenvariablesaccurately.Inthiscase,theADFandPhillipsPerrontestshaveindicatedthatthevariablesinconsiderationexhibitstationaritypropertieseitheratthelevelorafter afirst difference. The concept of order of integration (I) refers to the number of differencing operations required to make a nonstationarytimeseriesstationary.Aserieswithanorderofzero(I(0))isconsideredstationaryatthelevel,whileaserieswith an order of one (I(1)) requires one difference to achieve stationarity. In this study, the log of coefficient of temperature and precipitation variables are found to be I(0), indicating they are stationary at the level, while the other variables are I(1), requiring one difference for stationarity. The ARDL model is a popular econometric technique used to analyze relationships between variables in a time series framework. It is particularly well-suited for situations where both the dependent and independentvariablesareintegratedindifferentorders(i.e.,amixofI(0)andI(1)variables).Giventhatthevariablesinyour studyexhibiteitherI(0)orI(1)properties,theARDLmodelisanappropriatechoiceforestimatingtherelationshipsbetween agriculturalproductivityanditsdeterminants.OneofthekeyadvantagesoftheARDLmodelisitsflexibilityinaccommodating mixedordersofintegrationamongvariables.Byallowingforcointegrationanderrorcorrectionmechanisms,theARDLmodel can capture both short-term dynamics and long-term relationships between variables. This makes it a valuable tool for analyzing complex relationships in economic and social research, such as the impact of climate variability on agricultural productivity in Ethiopia. The stationarity results and the choice of the ARDL model have important implications for policy formulation and decision-making in the context of agricultural development. By using a robust econometric approach like ARDL, policymakers can better understand the causal relationships between climate variables, agricultural inputs, and productivity outcomes. This knowledge can inform targeted interventions, resource allocation, and adaptation strategies to enhanceagriculturalresilienceandsustainabilityinthefaceofclimatechange. Inconclusion,thestationarityresultsobtained from the ADF and Phillips-Perron tests confirm the suitability of employing an ARDL model to analyze the relationships between climate variables, agricultural inputs, and productivity in Ethiopia. By leveraging the strengths of the ARDL framework,researcherscangainvaluableinsightsintothedynamicsofagriculturalsystemsandinformevidence-basedpolicy decisionstopromotefoodsecurity,environmentalsustainability,andeconomicdevelopmentintheagriculturalsector.
International Research Journal of Engineering and Technology (IRJET) e-ISSN:2395-0056
Volume: 11 Issue: 02 | Feb 2024 www.irjet.net p-ISSN:2395-0072
ThecorrelationTable5Providesvaluableinsightsintotherelationshipbetweenagriculturalproductivityandvariousfactors. Thepositivecorrelationbetweenagriculturalproductivityandannualtemperature,annualprecipitation,totalfertilizerused, pesticide used, and total number of livestock suggests that an increase in these factors leads to an increase in agricultural productivity.Thismakesintuitivesenseasfavorableweatherconditions,adequateuseofinputslikefertilizerandpesticides, andahighernumberoflivestock canallcontributetohigheragriculturaloutput.Ontheotherhand,thenegativecorrelation betweenagriculturalproductivityandtheamountoflaborengagedinagricultureisaninterestingfinding.Thissuggeststhat astheamountoflaborincreases,agriculturalproductivitydecreases.Thiscouldbeduetovariousfactorssuchasinefficiencies in labor utilization, lack of mechanization, or even diminishing returns to labor in certain agricultural activities. The significancelevelindicatedbytheasterisk(*)isimportantasitshowsthattherelationshipsobservedinthecorrelationtable arestatisticallysignificantata95%confidencelevel.Thismeansthatthereisahighprobabilitythattheobservedcorrelations arenotduetorandomchance.Overall,thecorrelationtableprovidesvaluableinformationforpolicymakers,researchers,and practitioners in the agriculture sector. It highlights the importance of factors like climate conditions, input usage, livestock management, and labor efficiency in influencing agricultural productivity. Further analysis and research can help in understandingtheserelationshipsbetterandformulatingstrategiestoenhanceagriculturalproductivitysustainably
Table 5 Correlationcoefficient
International Research Journal of Engineering and Technology (IRJET) e-ISSN:2395-0056
Volume: 11 Issue: 02 | Feb 2024 www.irjet.net p-ISSN:2395-0072
The findings from Table 6 highlight the significant impact of climate variability on agricultural productivity in the long run. Specifically, the positive effects of the log of coefficient of variation of temperature (LN_CVT) and the log of coefficient of variationofprecipitation(LN_CVP)onagriculturalproductivityindicatethatamoredynamicandvariableclimatecanbenefit agricultural output. Let's delve deeper into the implications of these results: The positive impact of temperature and precipitation variability on agricultural productivity suggests that a certain level of variability in these climatic factors can stimulate crop growth and enhance overall productivity. Fluctuations in temperature and precipitation can provide the necessaryconditionsforoptimalplantgrowthanddevelopment,leadingtohigheryields.
Agricultural systems that are resilient to climate variability, as indicated by the positive coefficients of LN_CVT and LN_CVP, are better equipped to adapt to changing environmental conditions. This resilience allows farmers to capitalize on favorable weatherpatternsandmitigatethenegativeimpactsofextremeweatherevents,ultimatelyimprovingagriculturalproductivity over the long term. The estimated percentage increase in agricultural productivity associated with a one-percentage-point increaseinthecoefficientofvariationoftemperature(3.84%)andprecipitation(0.48%)underscoresthesignificantinfluence ofclimatevariabilityonlandproductivity.Theseresultssuggestthatembracingandmanaging climatevariabilitycanleadto tangibleimprovementsinagriculturaloutput.Farmersandpolicymakerscanleveragethesefindingstoimplementsustainable agriculturalpracticesthatenhanceresiliencetoclimatevariability.Strategiessuchascropdiversification,watermanagement, and soil conservation can help mitigate the risks associated with variable climate conditions and optimize agricultural productivity in the long run. In conclusion, the positive impact of temperature and precipitation variability on agricultural productivityunderscorestheimportanceofadaptivestrategiesinagriculture.Byembracingandmanagingclimatevariability, stakeholders can harness the benefits of a dynamic climate system to improve land productivity sustainably. Implementing resilientagriculturalpracticesthatconsiderclimatevariabilitycancontributetolong-termagriculturalproductivitygainsand ensurefoodsecurityinthefaceofchangingenvironmentalconditions.
Table 6. Long-runrepresentationresultsoftheARDLmodel
International Research Journal of Engineering and Technology (IRJET) e-ISSN:2395-0056
Volume: 11 Issue: 02 | Feb 2024 www.irjet.net p-ISSN:2395-0072
Theagriculturaloutputandruralincomesofaneconomyareexpectedtobeadverselyaffectedbyclimatechange.Toreduce the possible losses in agricultural productivity, rational adaptation is therefore pursued. This study's primary goal was to evaluatehowEthiopia'sagriculturaloutputwasaffectedbyclimatechangebetween1991and2021.Accordingtothefindings of the ARDL approach, there is a long-term correlation between agricultural production and the coefficient of variation of temperature. Specifically, an increase of 3.84% in the coefficient of variation of temperature over time will increase the agricultural productivity of land. Similarly, a 0.48% increase in the coefficient of variation of precipitation will raise the agriculturalproductionoftheareawhereastheotherthingsareconstant.Theannualaveragetemperatureandprecipitation, whicharethestudy'sprimaryvariablesandareemployedasindicatorsofclimatechange,havemeanvaluesof23.374 ℃and 86.938 mm, respectively. Furthermore, the lowest recorded temperature during the period of 1991 was 22.92℃, while the highestrecordedannualaveragetemperaturevalueduringthe2013–2014periodwas23.67℃.Thevariables'analysisresults include temperature, precipitation, animal population, pesticides, and fertilizer have a positive correlation with agricultural output. Conversely, there is a negative correlation between agricultural productivity and employment in the agricultural sector.Basedonthefindingsofthecurrentstudy,itisrecommendedthatpossiblestepsshouldbetakenbytheGovernmentof Ethiopia to adopt new policies and modern technology regarding accurate weather forecasting, and preventive and direct actionsarealsoneededtodevelopandunderpinanimprovedirrigationsystem.Enhancementsinfarmlandinfrastructureare necessarytoeffectivelytacklethechallengesposedbyfutureclimatechange. Inconclusion,thestudyhighlightstheneedfor immediate action to address the adverse effects of climate change on agricultural productivity in Ethiopia. By implementing targeted policies, investing in modern technologies, and enhancing human capital development, stakeholders can build resilience in the agricultural sector and ensure sustainable food production amidst changing environmental conditions. Recognizing the complex interplay between climate change, agriculture, and rural livelihoods is essential for designing effectiveadaptationstrategiesthatprotectfarmingcommunitiesandpromotelong-termagriculturalsustainability.
Declaration
Author contributions A.M.;conceptualizedtheproject;curatedthedata; M.M,conductedtheformulaanalysis;A.M.;A.D.,and M.M.;developed the methodology,andwhileA.Mwrote theoriginal draftall authors participated inthesubsequencereview andeditingprocess.
Finding: Notapplicable
Iconfirm thatthedata includedhere isaccurate andcomprehensive.I hereby certifythatthis work hasnot beenpreviously publishedandhasnotbeensubmittedforpublicationtoanyjournal.
Conflict of interest: Theauthorsdeclarenocompetinginterests.
Data availability: Themanuscriptincludesallthedataused.
Informed consent: Notapplicable
Acknowledgments
Thisresearchistheoutput ofthe jointeffortofmanypeopleotherthan the researcher.Hence,Iamindebtedtothank all of them who joined their hands to the realization of this research. First and foremost, I would like to thank “Almighty God”, withoutHisblessingsthispublicationworkwouldnothavebeencompletedsuccessfully.IwouldliketothanktheMinistryof Commerce,People'sREPUBLICOFCHINA(MOFCOM),andTongjiUniversityforprovidingmewithanopportunitytoaddmy knowledgeandskillsandgivingmemuchsupportandguidance.IamalsothankfultoalltheProfessors,andteachingstaffof theCollegeofEnvironmental Science andEngineering whohelped meincompletingmy Studies.Also,I would liketo extend mysincereesteemtoall staffoftheInstitute ofEnvironmentforSustainable Development(IESD)the International Students Office(ISO),andTongjiUniversityfortheirtimelysupport.
International Research Journal of Engineering and Technology (IRJET) e-ISSN:2395-0056
Volume: 11 Issue: 02 | Feb 2024 www.irjet.net p-ISSN:2395-0072
References
[1] Wang, J.-x., J.-k. Huang, and J. Yang, Overview of Impacts of Climate Change and Adaptation in China's Agriculture. JournalofIntegrativeAgriculture,2014. 13(1):p.1-17.
[2] Wheeler,T.andJ.vonBraun, Climate Change Impacts on Global Food Security. Science(NewYork,N.Y.),2013. 341:p. 508-13.
[3] Chandio, A.A., et al., Short and long-run impacts of climate change on agriculture: an empirical evidence from China. InternationalJournalofClimateChangeStrategiesandManagement,2020. 12(2):p.201-221.
[4] Gamage, A., et al., Role of organic farming for achieving sustainability in agriculture. Farming System, 2023. 1(1): p. 100005.
[5] Xie, W., et al., Climate change impacts on China's agriculture: The responses from market and trade. China Economic Review,2020. 62:p.101256.
[6] Fadina, A.M.R. and D. Barjolle, Farmers’ Adaptation Strategies to Climate Change and Their Implications in the Zou Department of South Benin. Environments,2018. 5(1):p.15.
[7] Resnik,D.B., Environmental justice, and climate change policies. Bioethics,2022. 36(7):p.735-741.
[8] Lipper,L.,etal., Climate-smart agriculture for food security. NatureClimateChange,2014. 4(12):p.1068-1072.
[9] Ali, A. and O. Erenstein, Assessing farmer use of climate change adaptation practices and impacts on food security and poverty in Pakistan. ClimateRiskManagement,2017. 16:p.183-194.
[10] Smit,B.andM.W. Skinner, Adaptation options in agriculture to climate change: a typology. MitigationandAdaptation StrategiesforGlobalChange,2002. 7(1):p.85-114.
[11] Ledda, A., et al., Integrating adaptation to climate change in regional plans and programs: The role of strategic environmental assessment. EnvironmentalImpactAssessmentReview,2021. 91:p.106655.
[12] Getahun,A.B.,etal., Determinants of climate variability adaptation strategies: A case of Itang Special District, Gambella Region, Ethiopia. ClimateServices,2021. 23:p.100245.
[13] Gornall, J., et al., Implications of climate change for agricultural productivity in the early twenty-first century. Philos TransRSocLondBBiolSci,2010. 365(1554):p.2973-89.
[14] Akoteyon, I.S., Factors influencing the occurrence of flooding, risk and management strategies in Lagos, Nigeria. SustainableWaterResourcesManagement,2022. 8(3):p.68.
[15] Huang, J., Climate Change and Agriculture: Impact and Adaptation. Journal of Integrative Agriculture, 2014. 13: pp. 657–659.
[16] Saqib, S.E., et al., An empirical assessment of farmers' risk attitudes in flood-prone areas of Pakistan. International JournalofDisasterRiskReduction,2016. 18:p.107-114.
[17] Ullah, R., G.P. Shivakoti, and G. Ali, Factors affecting farmers’ risk attitude and perceptions: The case of Khyber Pakhtunkhwa, Pakistan. InternationalJournalofDisasterRiskReduction,2015. 13:pp.151-157.
[18] Mubiru, D.N., etal., Climate trends, risks and coping strategies in smallholder farming systems in Uganda. ClimateRisk Management,2018. 22:p.4-21.
[19] Gedefaw,M., Assessment of changes in climate extremes of temperature over Ethiopia. CogentEngineering,2023. 10(1): p.2178117.
International Research Journal of Engineering and Technology (IRJET) e-ISSN:2395-0056
Volume: 11 Issue: 02 | Feb 2024 www.irjet.net p-ISSN:2395-0072
[20] Gemeda, D.O., D. Korecha, and W. Garedew, Monitoring climate extremes using standardized evapotranspiration index and future projection of rainfall and temperature in the wettest parts of southwest Ethiopia. EnvironmentalChallenges, 2022. 7:p.100517.
[21] Skendžić,S.,etal., The Impact of Climate Change on Agricultural Insect Pests. Insects,2021. 12(5).
[22] Gashaw, T., et al., Local and regional climate trends and variabilities in Ethiopia: Implications for climate change adaptations. EnvironmentalChallenges,2023. 13:p.100794.
[23] Kong, X., et al., Climate warming extends the effective growth period of winter wheat and increases the grain protein content. AgriculturalandForestMeteorology,2023. 336:p.109477.
[24] Jin, N., et al., Spatial and temporal patterns of agricultural drought in China during 1960–2020 characterized by using the crop water deficit Abnormal Index. JournalofHydrology,2023. 627:p.130454.
[25] Zhang, Q., et al., Spatial-temporal changes of precipitation structure across the Pearl River basin, China. Journal of Hydrology,2012. s 440–441:p.113–122.
[26] Zhou, K., et al., Spatial and temporal evolution of drought characteristics across the Yellow River basin. Ecological Indicators,2021. 131:p.108207.
[27] Simane,B.,etal., Review of Climate Change and Health in Ethiopia: Status and Gap Analysis. EthiopJHealthDev,2016. 30(1SpecIss):p.28-41.
[28] Rettie, F.M., et al., Climate change impact on wheat and maize growth in Ethiopia: A multi-model uncertainty analysis. PLoSOne,2022. 17(1):p.e0262951.
[29] Evangelista, P.H., N.E. Young, and J.D. Burnett, How will climate change spatially affect agriculture production in Ethiopia? Case studies of important cereal crops. ClimaticChange,2013. 119:p.855-873.