

A Review Paper on Travel Time Reliability in Public Transportation
Sonali Bharti1 , Tarun Narnaure 2
1 M. Tech Student, Department of Civil Engineering and Applied Mechanics, Shri G.S. Institute of Technology and Science, Indore (M.P.), Pincode-452003
2 Assistant Professor2, Department of Civil Engineering and Applied Mechanics, Shri G.S. Institute of Technology and Science, Indore (M.P.), Pincode-452003
Abstract - The challenges and dynamics associated with public transportation reliability in India, considering the complexities of diversified metropolitan traffic patterns and the increasing demand for automobiles. The study focuses on the urbanization trends in major Indian cities, emphasizing thecrucialroleofpublictransitinconnectingbothurbanand ruralareas.Traveltimevariabilityisidentifiedasasignificant factoraffectingpublictransportationreliability,influencedby dynamic elements such as weather conditions, traffic fluctuations, and delays. Passengers' experiences and perceptions, including waiting and transfer times, are recognizedaskeycontributorstotransitnetworkconnectivity and system performance. The term travel time reliability is defined as a measure of the expected range in travel time, providing a quantitative indicator of predictability. Various methods, including the 90th percentile time, planning time index, buffer index, buffer time, total travel time, and statistical calculations such as delay and journey time, are discussed as crucial metrics for assessing reliability in heterogeneous traffic. The analysis of travel time data collected from diverse cities; a suggested methodology is proposed for improving travel time reliability in public transportation.TheimportanceofIntelligentTransportation System data, such as GPS data and ticketing data, is highlighted, emphasizing the necessity of incorporating user feedback for Travel Time Reliability (TTR) improvement. Factors influencing public transportation reliability were explored, with recommendations made for improving efficiency, reducing delays, and enhancing overall reliability. Models for predicting travel times in bus networks were developed, often based on regression analysis and machine learning techniques, to provide accurate predictions and insights for optimizing bus movements, resource allocation, and service planning. The research papers collectively contribute to advancing the understanding of travel time reliability in public transportation.
Key Words: Traveltimereliability,Variability,Routelevel attributes,heterogenoustraffic,Publictransit
1.INTRODUCTION
India's urban population is growing at a pace of 3% annually,withanemphasismostlyonkeypoliticalcenters. [18]. Transportation is essential for efficient and socially equitable transit, and assessing citizens' accessibility to
public transportation services is crucial for identifying population disparities and developing policies to improve passengerservicequality[20].PublictransportationinIndia has considerable hurdles as a result of the country's diversified metropolitan traffic patterns and rising automobile demand. City buses are crucial in public transport,servingasthebackbonesofconnectivityinsome cities. India ranks 8th in total vehicle usage across 192 countries,with44.9millionvehicles,followedbytheUSAand China.Thenationcurrentlyholdsthethirdpositionglobally in terms of the fleet strength of buses and motor coaches, trailingbehindIndonesiaandChina.Thesustainedgrowthof theeconomyhasledtoanexpansionofthetransportation sector; however, there has been a notable decrease in its percentageshareinIndia'sGrossDomesticProduct(GDP), decliningfrom49.9%inthefiscalyear2015-16to4.59%in the fiscal year 2019-20. Specifically, the road transport segment singularly contributes 3.06% to the Gross Value Added(GVA),whiletheentiretransportsectorcollectively contributes4.59%atthenationallevelduringthefiscalyear 2019-20.AsofMarch31,2020,vehiclesnewlyregisteredin India were categorized, revealing that 8.4% fell within specificcategories.[19].Reliabilityinpublictransportationis acrucialfactorinbothpublicandprivatesectors,connecting differentneighborhood’s,ruralareas,orkeylocations.City buses'utilityanddesirabilityareinfluencedbytheirregular arrival times, but passengers often worry about their dependability due to unexpected travel times, weather conditions, traffic congestion, and driver and passenger behavior.Weatherconditions,suchasrainorsnow,canalso affecttraveltimes,whilecitybusesoperatingonurbanroads contribute to traffic difficulties due to their size and the responsibilityoftraveler[15].
1.1. Travel Time Reliability
Thereliabilityofthepublictransportationsystemisoften defined as one minus the probability of failure. [2][3]. USDOT’s definition of reliability, which defines it as “The transportationsystem'scertaintyandpredictabilityintravel times is a crucial aspect to consider” [1], According to the agency,reliabilityislinkedtotheconsistencyofbusservice performance. [21]. Travel time reliability refers to the consistencyanddependabilityofthedurationrequiredfora journeyorthetimetakentotraverseaspecificroadsection, experiencedacrossvarioustimesofthedayanddaysofthe
International Research Journal of Engineering and Technology (IRJET) e-ISSN: 2395-0056 Volume: 11 Issue: 1 | Jan 2024 www.irjet.net p-ISSN: 2395-0072 © 2024, IRJET | Impact Factor value: 8.226 | ISO 9001:2008 Certified Journal | Page491
***
week.Thismetricisquantifiedbytheextratime,knownas timecushionorbuffer,thatdriversmustallocatetoaccount forunforeseendelays.Commuters,transitriders,shippers, andotherroadusersfindtraveltimereliabilitycrucialasit enablesthemtomakeinformeddecisionsaboutmanaging theirtimeeffectively.[1].
Sources: RTYB_Publication_2019_20. (n.d.).
1.2. Travel Time Reliability Measures
Therearefourmeasuresusedtodeterminethereliability ofpublictransport:FrequencyConsistencyMeasures,Wait Duration Measures, Transfer Duration Measures, and Trip Duration Measures. In which travel time metrics are consideredtoanalysesthereliability.Thefourrecommended measuresareoutlinedbelow:90thor95thpercentiletravel time, BTI, PTI, BT, PT and TTT the frequency with which congestionsurpassesseveralpredictedthresholds.
1.2.1 90th Percentile Time (PT)
Planningtime,alsoreferredtoasthe95thpercentileof traveltime,indicatesthepotentialseverityofatransittravel delay.Utilizedasametric,planningtimeservesasvaluable informationforpassengers.Thedrawbackofthismeasureis thatitisdifficulttocomparebetweenjourneysbecausemost tripswillvaryinlength.Itislikewisechallengingtoaverage outrouteortriptraveltimesforanentirecityorsubarea.[2], [3],[9].
PlanningTime=PlanningTimeIndex×AverageTravelTime …(i)
1.2.2 Planning Time Index (PTI)
The entire duration a road user needs to allocate to ensureon-timearrival for95percentoftrips.[1].Inother terms, we can articulate the overall time a traveler must strategizetoguaranteepunctualarrival,encompassingbuffer time and the mean travel duration. Ultimately, the delay incurred by utilizing public transportation serves as an illustrationofreliability.Asthedelaylengthens,sodoesthe dependability[18],[9][4],[27].
Planningtimeindex=(90th or95th Percentileofmeantravel time/MeanTravelTime)*100 ...(ii)
1.2.3 Buffer Index (BI)
Road users mustallocate additional time to assure ontime arrival in 95 percent of trips, which is equivalent to being late for work once a month. The buffer index is calculated as a proportion of the average trip time. [1],[14],[18],[27],[28],[4].
Planningtimeindex=(90thor95thPercentileofmeanJourneytime/ MeanJourneyTime)*100 .(iii)
1.2.4 Buffer Time (BT)
Buffertimemeasurestheextratimethatatravelermustadd totheaveragetraveltimewhenplanningforatrip[9],[28].
BufferTime=BufferIndex×AverageTravelTime ...(iv)
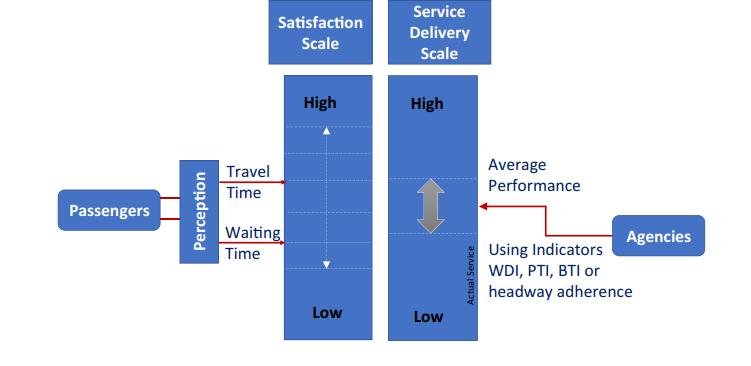
Figure 2: Representtheviewpointsofpassengersand agenciesregardingtraveltimereliability
Source: https://doi.org/10.1007/s13177-019-00195-0
1.3. Total Travel Time (TTT)
The total travel time encompasses the maximum durations that a traveler might spend to complete a trip. Thesedurationsaredeterminedbyfactorssuch,aswaitingin queuestopurchaseticketswaitingforbusesatstationsor terminalsthetimetakenbybusesatstops(includingtraffic lightsandpedestriancrossings),betweenterminals,stations and terminals well as the time spent onboarding and offboarding passengers. These equation presents a representationthatdescribesthisphenomenonunderstudy [9].
TTT=TQ+TW+TI*(NS-1)+TS*NI+TO*(NS-1) …(v)
International Research Journal of Engineering and Technology (IRJET) e-ISSN: 2395-0056 Volume: 11 Issue: 1 | Jan 2024 www.irjet.net p-ISSN: 2395-0072 © 2024, IRJET | Impact Factor value: 8.226 | ISO 9001:2008 Certified Journal | Page492
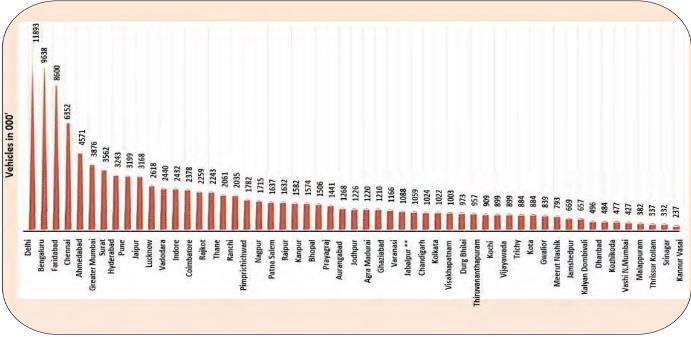
Figure 1: AggregateMotorVehicleRegistrationsin millionPlusCitiesason31stMarch,2020(inmillion)
The following are the definitions of the imbedded parametersandvariablesinequation
TTT = TotalTraveltime,
TQ = Waitingtimeforticketinginaqueue
TW = Busstation/terminalwaitingtime
TI = Inter-nodetransittime
TS = Stoppagedurationatintersections.
TO = Passengerboardingandalightingtime
NS = Stationcountsalongadesignatedroute
NI = Intersectioncountalongadesignatedroute
Sources: https://ops.fhwa.dot.gov/publications/tt_reliability.com
2. Literature Review
Numerousstudieshaveexploredtraveltimereliability and variability of public transit for heterogeneous traffic, usingmethodslikeGEVdistribution,Burrdistribution,andkstest.Severalstudiesfocusonreliabilitymetricssuchasthe Timecushionindicator,Timetableadherence,andcumulative travel time in order to assess the dependability of public transportation.
BalkrishanPanwaretal(2018).emphasizethegrowingrole ofadvancedtechnologiesintransportationengineering.They underscore the potential for information systems, automation, and telecommunications to revolutionize transportation systems, enhancing efficiency, safety, and service reliability. The adoption of these technologies is
crucial for the future growth and development of transportationnetworks.EnginPekeletal(2017).usecrash databasestopredicttraveltimereliabilityanditsimpacton crash injury severity. Their research identifies significant factors contributing to the severity of accidents, such as alcoholanddrugimpairmentandwork-zonepresence.These findingscaninformsafetymeasuresandtrafficmanagement strategies. Joanna Rymarz et al (2015). conduct a comparative analysis of the reliability of different bus systems, shedding light on the reliability of specific bus brands and their various structural systems. This type of analysiscanguidetransportationagenciesinselectingand maintaining their bus fleets. Krystine Birr et al (2014). emphasizethattheaveragespeedofpublictransportvehicles is influenced by various external factors. Their research underscores the complexity of estimating public transport speed and travel time due to a multitude of contributing factors.Theyadvocatefortheneedtocharacterizenetwork sectionsintermsofinfrastructureandtrafficorganizationto builddetailedmodelsandimprovetransportationefficiency. LingxiangZhuetal(2022).proposeatraveltimeprediction algorithm that achieves high accuracy, particularly in the contextofaspecificbuslineinGuangzhou.Whilethemodel showspromise,thereisroomforfurtherresearchtoimprove itsgeneralizabilitybyconsideringmorediversebuslinesand routes.M.M.Harshaetal(2022).shedlightonthevariability in public transit travel times. Their use of probability distributions,especiallytheGEVdistribution,provestobea valuable tool for modeling transit travel time variability across different temporal and spatial scales. This provides insightsfortransportationplanningandmanagement.Many of these studies highlight the importance of utilizing advanceddatasources,suchasGPSdata,smartcarddata,and real-timetracking,toenhancetheaccuracyandreliabilityof traveltimeestimatesandreliabilitymeasures.Thisemphasis on data-driven decision-making is critical for modern transportation planning and management. Mukta Ranjan Singha et al (2013). explore the potential of mobile phone networksforurbantrafficmanagementanddatacollection, particularly for optimizing bus movements and alleviating congestion. This approach, with its minimal infrastructure developmentcosts, offers a cost-effective means for traffic managementanddataanalysisinurbanareas.Li-Minhetal (2014). introduce the concept of Public Transport Travel Time (PTTV) and outline a comprehensive approach for modeling and monitoring PTTV. Their study identifies the lognormal distribution as a suitable descriptor for PTTV, providing insights for optimizing recovery time and reliability in public transportation. It also calls for future research to delve deeper into factors influencing PTTV. Punam Baral et al(2015)., explore the factors affecting operational efficiency and travel time variation in public transportation routes. They identify issues such as intersectiondelays,farecollection,andbusstopplacementas crucialdeterminantsofreliabilityandefficiency.Pagidimarry Gopietal.examinetraveltimereliabilityinurbancorridors in New Delhi, demonstrating the significant variability in
International Research Journal of Engineering and Technology (IRJET) e-ISSN: 2395-0056 Volume: 11 Issue: 1 | Jan 2024 www.irjet.net p-ISSN: 2395-0072 © 2024, IRJET | Impact Factor value: 8.226 | ISO 9001:2008 Certified Journal | Page493
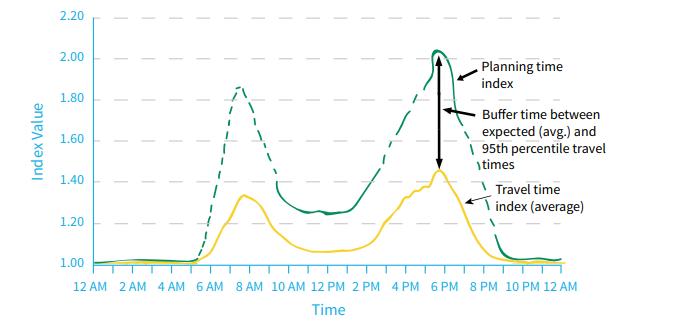
Figure 3: RelationshipBetweenTotaltraveltimeindex, BuffertimeindexandPlanningtimeIndex
traveltimesduringworkingandnon-workinghours.Their study highlights the importance of measuring and understanding travel time reliability to aid travelers in planning for on-time arrival, and it demonstrates the application of reliability indices like PTI and BTI in transportation studies [18]. These insights can guide operationalimprovementsinpublictransitRenzoMassobrio (2022),LupingZhi(2022),andZhuangDai(2019)present various models and methodologies for estimating travel times in public transportation networks. These models leverage a wide range of data sources, including infrastructure,schedules,andGPSdata.Theyoffervaluable tools for transportation planners and policymakers to enhancetheaccuracyoftraveltimepredictions,whichcan leadtobetterserviceplanningandresourceallocation.Spela Verovsek et al. (2022) highlights the importance of integrating travel time indicators into National Safety Administration standards. This integration is crucial for addressing congestion and sustainability concerns in transportation systems. Proper observation periods and robust statistical methods are necessary for obtaining reliable estimates of traffic situations on strategic routes. Several studies, such as those by Sakdirat Kaewunruen (2021), Justine Kira (2022), and Ankit Kathuria (2022), emphasize the significance of identifying factors that contribute to travel time delays in public transportation. Thesefactorsincludestationdwelltimes,ticketingprocesses, andvariationsindemandlevelsduringdifferenttimesofthe day and week. Understanding these factors is crucial for improving the efficiency and reliability of public transportationsystems.Severalarticles,includingMahmoud Owais (2021), Akhilesh Cherapunji (2020), and Ankit Kathuria(2020),delveintotheconceptofreliabilityinpublic transportationsystems.TheyintroducemeasureslikePTI,BI, andRBItoassesstraveltimereliability,andthesemeasures can help in evaluating performance and making improvements.Theresultsindicatethatreliabilitycanvary with factors such as route length, day of the week, and peak/off-peakhours.Severalstudies,suchasZhenChenetal. (2020),F.Zheng,XiaoboLiu,etal.(2017),andZhen-LiangMa et al.(2019), concentrate on developing models to assess traveltimereliabilityandvariability.Theyemploystatistical distributions, network-level models, and recurrent congestionindicestocharacterizeandanalyzethevariability in travel times along transportation corridors. This understandingisfundamentalforimprovingserviceplanning andresourceallocation.SaikatDebetal(2018).analyzethe factorsaffectingusers'perceptionsofpublictransportation services,revealingvariationsacrossdifferentgroupsbased on income, gender, employment status, and vehicle ownership.Understandingthesevariationscanhelptransit agencies tailor their services to better meet the needs of specific user groups, improving overall satisfaction and reliabilitysystems.TanzinaAfrin's(2020)studyaddresses theglobalchallengeoftrafficcongestion.Whilethereisno one-size-fits-allsolutiontothisissue,thepaperemphasizes theimportanceofcategorizingcongestionandimplementing
a combination of strategies tailored to specific contexts. Effective congestion mitigation measures involve a comprehensiveunderstandingoftheproblemandtheuseof real-timetrafficdataforevaluationanddecision-making[24]. YaserHawasetal.contributetothefieldbyfocusingonbus network operationsandintroducingmodelsforpredicting traveltimes.Thesemodels,whilepromising,requirereal-life validation through data collection and comparison with actualbustriptimes.Theresearchlaysthegroundworkfor moreaccuratemodelingandpredictionoftraveltimeswithin bus networks. Zixu Zhuanget al.(2022) introduce a novel metric for assessing bus travel time reliability, which accountsfordwelltimeandon-boardtraveltime.Thestudy underlinestheimpactoffactorslikeweatherconditionsand servicefrequencyontraveltimereliability,emphasizingthe importanceofefficientserviceschedulinginimprovingthe passengerexperience.
3. Discussion
Thestudiescollectivelycontributetotheadvancementof transportationengineeringandmanagementbyaddressing variousaspectsoftraveltimereliability,safety,andefficiency in public transportation systems. Panwar et al. (2015) highlightthetransformativeroleofadvancedtechnologies, emphasizing information systems, automation, and telecommunications, with significant implications for enhancing transportation network efficiency and safety. EnginPekel etal.(2017) utilizecrashdatabasestopredict travel time reliability's impact on crash injury severity, identifying crucial factors such as alcohol and drug impairmentandwork-zonepresence,providinginsightsfor safetymeasuresandtrafficmanagementstrategies.Rymarz etal.'scomparativeanalysisofbussystemreliabilityoffers valuable information on the performance of different bus brands and structural systems, aiding transportation agenciesinfleetselectionandmaintenancedecisions.Birret al.emphasizethecomplexityofestimatingpublictransport speed and travel time due to various external factors, advocating for the characterization of network sections to enhancedetailedmodelingandtransportationefficiency.Zhu etal.'straveltimepredictionalgorithmshowcasespromise, particularlyinaspecificbuslineinGuangzhou,prompting theneedforfurtherresearchtoenhanceitsgeneralizability across diverse bus lines and routes. Harsha et al.'s use of probability distributions, specifically the GEV distribution, provesvaluableformodelingtransittraveltimevariability, providing insights into temporal and spatial variations essential for transportation planning and management Singha et al.'s exploration of mobile phone networks for urban traffic management highlights a cost-effective approach for optimizing bus movements and alleviating congestion, showcasing the potential of minimal infrastructuredevelopmentforeffectivetrafficmanagement in urban areas . Li-Minh et al.'s introduction of Public Transport Travel Time (PTTV) and its comprehensive approachformodelingandmonitoring,usingthelognormal
International Research Journal of Engineering and Technology (IRJET) e-ISSN: 2395-0056 Volume: 11 Issue: 1 | Jan 2024 www.irjet.net p-ISSN: 2395-0072 © 2024, IRJET | Impact Factor value: 8.226 | ISO 9001:2008 Certified Journal | Page494
distribution as a descriptor, provides valuable insights for optimizing recovery time and reliability in public transportation.Baraletal.'sexaminationoffactorsaffecting operational efficiency and travel time variation in public transportation routes underscores the importance of addressingissuessuchasintersectiondelays,farecollection, and bus stop placement for improved reliability and efficiency.Gopietal.'sexaminationoftraveltimereliabilityin New Delhi urban corridors demonstrates the significant variability during working and non-working hours, emphasizingtheimportanceofmeasuringandunderstanding traveltimereliability,applyingreliabilityindiceslikePTIand BTI. Overall, these studies underscore the critical role of advanced data sources, such as GPS data and real-time tracking,inenhancingtheaccuracyandreliabilityoftravel time estimates and reliability measures, emphasizing the importance of data-driven decision-making in modern transportationplanningandmanagement.
4. Conclusion
The studyprovidesimportant new perspectives on the study and forecasting of journey times under various transportationconditions.Theinvestigationrecognizedthe importance of incorporating travel time reliability measurements into the evaluation of urban road performance, highlighting a departure from traditional metrics.Thefollowingconclusionsaredrawnfromexisting literature.
1. Toincreasetheaccuracyandreliabilityofjourneytime models, they underline the necessity for precise data gathering,reliablestatisticaltechniques,andmorestudy. Planning, establishing policies, and improving operational aspects of both private automobiles and public transportation systems can benefit from these findings.
2. Thestudiesunderlinetheneedfordata-driven,contextspecificstrategiesanddrawattentiontothecomplexity oftraveltimechallenges.Withanemphasisonreliability, unpredictability, and user perceptions, they provide a complete examination of travel times in public transportationnetworks.
3. By offering several techniques and models to address these crucial aspects of transportation planning and administration,theyhelptoincreasetheefficacy,safety, andqualityofpublictransportationsystems.Theyalso provide approaches and strategies for dealing with various facets of transportation planning and administration,addingtoongoinginitiativestoraisethe effectiveness, security, and caliber of public transportationsystems.
4. This will aid in the identification of different factors influencingtraveltimereliabilityattheroute,segment, andcorridorlevels.
5. After studying Travel Time Reliability measure and statistical formulation and model, we can easily find journeytime,delayonroute,dwelltime,meanduration timeforheterogenoustrafficcondition.
6. Acomprehensiveawarenessofthefactorsthatinfluence thequalityofpublictransitservices,offeringavarietyof transportation outcomes such as safety, comfort, accessibility,anddependability(SaiketDeb,2018)
7. The study focuses on characterizing travel time distribution and reliability, providing critical insights into understanding and managing variability in transportation systems, thereby contributing to improved service planning and operational efficiency (ZhenChen,2020).
8. Thisemphasisbusroutetraveltimesandnetworktravel times enhances our comprehension of transit system dynamics, facilitating the development of models and strategies for optimizing travel times within bus networks(YaserHawas,2013)
9. Pre-journey waiting times, journey durations, and measuresrelatedtopublictransportationtraveltimes, offering valuable data for enhancing the passenger experienceandoptimizingtransitplanning.
REFERENCES
[1] Ankit Kathuria, Parida, M., & Sekhar, C. R. (2020). A Review of Service Reliability Measures for Public Transportation Systems. International Journal of Intelligent Transportation Systems Research, 18(2), 243–255.
https://doi.org/10.1007/s13177-019-00195-0
[2] Ankit Kathuria, Parida, M., & Chalumuri, R. S. (2020). Travel-Time Variability Analysis of Bus Rapid Transit System Using GPS Data. Journal of Transportation Engineering,PartA:Systems,146(6).
https://doi.org/10.1061/jtepbs.0000357
[3] Akhilesh Chepuri, Joshi, S., Arkatkar, S., Joshi, G., & Bhaskar, A. (2020). Development of new reliability measure for bus routes using trajectory data. TransportationLetters,12(6),363–374.
https://doi.org/10.1080/19427867.2019.1595356
[4] BalkrishanPanwar,M.,&Gill,S.(2018).IJCRTRIETS003| International Journal of Creative Research Thoughts (IJCRT)www.ijcrt.org|Page13AdvancedTechnologies UseinTransportationEngineering.www.ijcrt.org.
[5] DoesTravelTimeReliabilityMatter?
https://ops.fhwa.dot.gov/publications/tt_reliability.com
[6] EnginePekel,&SonerKara,S.(2017).ReviewPaper/ DerlemeMakalesiAComprehensiveReviewforArtificial
International Research Journal of Engineering and Technology (IRJET) e-ISSN: 2395-0056 Volume: 11 Issue: 1 | Jan 2024 www.irjet.net p-ISSN: 2395-0072 © 2024, IRJET | Impact Factor value: 8.226 | ISO 9001:2008 Certified Journal | Page495
NeuralNetworkApplicationtoPublicTransportation.In NatSci(Vol.35,Issue1)
[7] Fangfang Zheng, Liu, X., Zuylen, H. Van, Li, J., & Lu, C. (2017). Travel Time Reliability for Urban Networks: Modelling and Empirics. Journal of Advanced Transportation,2017.
https://doi.org/10.1155/2017/9147356
[8] Joanna Rymarz, Niewczas, A., & Stoklosa, J. (2015). Reliabilityevaluationofthecitytransportbusesunder actual conditions. Transport and Telecommunication, 16(4),259–266.https://doi.org/10.1515/ttj-2015-0023
[9] JustineKira,J.,&Mohamed,S.(2022).ModelingTravel TimewithTravelers’Experience.
https://doi.org/10.7176/MTM
[10] Kyrstine Birr, Jamroz, K., & Kustra, W. (2014). Travel time of public transport vehicles estimation. TransportationResearchProcedia,3,359–365.
https://doi.org/10.1016/j.trpro.2014.10.016
[11] Li-Minh Kieu, Bhaskar, A., & Chung, E. (2014). Public Transport Travel-Time Variability Definitions and Monitoring.
https://doi.org/10.1061/(ASCE)TE.1943.
[12] LingxiangZhu,Shu,S.,&Zou,L.(2022).XGBoost-Based Travel Time Prediction between Bus Stations and Analysis of Influencing Factors. Wireless CommunicationsandMobileComputing,2022.
https://doi.org/10.1155/2022/3504704
[13] LupingZhi,Zhou,X.,&Zhao,J.(2020).Vehiclerouting for dynamic road network based on travel time reliability.IEEEAccess,8,190596–190604.
https://doi.org/10.1109/ACCESS.2020.3030654
[14] M. M Harsha, & Mulangi, R. H. (2022). Probability distributionsanalysisoftravel timevariabilityforthe public transit system. International Journal of Transportation Science and Technology, 11(4), 790–803.
https://doi.org/10.1016/j.ijtst.2021.10.006
[15] MuktaRanjanSingha,&Kalita,B.(2013).Estimationof CityBusTravelersUsingGSMNetwork...×Congestion ControlofGuwahatiCityViewproject.InInternational Journal of Innovative Technology and Exploring Engineering(IJITEE)(Issue2).
https://www.researchgate.net/publication/267403153.
[16] Mahmud Owais,Ahmed,A.S.,Moussa,G.S.,&Khalil, A.A.(2021).Integratingundergroundlinedesignwith existing public transportation systems to increase transit network connectivity: Case study in Greater Cairo.ExpertSystemswithApplications,167. https://doi.org/10.1016/j.eswa.2020.114183
[17] PunamBuralShahi,Devkota,B.,Baral,P.,&Devkota,B. P. (2015). Variation in Travel Time of Public Transportation-Case Study of Micro Bus Routes in Kathmandu Road Accident Information Management System View project Construction industry research View project Variation in Travel Time of Public Transportation-CaseStudyofMicroBusRoutesinKathmandu.
https://www.researchgate.net/publication/351945230_Variation _in_Travel_Time_of_Public_Transportation_-
_Case_Study_of_Micro_Bus_Routes_in_Kathmandu
https://www.researchgate.net/publication/351945230
[18] Pagidimarry Gopi, P., Sachdeva, S. N., Bharati, A. K., & Professor, E.-A. (2014). Evaluation of Travel Time ReliabilityonUrbanArterial.
https://www.ijert.org/evaluation-of-travel-time-reliability-onurban-arterial
[19] RTYB_Publication_2019_20.(n.d.).https://morth.nic.in/sites /default/files/RTYB_Publication_2019_20%20(1).pdf.
[20] Renzo Massobrio, Hernández, D., & Hansz, M. (2022). Travel time estimation for public transportation systems.
https://doi.org/10.1007/978-3-030-96753-6_14
[21] Sakdirat Kaewunruen, Sresakoolchai, J., & Sun, H. (2021).Causalanalysisofbustraveltimereliabilityin Birmingham,UK.ResultsinEngineering,12 https://doi.org/10.1016/j.rineng.2021.100280
[22] Saiket Deb, & Ahmed, M. A. (2018). Variability of the Perception about Safety, Comfort, Accessibility and Reliability of City Bus Service across Different Users’ Groups.International Journal ofCivil Engineeringand Technology(IJCIET,9(2),188–204.
http://www.iaeme.com/IJCIET/index.asp188http://http://www.i aeme.com/ijciet/issues.asp?JType=IJCIET&VType=9&IType=2http ://www.iaeme.com/IJCIET/issues.asp?JType=IJCIET&VType=9&I Type=2
[23] ŠpelaVerovšek,Juvančič,M.,Petrovčič,S.,Zupančič,T., Svetina,M.,Janež,M.,Pušnik,Ž.,Velikajne,N.,&Moškon, M. (2022). An integrative approach to neighborhoods sustainability assessments using publicly available traffic data. Computers, Environment and Urban Systems,95.
https://doi.org/10.1016/j.compenvurbsys.2022.101805
[24] TanzinaAfrin,&Yodo,N.(2020).Asurveyofroadtraffic congestionmeasurestowardsasustainableandresilient transportation system. In Sustainability (Switzerland)(Vol.12,Issue11).MDPI.
https://doi.org/10.3390/su12114660
[25] Yaser Hawas, E. (2013). Simulation-Based Regression Models to Estimate Bus Routes and Network Travel Times.
https://doi.org/10.5038/2375-0901.16.4.6.
International Research Journal of Engineering and Technology (IRJET) e-ISSN: 2395-0056 Volume: 11 Issue: 1 | Jan 2024 www.irjet.net p-ISSN: 2395-0072 © 2024, IRJET | Impact Factor value: 8.226 | ISO 9001:2008 Certified Journal | Page496
[26] ZixuZhuang,Cheng,Z.,Yao,J.,Wang,J.,&An,S.(2022). Bus travel time reliability incorporating stop waiting time and in-vehicle travel time with AVL data. International Journal of Coal Science and Technology, 9(1).
https://doi.org/10.1007/s40789-022-00544-7.
[27] Zhen Chen, Fan, W. D. (2020). Analyzing travel time distribution based on different travel time reliability patternsusingprobevehicledata.InternationalJournal ofTransportationScienceandTechnology,9(1),64–75. https://doi.org/10.1016/j.ijtst.2019.10.001
[28] Zhen-Liang Ma, Luis Ferreira, Mahmoud Mesbah, and Ahmad Tavassoli Hojati (2019), Bus travel time modelling using GPS probe and smart card data: A probabilisticapproachconsideringlinktraveltimeand stationdwelltime.JournalofIntelligentTransportation Systems:Technology,Planning,andOperations,23(2), 175–190.
https://doi.org/10.1080/15472450.2018.1470932
International Research Journal of Engineering and Technology (IRJET) e-ISSN: 2395-0056 Volume: 11 Issue: 1 | Jan 2024 www.irjet.net p-ISSN: 2395-0072 © 2024, IRJET | Impact Factor value: 8.226 | ISO 9001:2008 Certified Journal | Page497