
Spatial Study on Covid-19 Community Spread in Trivandrum Corporation using GIS
Fathima Sherin T1 , Midhila M2
1Assistant Professor, Dept.of Civil Engineering, Vidya Academy of Science and Technology Technical Campus, Kerala, India
2Assistant Professor, Dept.of Civil Engineering, Vidya Academy of Science and Technology Technical Campus, Kerala, India ***
Abstract -The coronavirus (COVID-19) pandemic have been a public health threat worldwide, particularly in densely populated countries. Geographic informationsystem(GIS) can be used to map the geographical distributionofdisease, trends in community spread of disease and to identify significant hotspots and cluster zones of COVID-19. The aimofthe studyis to analyse the spatial extent of disease transmission through mapping and preparation of graphs at ward level and to prepare a web mapping application to get the COVID-19 information from July 2020 to February 2021 related to 100 wards in Trivandrum Corporation in Kerala.
Key Words: COVID-19; GIS; Trivandrum Corporation
1.INTRODUCTION
Thenovelcoronavirusdisease2019(COVID-19)infection, causedbysevereacuterespiratorysyndromecoronavirus2 (SARS-CoV-2),firstemergedinDecemberof2019inWuhan city, China. The first case of the COVID-19 pandemic in KeralawasconfirmedinThrissuron30January2020,which wasthefirstcasereportedinIndia.Asof11January,there have been 29,14,557 confirmed cases with 28,08,062 (96.13%)recoveriesand13,197(0.45%)deathsinthestate. A high number of cases was reported on March in India, Keralahadreducedtherateofincreaseofnewcasestoless than0.25%perdaybyApril30.However,inmid-May,there wasanincreaseinnewconfirmedcases,followingthereturn ofKeralitesfromothercountriesandotherIndianstates.In July, a large local group of cases was identified at the KumarichanthafishmarketinThiruvananthapuram.There hasbeenathirdsurgeincasespostOnamandahighnumber ofnewcaseswasreportedinlate-OctoberinMalappuram, Kozhikode,ErnakulamandThrissurdistricts.Thestatehas the lowest case fatality rate compared to the confirmed cases. The largest single-day spike of 42,464 cases was reportedonMay6,2021inKerala.AsofOctober2020,more than90%ofknowncaseswereduetocommunityspread. Keralaispresentlyat3rdpositionindailynumberofCOVID19 cases state wise in India. Vaccines like Covishield and CovaxinhavebeenintroducedinKeralawhichisfoundtobe effective.InKerala,30.01%ofpeople,ie,1,06,49,645people havetakenthevaccinationofwhich30,99,039havetaken both doses of vaccine. Early detection of the virus and
isolationisanimportantpreventiveinterventionmeasures forcontainingthediseasespreadinitially.
1.1 OBJECTIVE
The objective of the study is to analyse the extent of communityspreadofCOVID-19forTrivandrumcorporation by the creation of map showing the ward wise COVID-19 casesforTrivandrumcorporationfromJuly2020toFebruary 2021andtofindanypossiblerelationshipbetweenCOVID-19 casesandpopulationdensity.Thentocreateawebmapping application to obtain the COVID-19 related information in TrivandrumCorporation.
2. STUDY AREA
The Thiruvananthapuram municipal corporation is spread over 214.86 km2 with 100 wards and a population of 9, 57,730inhabitants.Itislocatedbetweenlatitude8’25”North andlongitude76‘55”East.Ithasgotapopulationdensityof 4457 per square kilometre. It includes the Legislative Assembly constituencies of Thiruvananthapuram, Vattiyoorkavu,Nemom,Kazhakkoottamand5wardsofthe Kovalamconstituency.
International Research Journal of Engineering and Technology (IRJET) e-ISSN: 2395-0056 Volume: 11 Issue: 01 | Jan 2024 www.irjet.net p-ISSN: 2395-0072 © 2024, IRJET | Impact Factor value: 8.226 | ISO 9001:2008 Certified Journal | Page81

3. METHODOLOGY
Themethodologyisanine-stepprocedure.Itconsistof collectionofpopulationandlocationofwardsinTrivandrum corporation,collectionofwardwisedailynumberofCOVID19casesfromTrivandrumDistrictAdministration,tabulation ofdailyCOVID-19casesforeachwardwiththeaidofExcel sheet, location of each ward is pinned with corresponding COVID-19casesbyopeningtheshapefileinArcGISplatform andtheExcelsheetwithCOVID-19positivecaseswereadded inArcMapandtheExcelsheetwasjoinedwiththeattribute table of Trivandrum Corporation, mapping spatially the numberofCOVID-19casesforeachward,showingthespatial progressofCOVID-19inTrivandrumcorporationwithtwo week time duration, creation of map showing change in COVID-19 in different patterns in ArcGIS environment, to identify any correlation between COVID-19 cases and populationdensityforeachwardinTrivandrumcorporation by using Data analysis tool in MS Excel and correlation analysiswasperformedtofindwhetherCOVID-19caseshave anycorrelationwithpopulationdensity.Pearsoncorrelation coefficient r was calculated and the value of r was usedto
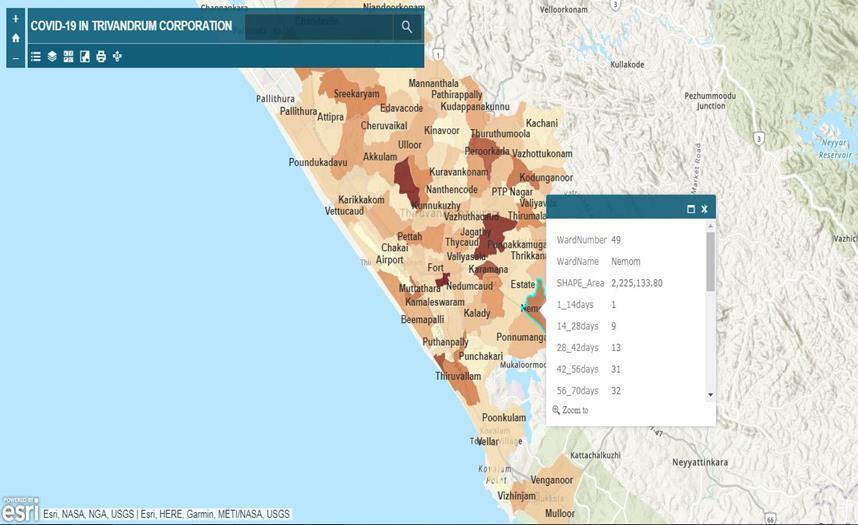
determinetheirrelationship.Finallyforthecreationofweb mapping application with ArcGIS Online platform, the shapefileofTrivandrumCorporationwasimportedtoArcGIS Onlineplatform.TheattributetablehaddataaboutCOVID-19 caseswith14daystimeintervalfrom0-240days.Thenaweb map was created to produce a web application. The web applicationhelpstogetthefullCOVID-19informationabout eachwardbyclickingonthewardandsearchpanelisalso provided in which name of ward of user’s interest can be entered and ward gets focused and information about it appearsinthepop-upwindow.
4. RESULT
Thenumberofcaseshasincreasedabout740%fromfirst14 days and reached maximum in 84-98 days and showed a decrease of 56% at the end of 240days which is shown in Chart1.SomewardswhichshowedahikeinCOVID-19like Poonthura, Beemapalli, Valiyathura, Vallakadavu and Pallithura during the beginning had shown a decline in positive cases and zero cases and some other wards like Kazhakoottam, Sreekaryam, Peroorkada, Vattiyoorkavu, Nemom and Poojapura ward showed a hike on COVID-19 cases. Some wards like Manacaud, Karamana, and Medical Collegeshowedaconsistentnumberofpositivecasesduring the entire time period with slight decrease in some of the timeinterval.

Chart -1:COVID-19progressfromJuly1toFebruary28
ThemapwithtotalnumberofCOVID-19casesisshowninFig 2.IntheonsetofJuly,positivecasesweremoreinthecoastal wards as two fisherman who returned from Tamil Nadu carriedthevirus.TheviruswasspreadinKumarichanthafish marketandPoonthurawardshowedthehighestnumberof 323casesinfirst14days.Sincethehousesandhouseholds livesasjointfamilythereishighpopulationdensityinthe coastalwardso,thecommunityspreadwasrapidandmostof thepeoplewasaffected.Thevirusstartedtospreadfromthe coastal wards to the nearby wards from 0 to 56 days. A communityspreadoccuredinPoojapuraCentralJailwith473 positive cases during 42 to 56 days. Manacaud ward and Karamanawardshowedahikeinpositivecasesfrom56to 70days.ThespreadinMedicalCollegewardstartedfrom70
International Research Journal of Engineering and Technology (IRJET) e-ISSN: 2395-0056 Volume: 11 Issue: 01 | Jan 2024 www.irjet.net p-ISSN: 2395-0072 © 2024, IRJET | Impact Factor value: 8.226 | ISO 9001:2008 Certified Journal | Page82
Fig -1:TrivandrumCorporationwith100wards
days.Thehighestnumberofcaseswerereportedduring84 to98days(September22toOctober6).Ninetyninewards wasinfectedduringthistimeperiodandmostofthewards showed a hike in positive cases with cases above 60, 4% surge in cases were seen than the previous time interval. From 98 days of the study duration, no wards had shown casesabove150andthespreadofcaseswasseeninwards within the city limits. The community spread which had occurred in coastal wards declined. All the wards had a consistent number of cases from 98 to 126 days and the spreadwasmoreinManacaud,MedicalCollege,Karamana wards during this period. After 126 days, decrease in the intensityofCOVID-19caseswereseeninmostofthewards and cases were between 10 and 50. No wards had cases above 100 from 126 to 196 days and cases were comparativelylowerduringthistime.After196days,cases above100wasreportedfromPeroorkadawardandahikein totalnumberofCOVID-19casescouldbeseeninTrivandrum Corporationtilltheendof240days.Thewardswhichinitially hadhigherrateshaddeclinedattheendofthestudyperiod and new wards which are situated in the city limits had shown increase in positive cases due to high people and freightmovement,presenceofamenities,andreopeningof malls,theatersetcduringthisperiod.
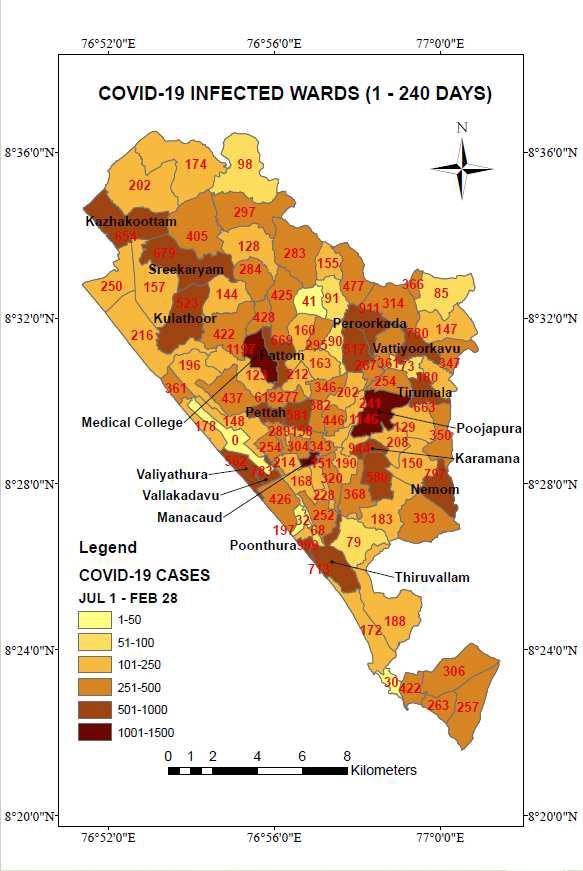
All wards have been infected in this study period with 20 wards showing positive cases above 500, 69 wards have casesbetween100and500and11wardshadcasesbelow 100.Thewardswhichareinfectedmoreareinthecitylimits and it is caused due to people and freight movement and highpopulationdensity.
Table -1: WardswithhighernumberoftotalCOVID-19 cases(July1–Feb28)
4.1 POPULATION DENSITY AND COVID-19 CASES
TheanalysisbetweenCOVID-19casesandpopulationdensity wascarriedinordertofindanypossiblerelationship.Amap showing population density was prepared and COVID-19 caseswereshownwithbubblesforeachofthe100wardsin ThiruvananthapuramCorporationasinFig3
International Research Journal of Engineering and Technology (IRJET) e-ISSN: 2395-0056 Volume: 11 Issue: 01 | Jan 2024 www.irjet.net p-ISSN: 2395-0072 © 2024, IRJET | Impact Factor value: 8.226 | ISO 9001:2008 Certified Journal | Page83
Fig -2:COVID-19Infectedwardsfrom1-240days(July1–February28)
NameofWard NumberofTotalCases (July1–February28) Manacaud 1282 MedicalCollege 1197 Poojapura 1146 Poonthura 999 Karamana 944 Peroorkada 911 Nemom 797 Vattiyoorkavu 780 Thiruvallam 713 Sreekaryam 679 Pattom 669 Thirumala 663 Pettah 619

A fewer no: of wards having high population density like Manacaud(23520.71/sq.km),Poonthura(24901.09/sq.km), Karamana(11401.86/sq.km),Vallakadavu(15,681.29/sq.km), higher COVID-19 cases could be seen. But in some wards, there is no such trend. Puthanpally (17944.85/sq.km), BeemapalliEast(14171.97),Manikkavilakom(26327.74)and Sreekandeswaram (20870/sq.km) having high population densityhavetheleastnumberofcasesintheoverallstudy period. Wards in northern side like Kazhakoottam (2152.58/sq.km),Sreekaryam(1974/sq.km)andKulathoor (2077.65)havingPopulationDensitylessthan5000/sq.kmis showinghighCOVID-19cases.Thisshowsthatphysicaland ground truth conditions have greater significance in the wardshavinghighCOVID-19cases.
ThequantitativeanalysisbetweenwardwisetotalCOVID-19 cases and Population density was done with correlation analysis.Pearsoncorrelationcoefficientrwasdetermined. TheformulaforPearsoncorrelationcoefficientris r = where,r=correlationcoefficient, =valuesofx-variable insample, =meanofthevaluesofthex-variable, =values oftheyvariableinthesample, =meanofthevaluesofthe y-variable.
Data Analysis was installed in MS Excel to perform the Correlation analysis. The value of Pearson correlation coefficientrwascalculatedwithxvalueaswardwisetotal COVID-19casesforthestudyperiodandyvalueaswardwise populationdensityof100wards
The value of r was obtained as 0.0965 which means high population density have smaller effect on high number of COVID-19cases.IfthevalueofPearsoncorrelationcoefficient is1,thenitsperfectpositivecorrelationand-1showsperfect negativecorrelation.Buthere,thevalueobtainedisverylow andhence itcan beconcluded that population density has least effect on high COVID-19 cases in Trivandrum Corporation.
ThiswebmappingapplicationwascreatedinArcGISOnline platform. The map of Trivandrum Corporation with the complete COVID-19 information was published in ArcGIS Online.Thena webmapwascreatedinArcGISOnlineand thenwebmappingapplicationwascreated.Thisapplication givesthecompleteCOVID-19informationrelatedtoanyward byjustclickingonthewardofinterest.ThecountonCOVID19casesisgivenwith14daystimeinterval.Asearchpanelis alsoprovidedandbyinputtingthewardname,theparticular ward will be focussed and COVID-19 information can be obtained. It’sauser-friendlyapplicationanduserscanaccess it by logging into ArcGIS Online and the pasting the URL https://arcg.is/5C0DH0.Thisapplicationcanbeupdatedby fillingthedataintheattributetableofthewebmap.Thisweb mappingapplicationwillhelpthedecisionmakerstofocuson thewardshavingCOVID-19cases.
5. CONCLUSIONS
The wards with high COVID-19 cases were Manacaud, MedicalCollege,PoojapuraandPoonthura.Manacaudward has a Population density of 23520.71/sq.km has highest COVID-19 cases of 1282 cases. It may be due to higher populationdensity,denselycrowdedmainroad,presenceof restaurants,textiles,religiouscentres,schools,offices,prison
International Research Journal of Engineering and Technology (IRJET) e-ISSN: 2395-0056 Volume: 11 Issue: 01 | Jan 2024 www.irjet.net p-ISSN: 2395-0072 © 2024, IRJET | Impact Factor value: 8.226 | ISO 9001:2008 Certified Journal | Page84
Fig -3:COVID-19Infectedwardsfrom1-240days(July1–February28)
Fig -4:COVID-19Infectedwardsfrom1-240days(July1–February28)
anditisneartoThampanoorandEastfortbusstationand theprominentChalaimarket.Thedailypassengermovement ishigherinthisregionsinceitistheregionwhichconnects themaincitytotheNationalHighway.MedicalCollegeward hasaPopulationdensityof5237.022/sq.kmandhaveahigh toll of1197COVID-19cases.Itissituatedinthemaincity areaofthecorporationandisdenselypopulated.Thereason forhightollinCOVID-19isthatthousandsofpatientsand bystandersdailyvisitstheprominentTrivandrumMedical Collegeandthereissomanylaboratories,medicalshopsand other amenities in that region. Poojapura ward has a populationdensityof2753.646/sq.kmhasahightollof1146 COVID-19cases.Themaincausewasthecommunityspread in Poojapura Central Jail and majority of the about 500 prisoners was tested COVID positive. This ward is in the maincityareaofthecorporationandconsistsofimportant officessuchasPareekshaBhavanetc Poonthurawardhasa populationdensityof24901.09/sq.kmhasahightollof999 COVID-19cases.Thiswardisinthecoastalregionandhasa totalof650housesand712households.Thecitycorporation was focusing on containment activities and regulations in PalayamandChalaimarketbutKumarichanthawasoffthe radarandthiscausedthecommunityspreadinmarketand peoplelivingincoastalareaastwofishermenwhoreturned fromTamilNaducarriedthevirus.Thecommunityspread was faster due to lack of social distancing because 68 households are landless and most of them are living as a jointfamilyandduetohighpopulationdensity.Thewards having lower COVID-19 cases are Kinavoor, Harbour, BeemapalliEastandPuthenpally.Itmaybebecausethese wards are located beyond city limits, and movement of people in these regions are low due to lower amenities, shops etc. The trend line of COVID-19 was showing an upward trend even though the cases were comparatively lower than the mid period. The return of Keralites from othercountriesandstatescausedasurgeinpositivecases duringSeptemberandOctobermonth.
Thecorrelationanalysisshowedpopulationdensityhasless effectonCOVID-19casesbutwardswithhighercaseswas influencedbythephysicalconditionslikehighrateofpeople andfreightmovementbecausethosewardswereinthecity limits and the presence of amenities were more in those regions.
Thewebmappingapplicationwillhelpthedecisionmakers tofocusonwardswithhighCOVID-19rates.
REFERENCES
[1] AbdulkaderMuradandBandarFuadKhashoggi[2020], UsingGISforDiseaseMappingandClusteringinJeddah, Saudi Arabia, ISPRS International Journal of Geo Information,9,328
[2] Arif Masrur, Manzhu Yu, Wei Luo and Ashraf Dewan [2020],Space-TimePatterns,Change,andPropagation
ofCOVID-19RiskRelativetotheInterventionScenarios in Bangladesh, International Journal of Environmental Research and Public Health,Vol:17,pp:1-22
[3] EdithRodriguez,LyseinIZambranoandJoseClaudiada Silva(2019),SpatialdistributionofdengueinHonduras during 2016-19 using geographic information system GIS-dengueepidemicimplicationsforpublichealthand travelmedicine, Travel Medicine and Infectious diseases, 32,101517
[4] A. Venkatesh, M. Ankamma Rao [2023], Mathematical ModelforCOVID-19pandemicwithimplementationof interventionstrategiesandCost-EffectivenessAnalysis, Results in Control and Optimization,14,100345
[5] Rakibul Ahasana, Md Mahbub Hossain [2021], Leveraging GIS and spatial analysis for informed decision-makinginCOVID-19pandemic, Health Policy and Technology,10,7-9
International Research Journal of Engineering and Technology (IRJET) e-ISSN: 2395-0056 Volume: 11 Issue: 01 | Jan 2024 www.irjet.net p-ISSN: 2395-0072 © 2024, IRJET | Impact Factor value: 8.226 | ISO 9001:2008 Certified Journal | Page85