

PLACEMENTS ANALYTICS AND DASHBOARD
G. Dinesh
Kumar5 , A. Naveen6
Sri Vasavi Engineering College (Autonomous), Pedatadepalli, Tadepalligudem, Andhra Pradesh – 534101, India.
Abstract: The "Placements Analytics and Dashboard" is a comprehensive web application designed to store and analyze placement data [1][2] for students who have securedpositionsinsoftwarecompanies.Nowadaysthere arevarioustechnologiesandopportunitiesinthesoftware field so in order to get placed in a well-established software company we need to find out which of them are well-established companies and technologies that need to be learnt by the students [3][5]. This system offers powerful analytical features [6] that enables users to enhance statistical reports and visualizations. A pie chart representation showcases the distribution of placements based on the technologies learnt by students. This visualization acts as a guide for students to identify the most sought-after skills in the industry to empower them and make informed decisions regarding their educational and career paths. Furthermore, the project includes a comparative analysis of placement trends year by year, depicted through bar graphs and a pie chart representation of hiring companies that illustrates the number of students recruited by each Organisation valuableinsights[7]andindustrypreference.
Keywords:
AnalysisandDashboard
Webapplication
PlacementsData
Visualizations
PieCharts,BarGraphs,StaticalReports
Database
1.Introduction:
Inmanyinstitutionsthereismostlynodataofprevious projects. This Platform "Placements Analytics and Dashboard" seeks to address the lack of a centralized repository for accessing student data. This website will serve as a comprehensive repository of student data, allowingthestudentstoexploreandsearchforthecourses they need to complete in order to secure a job in best companies and to find information about those who have beenpreviouslyemployed.
Increasing opportunities and technologies in the software field demands informed career choices for students. The “Placements Analytics and Dashboards” is a web application that addresses the need by analysing placementdataforstudentsinsoftwarecompanies.
This web application project will empower students with data-driven insights to identify sought-after skills in the industry, offering powerful analytical features such as pie chartsand bargraphs for enhanced statistical reportsand visualizations.
This project will also facilitate comparative analysis of placement trends year by year and showcases company preferences for requirement. This comprehensive tool guides students towards successful education and career pathsintheSoftwareIndustry.
2.Literature Survey:
In the past few years, there has been a surge in the demand for skilled professionals in the software industry, leading to a rise in placement analytics and dashboard solutions.Thistrendhighlightsthegrowingimportanceof employingeffectivestrategiesforacquiring,analysing,and utilizing this crucial data. While various studies and surveys have been conducted in recent years to understand the trends and challenges in the software industry. This review may help us to describe some preliminary research that was caried out by several authors on this relevant work. Now we are going to consider some important guidance and keywords to furtherexpandourwork:
PlacementAnalyticsforSoftwareEngineeringStudents by Kumar et al. (2020) This research paper introduces a dashboard that leverages data mining and machine learning techniques to analyze placement data specific to softwareengineeringstudents.Theprimarygoalistooffer valuable insights into the job market for these students, helping them make informed career choices. The dashboard provides information on popular technologies thatareindemandinthejobmarket,crucialskills,andtop companiesinthesoftwareengineeringfield.

Web-Based Placement Analytics System for EngineeringCollegesbyRathoreetal(2019) Rathoreet al.'s work focuses on a web-based system designed to collect and analyze placement data from engineering colleges. This system offers comprehensive reports on variousaspectsofplacement,suchastrendsovertime,the companiesthatfrequentlyrecruitfromthesecolleges,and the skills that are highly sought after by employers. This research is valuable for colleges and students aiming to improvetheirplacementoutcomes.
Singh et al.’s (2018) Data-Driven Approach to PlacementAnalytics Singhetal.'sresearchpaperoutlines a data-driven framework for enhancing the placement process. The framework encompasses the entire process, including data collection, data cleaning, data analysis, and data visualization. By systematically addressing each of thesestages,thisapproachaimstoprovideamoreefficient and data-backed placement process. It can be seen as a roadmap for institutions looking to improve their placementproceduresthroughdataanalytics.
Study on Placement Trends in the IT Industry" by Raj et al. (2017) Raj et al.'s study focuses on analysing placement trends within the IT industry over a five-year period. The research identifies and highlights the most popular technologies sought after by IT companies, including Java, Python, and C++. Furthermore, it emphasizes the importance of certain skills such as problem-solving, communication, and teamwork that are in high demand among IT employers. This study is beneficial for both students seeking IT careers and educational institutions preparing students for the job market.
Comparative Analysis of Placement Trends in India
and the US" by Sharma et al. (2016) Sharma et al.'s research is a comparative analysis of placement trends in the IT industry between India and the United States. This study explores the differences and similarities in the job markets of these two regions. It identifies the popular programming languages like Java, Python, and C#, as well askeyskillssuchasproblem-solving,communication, and creativity,whicharevalued byemployersineachlocation. Understanding these regional variations can be valuable for students and professionals considering international job opportunities or companies looking to expand their workforceglobally.
These research papers collectively offer a comprehensive view of placement analytics and trends in the software engineering and IT industries, providing valuable insights forstudents,educationalinstitutions,andrecruitersinthe field.
3.Proposed Work:
3.1ProposedSystem:
The comprehensive system incorporates multiple vital components, beginning with a resilient data storage and managementsystemengineeredtosafeguardasubstantial amountofplacementdata.Thisdataencompassesstudent profiles, company details, and technology-related information. Collaborating with this component is a sophisticateddataanalysisengine,adeptatprocessingthe data and generating thorough statistical reports and visualizations. These reports and visualizations are effortlessly accessible through a user-friendly web-based interface, facilitating seamless engagement for students, educators,andcareeradvisors.
Insidethisinterface,studentscannotonlyinputtheirown data but also obtain insights from pie charts showcasing the distribution of placements based on their acquired technologies. This analysis assists students in pinpointing the most coveted skills. The system also features year-byyear placement trend analysis, as depicted by bar graphs and trend charts. This historical perspective empowers students and institutions to make informed, data-driven decisions regarding educational and career paths. Furthermore, a pie chart or similar visualization displays thenumberofstudentsrecruitedbyvariousorganizations, offeringvaluableinsightsintoindustrypreferencesandthe statureofwell-establishedcompanies.
We are going to implement a comprehensive web application designed to store and analyze placement data for students who have secured various jobs in various positionsinsoftwarecompanies.
The System aims to address these shortcomings by providing powerful Technology Distribution Analysis (Pie charts and Bar Graphs), Interactive Visualizations and Automated Comparative Analysis to guide students andimprovethemanagementofplacementdata.
The “Centralized Data Repository” will centralize all placement-related data in a structured database, ensuring that all relevant information is easily accessible and eliminatingtheneedtosearchthroughvarioussources.
Through this web application, undergraduates and graduates will be guided to make the best choices in their academicandcareerpaths.

3.2Existingsystem:
Managing a comprehensive "Placements Analytics and Dashboard" presents several challenges for students. Firstly, effective time management is crucial for meeting projectdeadlines.Secondly,groupprojectdynamicscanbe complex, requiring students to navigate issues related to communication and the fair division of responsibilities. Datacollectionposesasignificantchallengeasitdemands accurate year-by-year placements data, necessitating rigorous verification to avoid potentially misleading conclusions. Moreover, data privacy and security concerns are paramount, with students responsible for compliance with data protection regulations. Data integrity is pivotal forthesystem'sefficiency,asanydiscrepanciesorerrorsin the data could mislead both students and employers. Keeping data updated, especially in the event of securing multiplejoboffers,canbechallenging.Lastly,thesystem's limitedindustryscopemayhinderitsutilityforstudentsas it might not encompass all software companies or technologies.
In the Existing System “Lack of Data Centralization” as placements data is scattered across various sources and making it challenging to obtain a comprehensive view of placements and hindering efficient analysis and decisionmaking
The “Manual Data Analysis” will be analyzing the placements trends and identify the process in the current system is labor-intensive and time-consuming, which can result in errors and delays in producing meaningful insights and the limited visualization and reporting capabilityfurtherhindertheextractionofvaluableinsights andtheidentificationofpatternsandtrends.
The “Lack of Student Guidance” may clear the information about which technologies are in high demand byemployers,potentiallyleadingtosuboptionaldecisionmakingregardingskillacquisitionandcareerchoices.
3.3Methodology:
The "Placement Analysis and Dashboard" project involved creating a web application interface. We used HTML and CSS to make the interface user friendly whileJavaScriptwasemployedforcalculations.Toimprove analysis and provide a view we made use of Chart.js. This allowedustopresentdatainadashboardformatusingpie charts and bar graphs. Chart.js played a role in enhancing analysis and visualization, for this application making it more effect in this project “Placement Analysis and
develop this web application and user interface we used HTML, CSS and better user-friendly interface, for another mathematical calculations we used JavaScript. For, better understanding and for best analysis we mainly used Chart.js by using this we can develop and can be declared thedata ina dashboardiftheformatofpiechartsandbar graphs timeandefficient.
1. Data Collection and Analysis: Collect data on placements,fromsources,suchasstudentprofiles andcompanyrecords.Ensurethedataiscleanand
consistent by addressing any missing values or inconsistencies,inthedataset.
2. Data Storage and Management: Design a Database (using MySQL) to store student’s information, company details and placement’s records, Establish relationships between entities forefficientdataretrieval.
3. Dashboard interface Development: Create a webapplicationinterfaceforuserstointeractwith the placement analytics. Design intuitive visuals, including pie charts to represent technology distribution and hiring companies, as well as bar graphstoillustrateyearlytrends.
4. UserInteractionandCustomization: Implement user friendly filters to allow users to customize data views based on years, technologies and companies.
5. Visualization Generation: Generate dynamic pie charts and bar graphs using data processed from the analysis. Ensure responsive design for seamlessviewingonvariousdevices.
6. Technological Stack: Taking an appropriate technology for developing the web application, suchasfront-endframeworks(Chart.js),back-end framework(Django)anddatabases(MySQL).
7. User Authentication and Security: Implementation of user authentication and authorization mechanisms to secure the data and restrictaccesstoauthorizedusers
3.4ProjectPlanandArchitecture
1. ProjectPlan:
The “Placements Analytics and Dashboard” webapplicationwillprovideaservetoguidestudents in choosing OnDemand technologies, aiding educational planning and efficient job searches. It offers insights into well-established hiring companies, tracking placement trends and supports data-driven decisions for institutions and for the students. For, all contributing to informed career choices in the softwareindustry. ashboard “is a web application interface we used to

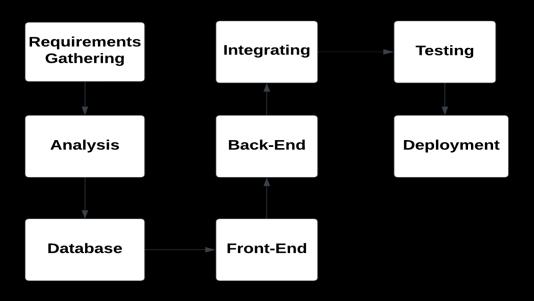
2. SystemArchitecture:
The system consists of a front-end for user interaction, the back-end handling data and business logic, a relational database for data storage, an analytical engine for data analysis, a visualization component to display insights. It also includes user authentication, optional API gateway, secure hosting, scalability, monitoring and potential third-party integration, all aimed at helping students make informedcareerdecisionsinthesoftwareindustry.
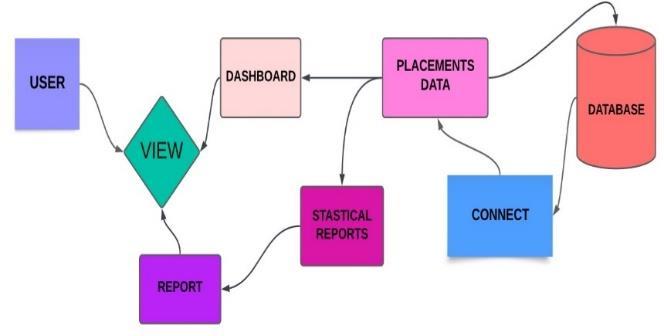
4 Results and Discussions:
From the below Provided information and from the figures are the interface provided to the user to view and searchforthecompanieswhichmatcheshis/herskillset
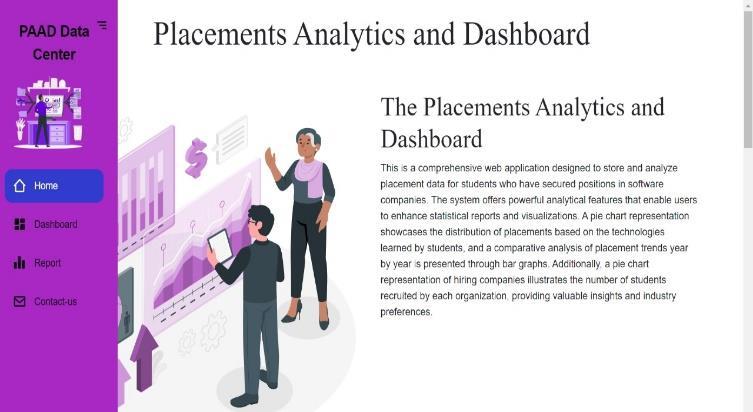
4.1LANDINGPAGE(HOME):
The platform offers a user-friendly homepage, enabling straightforward navigation through various sections. Furthermore, users can access the dashboard to obtain insights into their placement data, analyses trends, and visualize crucial information through pie charts and bar graphs. The reports section provides comprehensive information on student performance and placement outcomes.
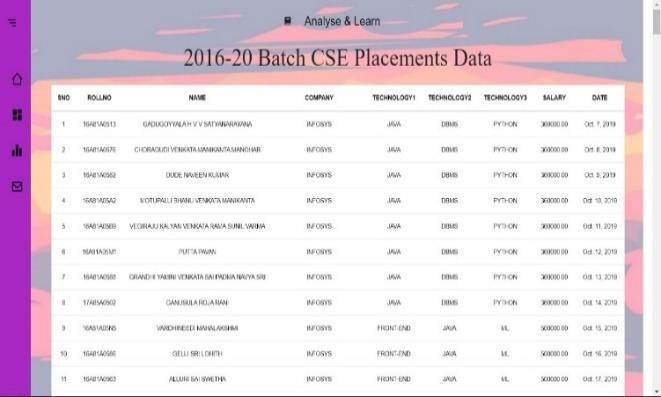
4.2DASHBOARD:
The "Placement Analysis and Dashboard" is a dedicated web-based application, accessible through a dedicated webpage, functioning as a repository of information concerning students who have successfully secured positions in various companies. The platform provides a wealth of data related to these students, including the number of technologies they have mastered, the organizations they are employed by, their salary information, and their employment start dates. Notably, the dashboard prominently displays individual student details, such as their names, roll numbers, employing companies, areas of technological expertise, salary particulars, and dates of joining. The primary goal of this dashboard is to offer insights into the placement of students within the Computer Science and Engineering (CSE) department during the period spanning 2016 to 2020. The key fields within the dashboard include SNo, RollNo, Name, Company, Technologies (with a focus on threemaintechnologies),Salary,andDateofJoining.

4.3REPORT:
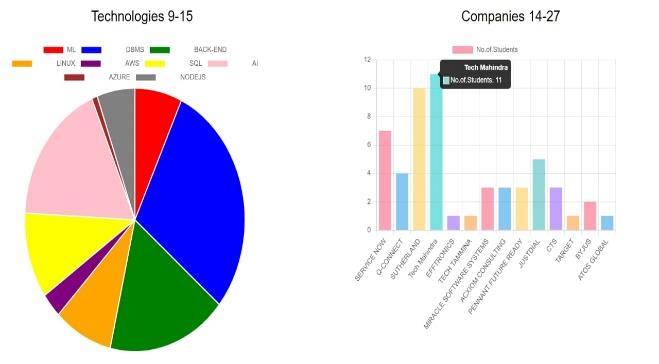
In this web application, we offer information about students who have successfully landed positions in different companies, categorized by the technologies they haveacquired.visualizationofthisinformation

Figure1.3 DataVisualizatiion
weemployChart.js.ThispowerfultoolenablesuserstoAll of this data is meticulously stored in our database. To enhance the clarity and grasp the distribution of individuals across various companies and the corresponding compensation packages. We present this data through bar graphs and pie charts, making it more user-friendlyandcomprehensible.
4.3.1StackedLineChart:
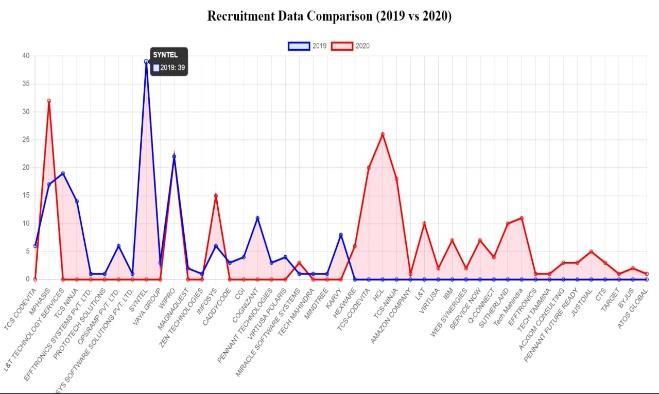
In our analysis, we have gathered data from previous studentswhosecuredjobsinvariouscompanieswithinthe Computer Science and Engineering (CSE) department between the years 2019-2020. We aim to understand the current recruitment trends based on past on-campus
recruitments, shedding light on both growth and declines injobrequirements.
To facilitate a clearer comprehension of this analysis, we employ stacked line charts for enhanced visualization. So, users can easily grasp key insights about placements, making it a convenient and informative tool for understandingthedynamicsofemploymentopportunities. Stacked line charts provide a different perspective on the data, showing how different factors contribute to overall trendsovertime.
4.3.2Suggestion
Weareofferingessentialrecommendationstostudents throughalinklocatedonthelowerleft-handside

SuggestionBox
The suggestion box featured in our reports serves as a valuable resource for students. Within this section, we offerinsightsintothetopcompaniesthathavesuccessfully hired our students, providing a clear path to career opportunities.


Figure1.3.5 SuggestionsforStudents
We also provide tailored recommendations, highlighting the key technologies and skills sought after by these top companies. These suggestions guide students in their educational journey, helping them acquire the necessary expertise to secure positions with these prestigious employers
5.CONCLUSION:
In conclusion, the "Placements Analytics and Dashboard" is a robust web application dedicated to storingandanalyzingplacementdata,assistingstudentsin their pursuit of well-established software companies. It empowers users with potent analytical features for elevating statistical reports and visualizations. A pie chart representationunderscoresthedistributionofplacements based on students' acquired skills, offering invaluable guidance for career decisions. Additionally, the project conductsayear-on-yearcomparativeanalysisofplacement trends, portraying these insights through bar graphs and pie charts illustrating recruitment by various organizations.Thecoredata-relatedaspectsareeffectively completed,andthefocus nowturnsto enhancingtheuser experience through an informative homepage. This will serve as an accessible entry point for users to access placement data and insights. we provide user support for addressingqueriesandofferingfurtherdetails,ensuringa comprehensiveanduser-centricexperience.
5.1FUTURESCOPE:
1. Multi-Year Data Integration: In the current scenario, the system includes only one year of placementdata.Inthefuture,theprojectcouldbe enhancedtointegratemultipleyearsofplacement data. This would allow for a more comprehensive analysis of placement trends over time, enabling students and colleges to make more informed decisions.
The future scope of the project could involve aggregating placement data from different colleges.Thiswouldprovideabroaderviewofthe placement landscape and help identify industry preferences and recruitment trends on a larger scale.Studentscanthencomparetheperformance oftheirinstitution with othersand work onareas ofimprovement.
2. Advanced Analytics: With the addition of more data, advanced analytics and machine learning techniques can be incorporated to predict future placement trends. This would involve analyzing historical data to identify patterns and forecast whichskillsandtechnologieswillbeindemandin thefuture.
3. Real-Time Data Updates: The project could be upgraded to include real-time data updates. This would involve integrating the application with college placement systems to fetch data in realtime, ensuring that students and administrators always have access to the most up-todateinformation.
6. REFERENCE:
[1] S. SATHISH1, C.R. RENE ROBIN2 “An Optimized ResultAnalysisSystem forInstitutionsinIndiahaving Credit System” Vol 03, Issue 01; January-April 2012 ICICES-2012-SAEC
[2] Ajay Kumar Pal 2013 Classification Model of Prediction for Placement of Students, I.J. Modern EducationandComputerScience
[3]Aljohani,N.R.,Daud,A.,Abbasi,R.A.,Alowibdi,J.S., Basheri, M., & Aslam, M. A. (2019). An integrated framework for course adapted student learning analytics dashboard. Computers in Human Behavior https://doi.org/10.1016/j.chb.2018.03.035
[4] Chatti, M. A., Muslim, A., Guliani, M., & Guesmi, M. (2020). TheLAVAmodel:learninganalyticsmeetsvisual analytics https://doi.org/10.1007/978-3-030-473921_5
[5] Verbert K, Duval E, Klerkx J, Govaerts S, Santos JL (2013)Learninganalyticsdashboardapplications.Am BehavSci57(10):1500–1509
[6] *Comparative Analysis of Placement Trends in India and the US*: This paper was published in the International Journal of Advanced Research in Computer Science (IJARCS) and authored by Dr. Pooja Sharma,Dr.AnilKumar,andDr.RajeshKumar.

[7] *Data-Driven Approach to Placement Analytics*: This paper was published in the International Journal of Advanced Research in Computer Science (IJARCS) andauthored by Dr. RuchiSingh, Dr. Shailendra Singh, andDr.PradeepKumar³.
