International Research Journal of Engineering and Technology (IRJET)

e-ISSN:2395-0056
Volume: 10 Issue: 01 | Jan 2023 www.irjet.net p-ISSN:2395-0072


e-ISSN:2395-0056
Volume: 10 Issue: 01 | Jan 2023 www.irjet.net p-ISSN:2395-0072
Nema Ma-Lysea, Mugabe Assielb
a PhD student in Climate Change and Biodiversity- University of Félix Houphouët Boigny, Ivory Coast b Lecturer of irrigation engineering - Rwanda Polytechnic/IPRC Kigali, Civil engineering department ***
This study aimed at evaluating the performance of sprinkler irrigation system in Matimba irrigation scheme located in Eastern Province of Rwanda. Catch cans test were performed to assess the system efficiency in the selected zones under maize crop. Distribution parameters such as Distribution Uniformity (DU) Christiansen’s Coefficient of uniformity (CU) were calculated In addition, efficiency parameters such as water application rate, Potential application of the low quarter (PAELQ), delivery performance ratio (DPR), evaporation and wind drifts losses were determined using appropriate formula. The study's findings showed that the distribution uniformity, coefficient of uniformity, and Delivery Performance Ratio of the system were 84%, 86%, and 0.9 respectively. These results guarantee that the sprinkler system's overall performance is satisfactory. However, it is advised to adopt regular maintenance to improve the system performance at its optimum efficiency. Furthermore, there is need to control silting from pumping station in order to prevent frequent malfunction of water delivery network at field level.
Keywords: Sprinklerirrigation,performanceindicators,Christiansen’sCoefficientof uniformity
InSub-SaharanAfrica,mechanizedirrigationsystemsareincreasinglybeingusedtocreateirrigationsystems (Harrison& Mdee, 2018). One explanation for this is the apparent recent failures of numerous substantial canal-based irrigation schemes that depended on furrow irrigation (Harrison & Mdee, 2018; Mutambara, 2016). Another factor is the growing affordabilityofirrigationpumpspoweredbygasolineanddiesel,aswellastheadventofsolarirrigationpumpsinrecent years.
Asprinklersystemisa typical irrigationmethodusedbyfarmers.Itisknownforbeingvery effectiveandeasytoinstall andmaintain,whichhasledtoitswidespreaduseallovertheworld Accordingto(Topak et al 2005),theuseofsprinkler irrigationmethodsencouragessystemoperationandautomationbyincreasingtheabilitytoachievehighuniformityand effective irrigation, which results in water and energy savings that increase farm profitability. Since the first man used water to boost crop production, performance evaluation has been a crucial component of irrigation design and management (Bos et al., 1993). In that regard, application consistency and loss serve as the foundation for an irrigation system'sefficiency;andthesetwovariablesdescribethesystemperformancestatus.
Aprimarydesignobjective,accordingtoKellerandBleisner(2000),issprinklerirrigationuniformity.Whetherornotthe waterisdistributedevenlyoveraspecificareaisdeterminedbyuniformity.Itisvitaltodeterminetheuniformityofwater applicationinordertoevaluatethesystem'sperformancebecausenoirrigationsystemcanapplywaterpreciselytoevery partofthefield.Accordingto(Topak et al 2005),environmentalfactorslikewindspeedanddirection,aswellassystem networkdesignelementslikenozzlediameterandsprayspacing,determinethepatternofsprinklerwaterdistribution.In theirworkonmaizeyieldsimulationwithregardtosprinkleruniformityvariabilities,(Salmerónetal.,2012.)cametothe conclusion that maize yield reduction occurred when the irrigation coefficient of uniformity was reduced from 100 to 70%.
The distribution of uniformity (DU) and the coefficient of uniformity (CU) are the two most common ways to express uniformity.AccordingtoKellerandBliesner(1990),ifappropriateirrigationisgiventhroughouttheentirearea,alowDU orCUvalueindicatesthatlossesduetodeeppercolationcanbeconsiderable.
Althoughtheconceptoflowvaluesisarbitrary,valuesofDU<60%(CU<75%)arefrequentlyregardedasbeinginthelow range,particularlyforordinaryfieldandfoddercrops.ItisadvisedtouseaDU>75%(CU>84%)forhighervaluecrops.It isclearthatthisfieldisveryimportantbecausenumerousresearchersallovertheworldhavepublishedtheirworkonthe
© 2022, IRJET | Impact Factor value: 7.529 | ISO 9001:2008 Certified Journal | Page204
International Research Journal of Engineering and Technology (IRJET) e-ISSN:2395-0056
Volume: 10 Issue: 01 | Jan 2023 www.irjet.net p-ISSN:2395-0072
evaluationofsprinklersystemperformance(Acaretal.,2010;Ahaneku,2010;Dechmietal.,n.d.;Maroufpooretal.,2010; Msibietal.,2014;Ngasohetal.,2018;Howell,2003;Topaketal.,2005)
Numerous studies have been carried out, particularly in Rwanda, to reveal the status of irrigation water management(Geoffrey et al., 2015; Kannan et al., 2011; Majoro et al., 2016; Narayanan, 2014; Urujeni & Chrysostome, 2015) and there are few publications on irrigation systems performance evaluation (Chandra et al., 2020.). In order to assessthecurrentperformanceofthesprinklerirrigationsystemattheMatimbairrigationproject,thisinvestigationwas carried out. Additionally, not just in the research area but also for other irrigation schemes with comparable issues, the findingswillbehelpfultosystemoperatorsanddecision-makers.
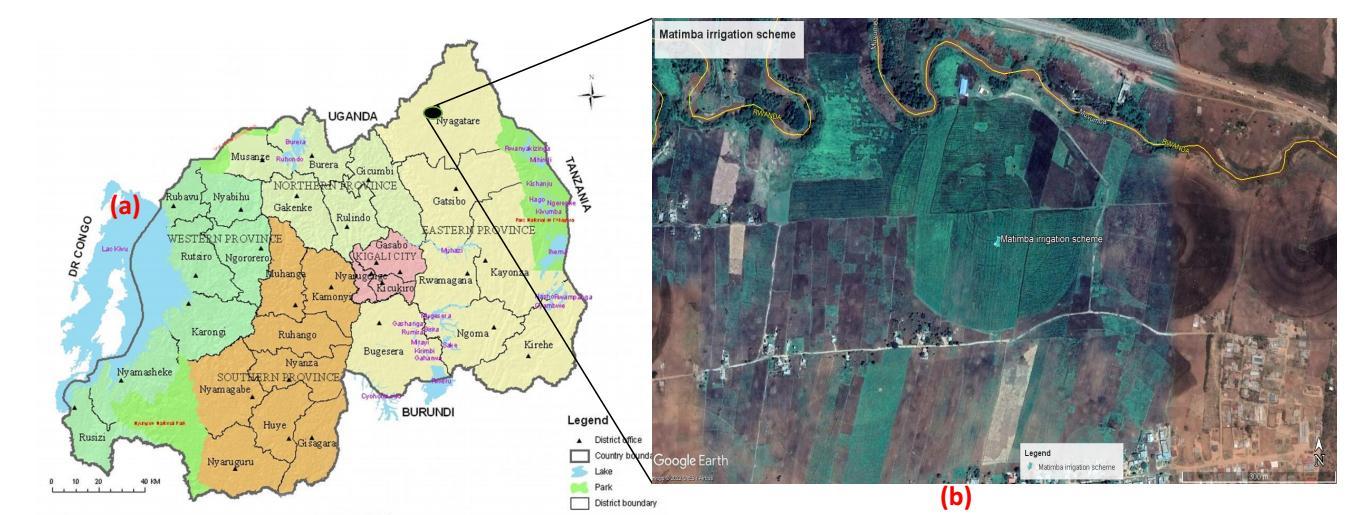
The Matimba irrigation scheme is in Nyagatare District of Rwanda. This area of Eastern Province of Rwanda is situated between 1.0584° S and 30.4574° E with an average elevation of 1513.5 meters above sea level. According to Majumdar (2000),thearea'ssoiltypeissandyloam,anditsinfiltrationrateof17.2mm/hrisregardedtobequick.Theresearcharea experiences varying quantities of light precipitation and hot weather, with an average yearly temperature that ranges between25.3°Cand27.7°C.Thisregionhasacriticalneedforirrigationastheannualrainfallrangesfrom700to900mm (Chandra,2020)andthepotentialevapotranspirationis1337mm(Malesu et al.,2010).
Figure 1:study location:(a) administrative map of Rwanda and (b) google earth map of the site

There are three agricultural seasons in the research area, just like in other parts of Rwanda. Every year, Season A runs fromSeptemberthroughJanuary.SeasonBstartsinMarchandrunsthroughJuly.TheCagriculturalseason,however,runs fromJunethroughAugust.The460hectaresoflandundertheMatimbairrigationsystemarecovered.Farmersweregiven assistancebythegovernmenttoformwaterusersassociations(WUAs)inordertobettermanagetheirirrigationsystems and agricultural operations as the new community-based irrigation plan was being built. The management and development of irrigation plans have benefited greatly from the contributions of such farmers' organizations (Harrison, 2018)
According to the plan, irrigation water is piped to Matimba from a centralized pumping station on the Umuvumba river. ThetotalirrigatedareaunderMaizeis110ha.Thetable1liststhecharacteristicsofirrigationsystemthatwasinstalledat thesite
Table 1: Features of sprinkler irrigation system of the study area
© 2022, IRJET | Impact Factor value: 7.529 | ISO 9001:2008 Certified Journal | Page205

International Research Journal of Engineering and Technology (IRJET) e-ISSN:2395-0056

Volume: 10 Issue: 01 | Jan 2023 www.irjet.net p-ISSN:2395-0072
The Merriam and Keller (1980) technique and the American Society of Agricultural and Biological Engineers (ASABE) standard procedures were used to conduct the field evaluations. The field tests were carried out in 2019 on plots with maizeplantationsduringthedryseason(JulyandAugust).Thefieldmeasurementsexercisewasdonethroughouttheday whenfarmerswereusingirrigationtechniques.Thesitewasrandomlydividedinto4zonesfortheevaluation,whichwas conductedasasingle-lateraltest,andasprinklerpositiononalaterallinewasselectedineachzone.Installingapatternof comparablemetalliccatchcanscontainerswasthetestprotocol.
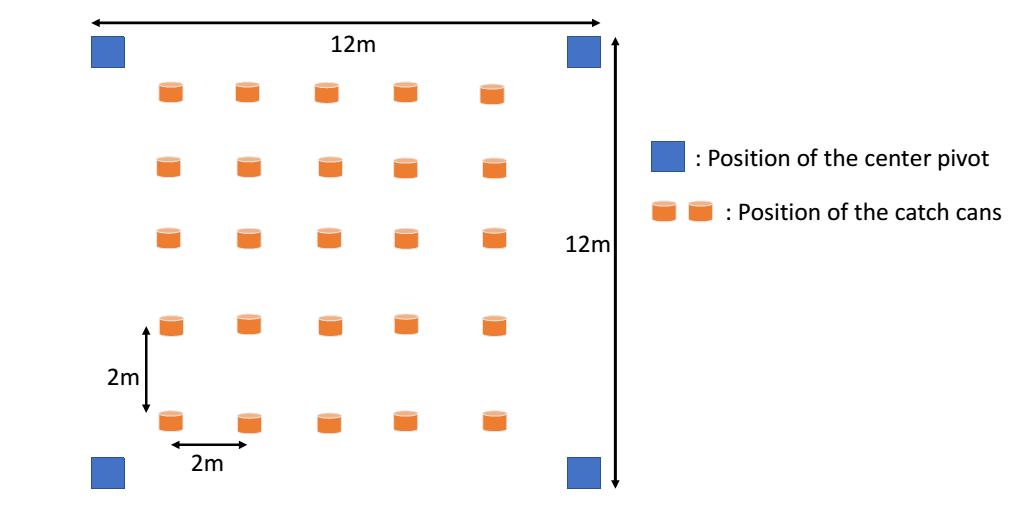
The Catch cans were roughly distributed in a square grid of 2 meters for the square spacing of 12x12 m inside the area surroundedbyfoursprinklers(seefigure2.2).Boththedischargerateandtheoperatingpressureofthesprinklerswere predetermined prior to the start of each test at the hydrant level as well as the pumping station level of the system. The testinvolvedmeasuringthesprinklerheadflowrate,inletpressure,andoutflowpressurealongthelateral.Eachsprinkler lateral that was being examined underwent a test that lasted 30 minutes and reading catch cans took 10 to 15 minutes. Afterthetestwasfinished,agraduatedcylinderwasusedtomeasuretheamountofwaterthathadaccumulatedineach catchcan.Foreverysprinklerlateralevaluated,sameexperimentprotocolswererepeated.
Figure 2: Catch-can experiment system layout ( not on scale)

The different parameters including coefficient of uniformity (CU), distribution uniformity (DU) and discharge efficiency (DE) were calculated (see table 2) to evaluate the center pivot irrigation system performance according to Merrian and Keller(1978)methods.
International Research Journal of Engineering and Technology (IRJET) e-ISSN:2395-0056

Volume: 10 Issue: 01 | Jan 2023 www.irjet.net p-ISSN:2395-0072
Table 2:Performance
Parameter Equation
CU(%) CU=100×( ∑ )
CU=100×( ∑| | ∑ )
Notation
CU:Christiansen’sCoefficientofUniformity
Z: Amount of water measured in each container while testing uniformity(mm,ml)
X= | |: Total absolute value of deviations from average of the amountofwatermeasuredinallaccumulationcontainer(mm,ml). N:Numberofobservations m:Meanquantityofwater(mm,ml)
DU(%) DU= DU:Distributionuniformity Dq:Lowerquartile D:Averagedepth
CUS [ √ ]
CUS:Systemuniformitycoefficient Pn:Theminimumsprinklerpressure(kPa) Ps:Theaveragesprinklerpressure(kPa)
DE(%) DE= DE:Dischargeefficiency do:Averagewaterdepthobservedincatchcans(mm) dd:Averagewaterdischargedbysprinkler(mm)
PAELQ
PAELQ:Potentialapplicationefficiencyatlowquarter : Average depth of irrigation water contributing to the target(mm)
:Thelowquarterirrigationwatertargetdepth(mm)
DPR DPR:Deliveryperformanceratio QA:Actualdischarge QR:Requireddischarge
Theresultsofuniformityindicatorsevaluatedinthestudyareaforsprinklerirrigationsystemarepresentedinthetable3. Obviously, Christiansen’s coefficient (CU) ranged from 82% to 90% in Zone A; B; C &D with mean value of 86% (see figure3).TherewasalsoanincreaseofCUfromzoneAtozoneD.Thedistributionuniformity(DU)rangedfrom76%to92 %withanaverageof84%.Thesystemcoefficientofuniformity(CUS)increasedfromZoneAtozoneDwithameanvalue of83%inallstudyzones.
Table
ZoneC 2.4 2.2 2.3 92 79 87 93 72 83 89 76 84 ZoneD 2.5 2.3 2.4 90 87 88 97 77 88 87 83 85 Average 2.23 2.03 2.13 90 82 86 92 76 84 87 78 83
International Research Journal of Engineering and Technology (IRJET) e-ISSN:2395-0056

Volume: 10 Issue: 01 | Jan 2023 www.irjet.net p-ISSN:2395-0072
ItisclearthattheresultsobtainedinthisstudyforCU,DUandCUSareinaccordancewithresearchfindingsfrom Topaket al.(2005)andKellerandBliesner(1990). As shownin figure3,theCUandDUvaluesofZoneAarelowercomparablyto otherthreezones;andthereasonmaybeattributedtothewinddirectionanditshigheffectinZoneA.However,thezones B; C and D showed the higher values of CU and DU comparably to the first one and this is justified by least wind effect. Generally,DUandCUvaluesdecreasewiththeincrease ofwindspeedandsprinklerspacing.Furthermore,the lowwind speed conditions do not affect the CU significantly (Hills and Barragan, 1998). Referring to the recommendations set by KellerandBliesner(1990)and(MBurtetal.,n.d.)Burtetal.(1997),themeanvaluesofCU(86%)andDU(84%)resulted fromthestudyfallinthedesirablecategory;andthatindicatesagoodperformanceoftheirrigationsystemevaluated Figure 4:Pressure

International Research Journal of Engineering and Technology (IRJET) e-ISSN:2395-0056

Volume: 10 Issue: 01 | Jan 2023 www.irjet.net p-ISSN:2395-0072
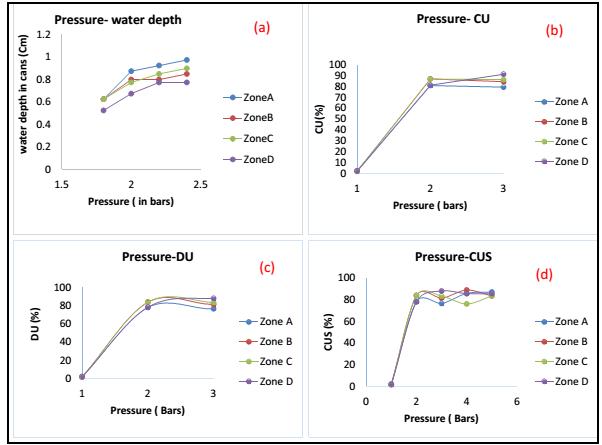
The figure 4 shows the relationship between pressure, water depth and parameters of uniformity Inlet pressure and outletpressureofeachsprinklerlateralevaluatedindifferentfieldzonesweremeasuredtodeterminepressurevariation along laterals. Within this framework, the results showed a correlation between pressure in sprinkler and water depth (Fig4-a).Inaddition,thecorrelationbetweenpressureanduniformityparameters(CU,DUandCUS)wasobserved(Fig4-b, c & d). It is generally accepted that, in order to maintain sufficient uniformity, the limit of discharge varying in different places of laterals should not be above 10% of average discharge because the sprinkler operating pressure impacts the sprinkler discharge rate and amount applied. The pressure variation restrictions shouldn't go over 20% of the average working pressure for better achievement. Greater pressure variation above this threshold would have an impact on the waterdistributionuniformity(DU),causingcertainareasofthesurfacetoreceivemorewaterthanothers.
Table 4: Assessed efficiency indicators in the study area
Evaporat
100 120
ionand wind drift losses (mm) DE (%) PAELQ (%) Actual Required Max Min Avg. ZoneA 1580 1950 0.81 10.87 9.27 1.6 80.5 88.3 73.8 79.5 ZoneB 1695 1950 0.87 11.7 9.03 2.67 86.7 79.9 61.3 72.9 ZoneC 1790 1950 0.92 12.04 10.62 1.42 89.2 97.2 76.3 84 ZoneD 1858 1950 0.95 12.4 10.03 2.37 91.8 88.1 71.7 81 Average 1730.8 1950.0 0.9 11.8 9.7 2.0 87.1 88.4 70.8 79.4 Figure 5: Efficiency indicators in zones of study area
International Research Journal of Engineering and Technology (IRJET) e-ISSN:2395-0056

Volume: 10 Issue: 01 | Jan 2023 www.irjet.net p-ISSN:2395-0072
Evaporation and wind drifts losses
Zone A Zone B Zone C Zone D flow rate compared with water depth
Application rate(mm/hr) Water depth(mm) Evaporation and wind drifts losses
Figure 6: Evaporation and wind drifts losses
Table 5: Results of evaluated variables of the sprinkler system
Evaluated indicator
Calculated value Standard value
CUofthesystem(%) 86 CU>84% (KellerandBliesner,1990)
DUofthesystem(%) 84 75%andabove(Burtetal.,1997)
Operatingpressure(bars) 2.13 3bars
Pressureapplicationefficiencyatlowquarter(PAELQ) 79.4 PAELQ>60%
Averagedischargeofsprinklers(L/hr) 1730.75 1950
Averageapplicationrateofsprinklers(mm/hr) 11.75 13.54mm/hr
Dischargeefficiency(%) 87.05 1
Deliveryperformanceratioofthesystem(DPR) 0.9 1
Theresultsfromfigure5revealthatdischargeefficiency(DE)rangesfrom80.5%to91.8%withameanvalueof87.1%.It is notable that the discharge efficiency variance is wide among the four zones when compared to the average. The outcomesalsodemonstratethatthereisonlyaslightvarianceindischargeefficiencyacrossthethreezones(ZoneB,Zone C and Zone D). Zone A, however, showed a significant variance in discharge efficiency, which can be related to the wind effectthatprevailsthere.Ontheotherhand,theresultsforPotentialApplicationEfficiencyofLowQuarter(PAELQ)inthe four zones taken into consideration for this study, show the significant variability. In figure 6, it is shown that there is a relationshipbetweentherateofwaterdeliverybysprinkler andtheamountofwatercollectedduringthecatch-cantest. Variationsbetweenthetwomeasurementsshowlossesduetoevaporationandwinddrift.Thisequationalsoshowshow the system's operating pressure affects two efficiency metrics, such as the quantity of water to apply and losses due to evaporationandwinddrift.
The highest PAELQ value of 84% was found in Zone C and the lowest Value was observed in Zone B (72.9%) with the systemaveragePAELQvalueof79.4%.BasedonstandardvaluesforsprinklerirrigationasitwassuggestedbyKellerand Bliesner(1990);itisevidentthattheresultsforPAELQarewithintherange(seetable5).
TheTable4demonstratesthatthecomputedaveragesprinkler applicationrate(11.8mm/h)waslessthantheexpected value (13.5 mm/h). Additionally, the measured infiltration rate of a sandy loam soil (see table 6) in the study location (17.2mm/hour) was higher than both the calculated and forecasted application rates. A sandy loam soil infiltration rate shouldbebetween20and30millimetersperhour,accordingtotheliterature.Asaresult,waterprovidedtotheirrigation
International Research Journal of Engineering and Technology (IRJET) e-ISSN:2395-0056

Volume: 10 Issue: 01 | Jan 2023 www.irjet.net p-ISSN:2395-0072
system was completely absorbed into the soil profile and free of runoff, confirming the adequacy of sprinkler system's waterapplicationintensityinthestudyarea.
Table 6: Measured soil infiltration rate in the study area
Depth (cm) Infiltrati onRate (mm/h)
sand (%) silt (%) clay (%)
Texturetextural triangle
FC(%)Pummia (1990)
WP(%)Pummia (1990)
ZA 0-15 17.3 70 16 14 Sandyloam 14 6 15-30 65 29 15 Sandyloam 14 6 30-45 60 21 19 Sandyloam 14 6
ZB 0-15 17.1 72 13 15 Sandyloam 14 6 15-30 68 16 16 Sandyloam 14 6 30-45 63 19 18 Sandyloam 14 6
ZC 0-15 17.1 73 12 15 Sandyloam 14 6 15-30 65 20 15 Sandyloam 14 6 30-45 60 21 19 Sandyloam 14 6
ZD 0-15 17.2 72 12 16 Sandyloam 14 6 15-30 67 18 15 Sandyloam 14 6 30-45 64 19 17 Sandyloam 14 6
Thepressurevariationanalysisrevealedthatastheappliedwaterdepthincreasesproportionallywithworkingpressure, theoperatingpressureofthesystemhadanimpactontheuniformityandquantityofsprinklerapplication.Thesystem's age and nozzle blockage may have contributed to the drop in the value of the discharge. Looking on the quality of water distributedfromthepumpinghousetotheirrigationsystem,itcanbeassumedthatsomeparameterssuchasturbidityare among the contributors of the system efficiency Therefore, they may have affected the discharge drop through malfunctionofsomewaterdistributionequipmentsuchasvalves,junctionsandnozzlesindifferentzonesevaluated
Thedeliveryperformanceratio(DPR)wasmeasuredandfoundtobe0.9.Thisvaluereflectsonsystemefficiencyof90% withanestimated10%lossesfromevaporationandwinddrifts.
Thesefindingsindicatethatthesprinklersystemefficiencyinthestudy areaisgoodandeffectivereferringtoMoldenand Gates (1990) and (Grassini et al., 2011). The efficiency of the system may be increased with proper equipment managementandroutinemaintenance.
It is essential to carry out assessment in the context of system efficiency for the design and planning of inexpensive and sustainable sprinkler irrigation systems in Rwanda. The effectiveness of the sprinkler irrigation system is assessed primarilybasedonitsefficiencyanduniformity.Itisclearthatlowuniformityexhibitspoorefficiency.Insuchconditions, bothenergyandwaterarewastedresultinginpoorwaterproductivityandrevenueatschemelevel. Thestudy'sfindings showed that the distribution uniformity, uniformity coefficient, and system efficiency were 84%, 86%, and 90% respectively.Theseresultsguaranteethatthesprinklersystem'soverallperformance isratedassatisfactory.However, it is advised to correct system operation and to perform regular maintenance of the system in order to achieve optimal system efficiency. Furthermore, there is need to assess water quality from pumping station for preventing problems in functionofwaterdeliveryequipment
Acar,B.,Topak,R.,&Direk,M.(2010).ImpactsofPressurizedIrrigationTechnologiesonEfficientWaterResourcesUsesin Semi-AridClimate of Konya Basinof Turkey. International Journal of Sustainable Water and Environmental Systems, 1(1),1–4.https://doi.org/10.5383/swes.0101.001
International Research Journal of Engineering and Technology (IRJET) e-ISSN:2395-0056
Volume: 10 Issue: 01 | Jan 2023 www.irjet.net p-ISSN:2395-0072
Ahaneku, I. E. (2010). Performance evaluation of portable sprinkler irrigation system in Ilorin, Nigeria. Indian Journal of Science and Technology, 3(7).http://www.indjst.org
Bos, M. G, Methodologies for assessing performance of irrigation and drainage management. Irrigation and Drainage Systems.7(4):p.231-261,1994.
Chandra,A.,Heeren,D.M.,Odhiambo,L.,&Brozović,N.(n.d.). Water-Energy-Food Linkages in Shared Smallholder Irrigation 2 Schemes 3.https://ssrn.com/abstract=4224291
Dechmi,F.E.,CaveroJMFaciaMartínez-Cob,P.J.,PlayánDechmiJCaveroAMartinez-Cob,E.F.,&Faci,J.M.(n.d.). WIND EFFECTS ON SOLID SET SPRINKLER IRRIGATION
Geoffrey, G., Dieu, M. J. de, Pierre, N. J., & Aimable, T. (2015). Design of Automatic Irrigation System for Small Farmers in Rwanda. Agricultural Sciences, 06(03),291–294.https://doi.org/10.4236/as.2015.63029
Grassini,P.,Yang,H.,Irmak,S.,Thorburn,J.,Burr,C.,&Cassman,K.G.(2011).High-yieldirrigatedmaizeintheWesternU.S. Corn Belt: II. Irrigation management and crop water productivity. Field Crops Research, 120(1), 133–141. https://doi.org/10.1016/j.fcr.2010.09.013
Harrison,E.,&Mdee,A.(2018).Entrepreneurs,investors,andthestate:thepublicandtheprivateinsub-SaharanAfrican irrigation development. Third World Quarterly, 39(11), 2126–2141. https://doi.org/10.1080/01436597.2018.1458299
Howell,C.R.(2003)MechanismsEmployedbyTrichodermaSpeciesintheBiologicalControlofPlantDiseases:TheHistory andEvolutionofCurrentConcepts.Plantdisease,87,4-10.https://doi.org/10.1094/PDIS.2003.87.1.4
Kannan, N., Jeong, J., & Srinivasan, R. (2011). Hydrologic Modeling of a Canal-Irrigated Agricultural Watershed with Irrigation Best Management Practices: Case Study. Journal of Hydrologic Engineering, 16(9), 746–757. https://doi.org/10.1061/(asce)he.1943-5584.0000364
KellerJandBleisnerRD(2000)Sprinklerandtrickleirrigation.Theblackburnpress,Caldwell,NJ.p:652.
Keller,J.,&Bliesner,R.(1990).SprinklerandTrickleIrrigationVonNostrand-ReinholdNewYork:NY
MBurt,B.C.,Clemmens,A.J.,StrelkotT,T.S.,Solomon,K.H.,Bliesner,R.D.,Hardy,L.A.,Howell,T.A.,&Eisenhauer,D.E. (1997.). Irrigation Performance Measures: Efficiency and Uniformity
Majoro, F., Mukamwambali, C., Shumbusho, J. D. U., & Hagenimana, E. (2016). Environmental Impacts Investigation of IrrigationProjects:CaseStudyofKanyonyombaRicePerimeterinRwanda. Journal of Water Resource and Protection, 08(07),687–696.https://doi.org/10.4236/jwarp.2016.87056
Majumdar S.P., Meena R.L., Baghel G.D.S.Effect of levels of compaction and potassium on yield and quality of tomato and chillicropsgrownonhighlypermeablesoils
Malesu, M.M., Raymonds, O.A., Cherogony, K., Douglas, N., Charles, G., Kipngetich, B.E., Mogoi, J., et al. (2010) Rwanda IrrigationMasterPlan.Report,MinistryofAgricultureandAnimalResources,Kigali.
Maroufpoor,E.,Faryabi,A.,Ghamarnia,H.,&YaminMoshrefi,G.(2010).EvaluationofUniformityCoefficientsforSprinkler Irrigation Systems under Different Field Conditions in Kurdistan Province (Northwest of Iran). In Soil & Water Res (Vol.5,Issue4).
Merriam, J., Shearer, M., & Burt, C. (1980). Evaluating irrigation systems and practices. Evaluating irrigation systems and practices.,721-760.
Merriam, J.L. and Keller, J. (1978) Farm Irrigation System Evaluation: A Guide to Management. Utah State University, Logan,Utah.
MoldenD.J.andGates, T.K.(1990)Performancesmeasuresfor evaluationof irrigationwater deliverysystems. Journal of IrrigationandDrainage,116,804-823.dx.doi.org/10.1061/(ASCE)0733-9437(1990)116:6(804).
2022, IRJET | Impact Factor value: 7.529 | ISO 9001:2008 Certified Journal | Page212

International Research Journal of Engineering and Technology (IRJET) e-ISSN:2395-0056

Volume: 10 Issue: 01 | Jan 2023 www.irjet.net p-ISSN:2395-0072
Msibi, T., Kihupi, N., Tarimo, A., & Manyatsi, A. (2014). Climate-smart Agriculture View project Constrains, Production Systems and Roles of Phosphorus in Rice Production in Tanzania View project.http://www.ijasber.com
Mutambara, S. (2016). Smallholder irrigation farmers’ financial exclusion in Zimbabwe: A resilience threat. International Journal of Agricultural Policy and Research, 4(8),256–270.https://doi.org/10.15739/IJAPR.16.027
Narayanan, K. (2014). Impact of Participatory Irrigation Management - Case Study: Cocurirwa Cooperative, Rwamagana Rice Project, Rwanda. Advances in Plants & Agriculture Research, 1(3). https://doi.org/10.15406/apar.2014.01.00013
Ngasoh, F. G., Anyadike, C. C., Mbajiorgu, C. C., & Usman, M. N. (2018). Performance evaluation of sprinkler irrigation system at Mambilla beverage limited, Kakara-Gembu, Taraba state-Nigeria. Nigerian Journal of Technology, 37(1), 268.https://doi.org/10.4314/njt.v37i1.35
NoreldinT,OudaS,MounzerO,AbdelhamidMT.CropSystemmodelforwheatunderdeficit irrigationusingsprinklerand dripirrigationin sandy soil. JournalofWaterandLandDevelopment.2015;26:57-64)
Salmerón, M., Urrego, Y. F., Isla, R., & Cavero, J. (n.d.). Effect of non-uniform sprinkler irrigation and plant density on simulated maize yield 1 2.
Topak et al. (2005). Performance evaluation of sprinkler irrigation in a semi-arid area. Pakistan Journal of Biological Sciences (8) 1:97-103, 2005
Urujeni, S.,&Chrysostome, J.(2015).Economic Valuationof Irrigation Waterin SmallholderFarmingSystem inRwanda: TheCaseofKibaya-CyunuziScheme.In International Journal of Agriculture Innovations and Research (Vol.4,Issue1).