
International Research Journal of Engineering and Technology (IRJET) e-ISSN:2395-0056
Volume: 12 Issue: 01 | Jan 2025 www.irjet.net p-ISSN:2395-0072


International Research Journal of Engineering and Technology (IRJET) e-ISSN:2395-0056
Volume: 12 Issue: 01 | Jan 2025 www.irjet.net p-ISSN:2395-0072
Advaith A1, Aditya Saiprasad2, Ansh Srivastava3, Dr. Manas M N4
1Dep. Of Computer Science and Engineering, RVCE Bengaluru
2Dep. Of Computer Science and Engineering, RVCE Bengaluru
3Dep. Of Computer Science and Engineering, RVCE Bengaluru
4Dep. of Computer Science and Engineering, RVCE Bengaluru
Abstract - This technique is a combination of LSTM neural networks and time series analyses of the Prophet in order to predict three commodity markets for the year 2015-2024-the hybrid prediction framework. Risk measures are integrated into the rolling window analyses-VaR, CVaR, and maximum drawdown-which help in calculating volatility and in cross-asset correlation analysis.While the LSTM model captures short-range dynamics in price movements, Prophet identifies long-term trends. The empirical results sufficiently confirm the approach in independently assessing price movements over five years, thus producing findings that would be valuable to market participants. The work presents a novel hybrid model for predicting multiple assets that incorporate consideration of marketconditionsandgranularityofthedataused.
Key words: commodity markets, price prediction, LSTM, Prophet, hybrid modeling, risk metrics, deep learning, time seriesanalysis
The very nature of financial markets comprises intricate dynamics that are a composite of several diverse macroeconomic, geopolitical, and other market-specific factors.
Financial markets operate in an extremely complex manner. Their price formation is affected by macroeconomic factors, geopolitical events, and marketspecific ones. Accurate prediction of price movements is necessary for the management of various portfolios, for riskassessment,andforinvestmentstrategies.Traditional financial models, like autoregressive integrated moving average (ARIMA) and generalized autoregressive conditional heteroskedasticity (GARCH), were extensively applied to time series forecasting. However, these methods usually fall short when capturing nonlinear dependencies, long-range memory effects, and regime shifts in market data[1]. Hybrid forecasting mechanisms constructed through statistical time series analysis and neural networks for enhancing forecast accuracy have been drastically improved through the advancement of machine learning and deep learning. RNNs and LSTMs have been useful in capturing sequential dependencies in financial time-series applications [2]. Furthermore, there
are slow and steady applications of statistical methods including Prophet, which was originally developed for time-series forecasting with seasonal and trend components,inthesteadilyFinMarkets[3].
The research study concerned here investigates hybrid forecasting through the LSTM neural network and the Prophetmodelwiththeaimofimprovingpriceprediction accuracyfordifferentassetclasses.Theseassetclassesare Bitcoin, the S&P500 Index, and Gold, which vary in terms of market volatility and behaviors. Our study covers a nine-year period (2015-2024) employing high-frequency trading data to certify themselves against the various marketconditionsthattheyexperienced.
In addition to enhancing predictive accuracy, this study introducesanimprovedriskassessment frameworkusing aValueatRisk(VaR)modelingapproach.:
We proposed a hybrid framework for forecasting multi-asset price movements using deep learning (LSTM)andstatisticalmodeling(Prophet).
To empirically validate our framework, we obtained and tested it using high-frequency tradingdataovernineyearstocoverawidearray ofmarketconditionsandasset-specificbehavior.
The assessment of model performance consideringriskbyVaR,CVaR,anddrawdownisa measure of the strength of the working model acrossvariousmarketregimes.
Interpretability analysis along with other visualizations is offered by comparing history with forecast price movementsandconfidenceintervals.
Accurate financial forecasting requires vast knowledge of market behavior, statistical properties, and risk factors. The present section affirms the dataset analysis, with the study of descriptive statistics, risk assessment metrics, and market regime classification. It provides insights into thenatureofBitcoin,S&P500,andGoldbasedonsomeof the key indicators, namely, mean returns, volatility, skewness, kurtosis, and risk-adjusted performance measures.

International Research Journal of Engineering and Technology (IRJET) e-ISSN:2395-0056
Volume: 12 Issue: 01 | Jan 2025 www.irjet.net p-ISSN:2395-0072
One basic step of financial modeling is to study the statisticalpropertiesofassetreturns.From2015to2024, the average returns, standard deviation, skewness, and kurtosis for Bitcoin, S&P 500, and Gold are listed in Table I.
MeanReturn:Thisindicatestheaveragedailyreturnofthe asset during the study period, where Bitcoin has the highest mean return (0.225%) while Gold, the lowest (0.017%).
Standard Deviation: This indicates the measure of volatility, so higher values would mean greater price movements. Bitcoin is most volatile (3.65%) while Gold hadleastvolatility(0.74%).
Skewness: This is concerned with the asymmetry of the return distributions; a negative skew (say-0.58 for S&P 500) indicates a greater probability of extreme negative returnswhilenear-zeroskewnessforexampleGold(0.03) wouldindicaterelativelybalanceddistribution.
Kurtosis: This refers to how heavy-tailed return distributions really are. Higher kurtosis means greater chancesofextremepricemovement.TheS&P500hasthe highestkurtosis(22.43),withtheimplicationthatextreme events occur with higher-than-normal frequency (in a normaldistribution,kurtosisequals3).
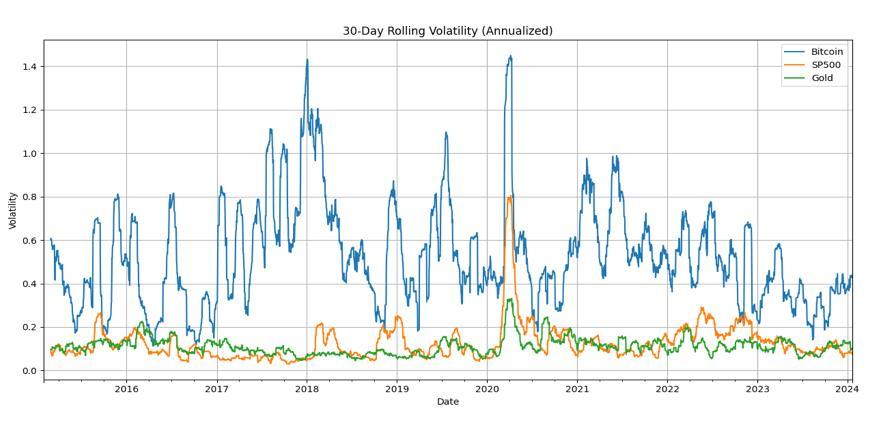
Chart -2:30DayRollingVolatility
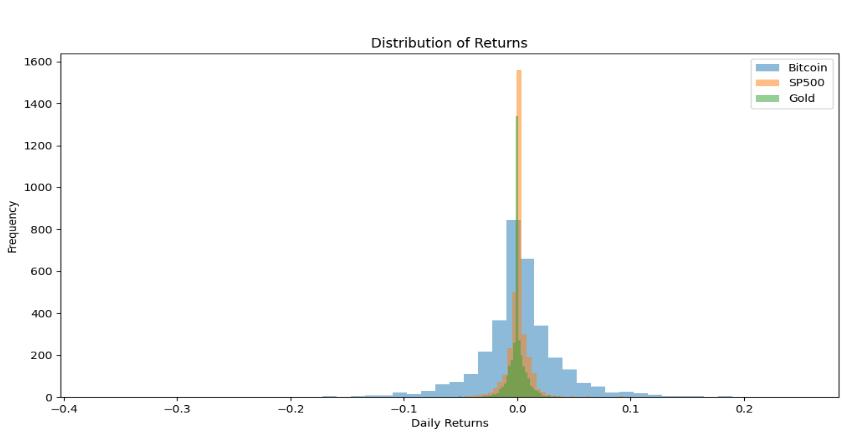
Chart -3:DistributionofReturns
2.2. Risk Metrics and Performance Indicators
The Risk Assessment for each of these assets is studied through Value at Risk (VaR), Conditional Value at Risk (CVaR), Maximum Drawdown (MDD), Sortino Ratio, and Information Ratio. These are the indicators that actually tell in detail about the downside risk of each asset and risk-adjustedperformance.
1)ValueatRisk(VaR)-
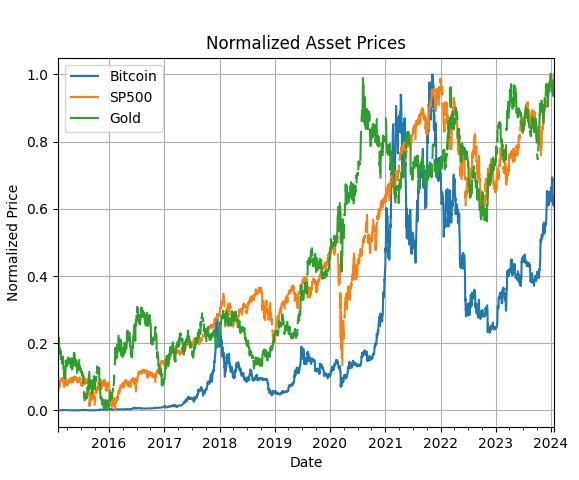
Table-1:DescriptiveStatisticsofDailyReturns Chart -1:NormalizedAsset
VaR assesses the maximum expected loss (over a given time horizon, i.e., one day in this instance) with 95% confidence. For example, for Bitcoin, -5.73% would imply that there exists a 5% probability that its loss in one day exceeds 5.73% or more. It, therefore, means Bitcoin exhibited maximum downside risk, while Gold showed it theleast.
2)ConditionalValueatRisk(CVaR)-
CVaR, known among financial analysts as the Expected Shortfall, estimates the average loss once the loss crosses over the absorbent VaR threshold. Since it is extreme losses that define more importance in assessing risk than that which comes from the standard parametric assumption,thusCVaRismoresuitablefortailevents.The -8.56% for Bitcoin means that when losses are the worst, that is, when losses exceed the loss amount considered in VaR, Bitcoin's average loss would become 8.56%, which

International Research Journal of Engineering and Technology (IRJET) e-ISSN:2395-0056
Volume: 12 Issue: 01 | Jan 2025 www.irjet.net
drags the average losses onto a comparatively higher returnforS&P500andGold.
3)MaximumDrawdown(MDD)-
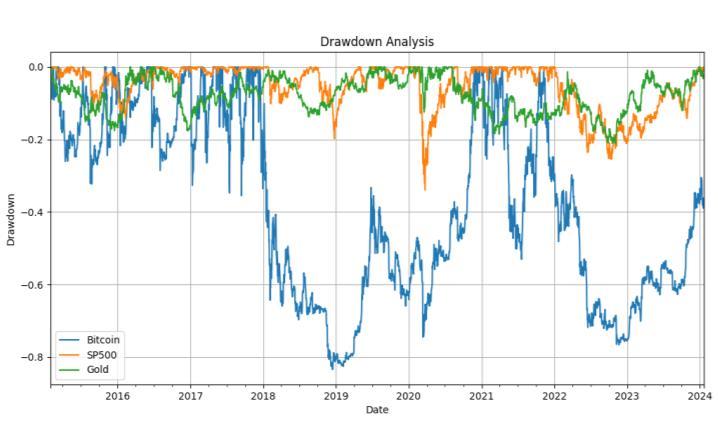
MDDdescribesthegreatestobserveddeclinefrompeakto trough in the value of an asset. Bitcoin registered the highest MDD of (-83.4%), meaning that its price fell by 83.4% from its highest point before recovering. This speaksforBitcoin'shigh volatilityrelativeto the S&P500 (-33.9%)andGold(-21.2%).
4)SortinoRatio
The Sortino ratio measures risk-adjusted return, but it considers only one side of volatility, i.e., downside, while the Sharpe ratio takes account of volatility on both sides, i.e., gains and losses. So, a higher Sortino ratio value indicates higher return per unit of downside risk. Thus, Bitcoin, with the highest Sortino ratio, of 1.24, has the highest risk-adjusted return, while gold has the lowest of 0.23. The implication is that Bitcoin, despite its volatility, compensatesmoreforthatrisk.
5)InformationRatio
The information ratio measures the excess return of an asset over and above that of a benchmark (S&P 500) against the risk of that excess return. In this regard, it is interesting to note that Bitcoin has a positive information ratio of 0.86, which means it has beat the benchmark relativetoitstrackingerror.Andgold,onthecontrary,has a negative information ratio of -0.19, which shows underperformance.
Table-2:RiskMetricsandPerformanceIndicators
Var(95%) -0.057251 -0.014159 -0.011629
CVar(95%) -0.085576 -0.024261 -0.017655
MaxDrawdown -0.833990 -0.339250 -0.212074
SortinoRatio 1.244850 0.388613 0.236186 Information Ratio 0.859553 NaN -0.192842
p-ISSN:2395-0072
In financial markets, volatility regimes used for classification typically fall into the categories of low, medium, and high volatility phases. Analysis of the recent individual market conditions for Bitcoin, S&P500 & Gold has been performed through rolling windows of 21 days byquantileclassification.
The classification shows that the S&P500 changed from low-volatilitytomedium-volatility,whileBitcoinandGold remained firmly in the medium-volatility classification range. These classifications are essential to bring to light market calm periods versus havoc periods, which help in riskmanagementandforecasting.
Table-3:MarketRegimeClassification(Last5Periods)
2024-01-17
2024-01-19
2024-01-20
2024-01-21
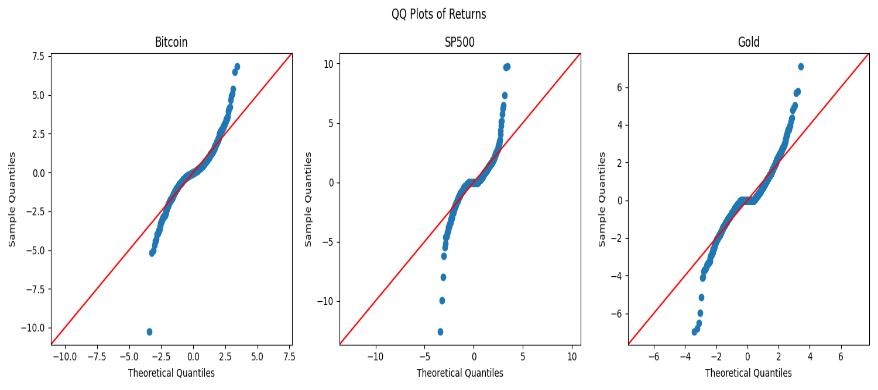
Chart -5:QQPlots

International Research Journal of Engineering and Technology (IRJET) e-ISSN:2395-0056
Volume: 12 Issue: 01 | Jan 2025 www.irjet.net p-ISSN:2395-0072
Bitcoinexhibitsthehighestvolatilityandrisk,but alsothehighestrisk-adjustedreturns.
TheS&P500,despitelowervolatility,experiences significant tail events, as reflected in its high kurtosis.
Goldistheleastvolatileassetbutprovideslimited returnscomparedtoBitcoinandtheS&P500.
Regime analysis suggests a shift in volatility trends, with the S&P 500 recently moving into a mediumvolatilitystate.
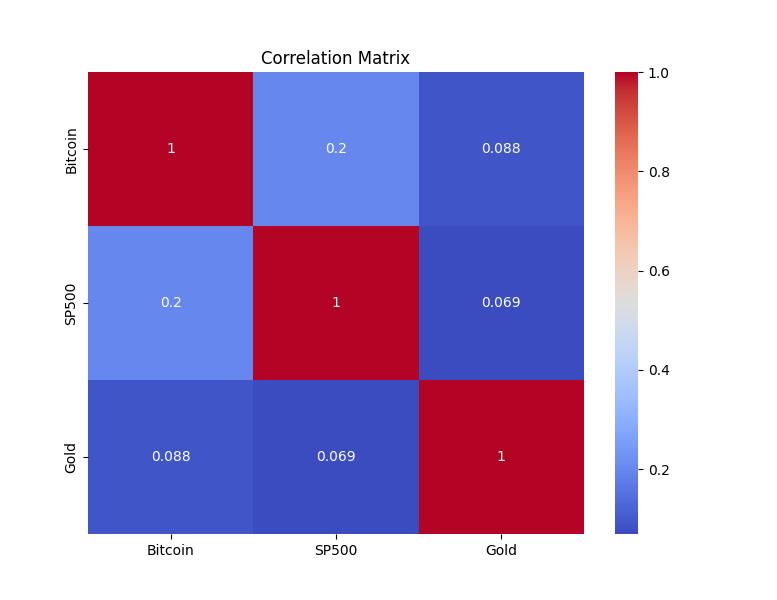
Chart -6:CorrelationMatrix
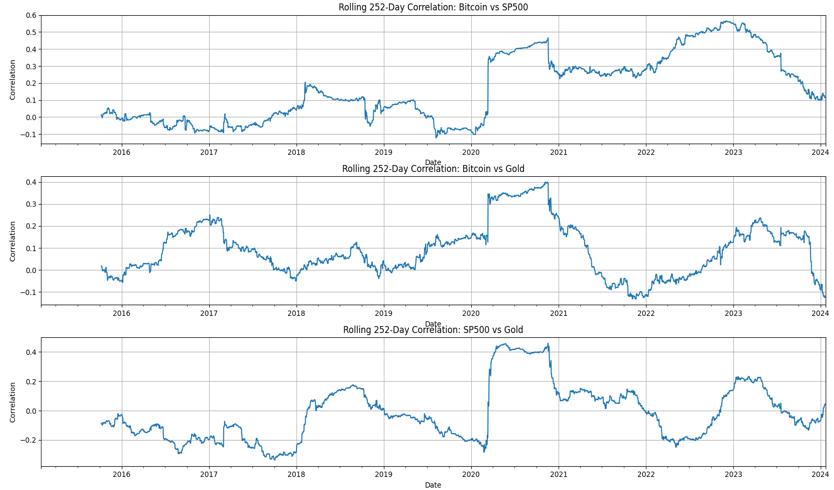
Chart -7:RollingCorrelation
4. CONCLUSIONS
The present work detailed a hybrid forecasting model combining LSTM and Prophet toward the goal of improving multi-asset price predictions. The analysis covers Bitcoin, S&P 500, and Gold over a period of nine years, successfully capturing short-term volatility as well aslong-termtrends.
Results point to Bitcoin having high volatility and riskadjusted returns; the S&P 500markssignificanttail risks; and Gold renders stability with lower returns. Risk
measures such as VaR and MDD confirmed the same observations. These five-period forecasts still indicate variability, with Bitcoin having the widest confidence intervals.
This study illustrates the viability of hybrid models in forecasting financial markets. Future research will enhance accuracy by introducing macroeconomic variablesandstate-of-the-artneuralnetworkmechanisms to support risk-aware decision-making on the part of the investors.
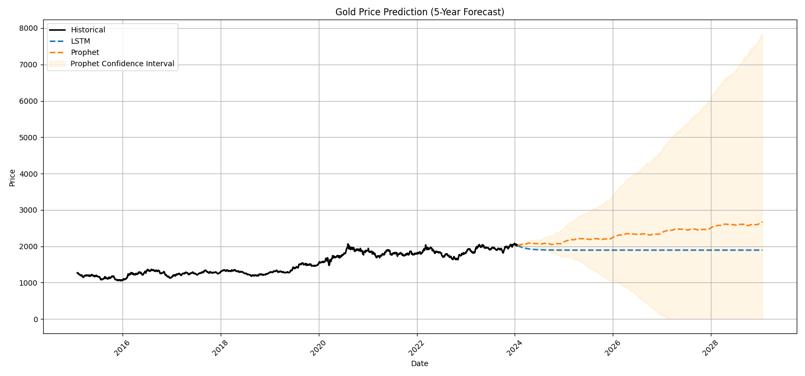
Chart-8: 5yearForecastforGold
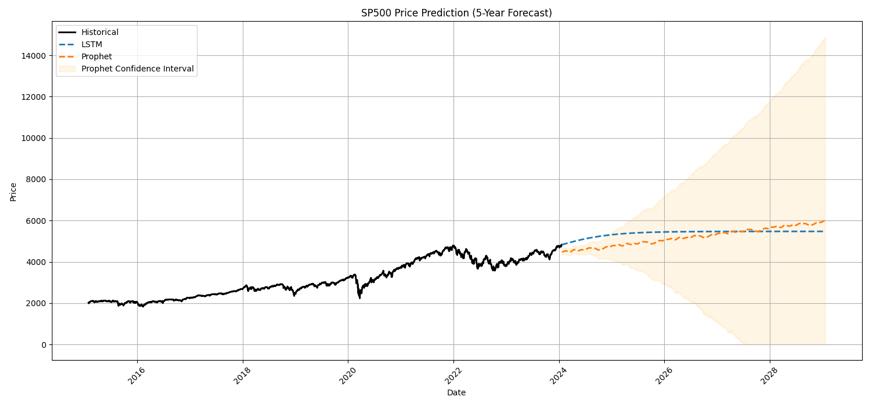
Chart-9: 5yearForecastforS&P500
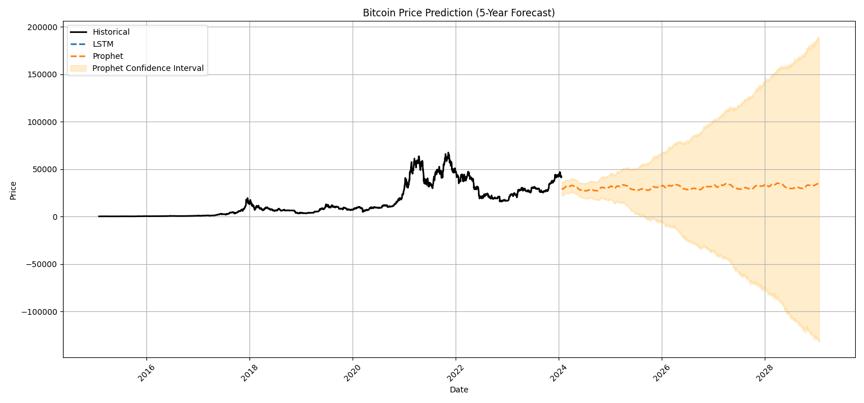
Chart -10: 5yearForecastforBitcoin
[1] Commodity Price Forecasts, Futures Prices and Pricing Models, Gonzalo Cortazar, Cristobal Millard, Hector Ortega, and Eduardo S. Schwartz, NBER

International Research Journal of Engineering and Technology (IRJET) e-ISSN:2395-0056
Working Paper No. 22991, December 2016, JEL No. G13,G17
[2] ForecastingCommodityPricesUsingLongShort-Term Memory Neural Networks, 2021. [Online] arXiv:2101.03087[q-fin.ST]R.]
[3] Sun, C.; Pei, M.; Cao, B.; Chang, S.; Si, H. A Study on AgriculturalCommodityPricePredictionModelBased on Secondary Decomposition and Long Short-Term Memory Network. Agriculture 2024, 14, 60. https://doi.org/10.3390/agriculture14010060
[4] Amoah, Cosmos. (2021). Interconnectedness between Commodity Futures and Spot Prices: A Comparative Analysis between Ordinary Least Square (OLS) and Quantile Regression (QR). Technology and Investment.12.151-167.10.4236/ti.2021.123009.
[5] Saeed, N., Shafi, I., Pervez, S.et al.Intelligent Decision Making for Commodities Price Prediction: Opportunities, Challenges and Future Avenues.Comput Econ(2025). https://doi.org/10.1007/s10614-024-10837-5
[6] Predicting Commodity Prices: A Neural Networks Approach to Improve Forecasting, 2024. [Online]. Available:https://www.m-hikari.com/ams/ams2024/ams-5-8-2024/p/vairoAMS5-8-2024.pdf
[7] Forecasting Prices of Agricultural Commodities using Machine Learning for Global Food Security: Towards Sustainable Development Goal 2, Anket Patil, Dhairya Shah,AbhishekShahRadhika,Kotecha4,AnketPatilet al./IJETT,71(12),277-291,2023
[8] Ojeda-Beltran, A., De-La-Hoz-Franco, E., EscorciaGutierrez, J. (2024). Decomposition Models forAgricultural Commodity Price Time Series: AComparative Research. In: Duque-Méndez, N.D., Aristizábal-Quintero,L.Á.,Orozco-Alzate,M.,Aguilar,J. (eds) Advances in Computing. CCC 2024. Communications in Computer and Information Science, vol 2208. Springer, Cham. https://doi.org/10.1007/978-3-031-75233-9_17
Volume: 12 Issue: 01 | Jan 2025 www.irjet.net p-ISSN:2395-0072 © 2025, IRJET | Impact Factor value: 8.315 | ISO 9001:2008
| Page