25 minute read
2. Major natural disasters and their socio-economic consequences


Until recently, significant national and international humanitarian efforts aimed both at reducing disaster risk and responding appropriately post-disaster, have not directly dealt with land tenure rights and property issues. These issues appear to be critical to the improvement of the planning and management of land use and other natural resources in areas vulnerable to natural disasters. The inadequate responses to date have been caused in part by a lack of clear understanding of the importance of such issues in the context of natural disasters. This work aims to depens the understanding of these issues in context of Land tenure in the Philippines.
1.1 Vulnerability to Natural Hazards
Advertisement
The Philippines is the second largest archipelago in the world, consisting of over 7000 islands, clustered in three major island groups (Luzon, Visayas and Mindanao), with a total land area of 300 000 km2. Its location in the northwestern Pacific Ocean places the country directly in the path of the world’s number one tropical cyclone generator, which brings destructive floods, landslides and storm surges. It also sits on the edge of the ‘Pacific Ring of Fire’, thereby experiencing periodic earthquakes and volcanic eruptions (CDRC, 1992; Duque, 1991). The combination of these two factors – ‘being in an area of frequent tropical cyclones and being at the junction of several tectonic plate boundaries’ (World Bank and NDCC, no date) – makes the Philippines the fourth most disaster-prone country in the world, according to the International Red Cross.
GEOPHYSICAL HAZARDS The geologic and tectonic settings of the Philippines are characterized by: (i) being located on two of the seven major tectonic plates – the Pacific Plate and Eurasian Plate – in the Earth’s lithosphere (ii) having a major fault zone – the Philippine Fault Zone – cutting across the entire archipelago, and (iii) being subjected to periodic interaction of the different plates, displacements along the Philippine Fault Zone, and movements along other active faults. These factors combine to account for the country’s vulnerability to natural hazards such as earthquakes, volcanic eruptions, tsunamis and landslides.
There are about 220 volcanoes in the Philippines, of which 22 are considered active. The country’s most active volcanoes in terms of damage caused by eruptions are Mayon, Taal, Hibok–Hibok, Bulusan, Canlaon and Pinatubo. Volcanic eruptions are often characterized by the emission of fine ash and ashladen gas forming huge clouds, including rocks, and the subsequent mudflows and landslides. Mudflows and landslides at times occur for an extended period of time after the eruptions. For instance, 16 years after Mount Pinatubo erupted in June 1991, the effects of mudflows or lahars from its slopes continue to threaten the rehabilitation of the 364 affected barangays1 in 23 cities and towns within five provinces (Zambales, Pampanga, Tarlac, Nueva Ecija and Bulacan) in the Central Luzon Region. Lahars from the gullies of Mount Mayon also continue to destroy settlements and farmlands in one city and seven municipalities in Legazpi City, Albay, during tropical cyclones. A more recent project by the Manila Observatory (2005) on mapping the Philippines’ vulnerability to disasters identifies the top ten provinces most at risk to volcanic eruption. These are either the sites of the most active or potentially-active volcanoes, or their land areas are small and can therefore be affected entirely by an eruption. The ten provinces are Camiguin, Sulu, Biliran, Albay, Bataan, Sorsogon, South Cotabato, Laguna, Camarines Sur and Batanes.
Earthquakes are another major geophysical hazard that affects the Philippines. These are either tectonic or volcanic in origin. Tectonic earthquakes are found to be more destructive than volcanic ones. From 1970 to 2004, there were 26 033 plotted earthquakes reported by the Philippine Institute of Volcanology and Seismology (PHIVOLCs), with an average of 744 mild
FIGURE 1 – Magnitude of Destructive Earthquakes1 1968-2003
Magnitude
9 8 7 6 5 4 3 2 1 0
68 73 76 83 90 94 96 99 02 03 Year
Note: 1990 figure is average of 3 earthquake magnitude.
events occurring per year (OCD–NDCC, no date). By 1991, an average of five earthquakes per day occurred in the country. During the next 13 years (1992–2004), a slight increase to six a day was recorded (PHIVOLCS, no date). A total of 12 destructive earthquakes, with an average magnitude of 6.7 on the Richter scale, were reported by PHIVOLCS and OCD–NDCC. Of these, six major earthquakes occurred in Luzon, and three each in Visayas and Mindanao. The ten provinces most at risk of earthquakes – due to the presence of or their nearness to active faults and trenches – include Surigao del Sur, La Union, Benguet, Pangasinan, Tarlac, Pampanga, Ifugao, Davao Oriental, Nueva Vizcaya and Nueva Ecija (Manila Observatory, 2005).
Tsunamis are often caused by volcanic eruptions and earthquakes (at magnitude 7 or above on the Richter scale), although most tsunami occurrences in the Philippines since 1603 have been generated by local earthquakes. The proximity of Southern Mindanao to Celebes Sea, where undersea earthquakes frequently occur, makes this part of the country most vulnerable to tsunamis. Three of the ten provinces most at risk to tsunamis are located in Southern Mindanao, namely Sulu, Tawi–tawi and Basilan. The high vulnerability of Sulu and Tawi–tawi to tsunamis is attributed to the following factors: (i) their location between two nearby trenches (Sulu Trench and Cotabato Trench), and (ii) their high population densities. The other provinces most at risk to tsunamis include Batanes, Guimaras, Romblon, Siquijor, Surigao del Norte, Camiguin and Masbate (Manila Observatory, 2005).
Landslides occur because of the geological instability of a hill or mountain slope when there is an earthquake and/or heavy rain, as well as human activities such as logging and mining. Most of the country’s provinces, except Palawan, are at risk of earthquake-induced landslides. From 1981 to 2006, the government monitored 194 landslide incidents (Figure 2), or an average of eight incidents annually (OCD, no date). The provinces most at risk to landslides are Ifugao, Lanao del Sur, Sarangani, Benguet, Mountain Province, Bukidnon, Aurora, Davao del Sur, Davao Oriental and Rizal (Manila Observatory, 2005).
Perhaps unsurprisingly, provinces such as Sulu, Camiguin, Ifugao, Davao Oriental, Sarangani, Benguet, Surigao del Sur and Lanao del Sur, which rank highly as regards their combined risk to the four major geophysical hazards (Manila Observatory, 2005), are also the areas with a High Poverty Incidence Rating (NSCB and World Bank, 2005). Correlation between the composite geophysical risk maps and land use maps of these provinces, made by Manila Observatory, shows that the very high risk areas are plantations and dipterocarp forests, which serve as a source of livelihood for local communities.
FIGURE 2 – Landslide Incidents, 1981-2006
20
Year
Number of Incidents 15
10
5
0
198182838485868788899091929394959697989900010203040506
Number of Incidents 6 5 3 4 5 3 8108 4 1 7 7 8 8 17 1414913 7 812 13 CLIMATE- AND WEATHER-RELATED HAZARDS The majority of climate- and weather-related hazards in the Philippines include tropical cyclones, floods, storm surges, tornadoes and droughts (Figure 3). Tropical cyclones (or typhoons, as they are commonly known in the Philippines) are regarded as the most destructive of all natural hazards in terms of a number of factors: (i) the number of people affected (ii) the total value of the damage they cause (iii) their frequent occurrence (iv) the size of the areas they affect, and (v) the high exposure and vulnerability of affected communities and households. During the 17 years from 1990 to 2006, 303 tropical cyclones occurred in the Philippines’ area (Figure 3), amounting to an annual average of 18 cyclones (a little lower than the 19–20 cyclones recorded from 1948 to 2006). However, the greatest number of cyclones took place in 1993, when the country recorded 32, of which six were considered ‘most destructive’ by the National Disaster Coordinating Council (NDCC).
Areas frequently and hard hit by tropical cyclones are the Northern Luzon, South-eastern Luzon and Eastern Visayas (Manila Observatory, 2005), which face the Pacific Ocean. Tropical cyclones are less frequent in Western Visayas and Northern Mindanao, and rare in Southern Mindanao (CDRC, 1992). In the Philippines, the typhoon season may start as early as April or May and last until December or January, with most of the destructive cyclones usually occurring in the months of July, August and September. However, in recent years, destructive typhoons hit the country mainly in the last quarter of the year.
Tropical cyclones combined with heavy rains often produce flooding and flashfloods. In the Philippines several factors trigger the occurrence of floods: •Expanding housing and settlement areas (both planned and unplanned) in the valleys, flood plains and delta throughout the country – these generally run a grave risk of disaster due to their location; •The absence of effective vegetative cover – resulting from past and present clearing of the forests, watershed areas, hill and mountain slopes, and successive changes in land use; •Siltation of the river systems – resulting from environmental degradation caused by anthropogenic activities such as unsustainable upland farming practices and large infrastructure projects; •Inadequacy of drainage systems, particularly in many low-lying municipalities and cities; •Subsidence of low coastal areas along the Manila
Bay, such as Caloocan, Malabon, Navotas, Valenzuela and several towns in Bulacan, Pampanga and Bataan.
The recorded sea-level rises are one meter over the last 30 years – or ten times the rate of global sea-level rise in the last century – caused by the rapid rise of water levels at the Manila Bay due to high extraction of groundwater by a growing population as well as economic activity (UP–NIGS, no date); •Rising occurrence of persistent torrential monsoon rains, more than the areas’ average annual precipitation, as observed in the Ormoc flashflood of 1991, the Camiguin flashflood of 2001, and the
Aurora–Quezon–Nueva Ecija floods of 2004.
Between 1990 and 2006, 175 flood occurrences (Figure 3), or an average of about ten per year, have been reported (NDCC–OCD, no date; ADRC, 2002). From 2002 to 2006 the Philippines witnessed drastic increases in the occurrence of floods, even exceeding the flooding caused by tropical cyclones in most years. This indicates the increasing vulnerability of many low-lying and near-river settlement areas to the incidence of frequent and destructive floods, resulting from persistent moderate to heavy rains. Major floodprone areas identified by the MGB–DENR (Conda, 2007) are in Northern and Central Luzon (Pampanga, Nueva Ecija, Pangasinan, Tarlac, Bulacan, Llocos Norte), Metro Manila, Southern Luzon (Oriental Mindoro) and Mindanao (Maguindanao, North Cotabato). However, the recent flood records show more extensive areas affected, covering the entire archipelago.
Storm surges and tornadoes are other key climateand weather-related hazards that cause extensive damage, but a complete time series data on their occurrences and effects for the period 1990–2006 is not readily available. Data on storm surges (1990–2000) for the country was obtained from the ADRC’s 20th Century Asian Natural Disasters Data Book, published in 2002, while that on tornadoes came from NDCC’s Tornado Incidents monitored from 2000 to 2006. Region XII (SOCCSKSARGEN) – particularly the provinces of South Cotabato, North Cotabato, Sultan Kudarat – in Mindanao is the area most at risk to tornadoes, having been hit 20 times from 2000 to 2006, followed by Western Visayas provinces (Negros Occidental, Capiz and Antique) which experienced eight tornado incidents during the same period.
FIGURE 3 – Climate/Weather-Related Hazard Occurrences, 1990-2006
40
Number of Incidents
35
30
25
20
15
10
5
0 Year
90 91 92 93 94 95 96 97 98 99 00 01 02 03 04 05 06
Tropical cyclones 201916322516171411161717131525 17 13 Floods Storm surges/tidal waves Tomadoes Droughts 5 2 2 32 6 1 4146184023 33 16 1 1 1 21125 6 1 1 1 1
BOX 1 – THE ORMOC FLOOD OF 1991
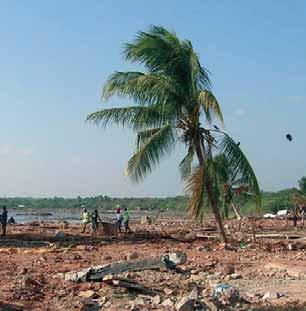
On 4 November 1991, according to CDRC (1992), ‘a combination of flashfloods and landslides killed about 8000 people in Leyte and Samar at the height of storm Uring (International Codename: Thelma). In Ormoc, the floodwaters swept down barren mountainsides and ruined 90 percent of the city, including bridges, schools, buildings and homes. The disaster affected 224 904 people in the Visayas… Total crops and property damages reached PhP 736 million (about $ 17 million).’
‘A comparatively weak tropical cyclone at 75 kph, Uring was particularly destructive because of the massive deforestation in Ormoc, abetted by other factors like topography and a six-hour non-stop torrential downpour. Typhoon Uring dumped 140.2 mm of rainfall, an unprecedented event which occurs only once in 50 years.’
Source: ADRC, 1992. Disasters: The Philippine Experience.
©FAO/P. Johonson
If tropical cyclones and floods are more frequent in the Philippines, so in more recent years are droughts, although complete information on this latter hazard is not readily available. Many scientists and researchers have increasingly linked the occurrence of droughts to climate change issues (Greenpeace, 2007; Jose and Cruz, 1999), indicating their effects to be more widespread and devastating, particularly to agriculture which supports the primary livelihoods of two-thirds of Filipinos living in rural areas. Based on the three drought incidents reflected in Figure 3, the areas most at risk to extreme dryness or temperature increase are provinces in Central and Western Visayas and Mindanao, which support the study conducted by Manila Observatory (2005).
When the combined risk to four climate- and weather-related hazards (tropical cyclones, El Niñoinduced droughts, projected temperature increases and rainfall changes) in the country was mapped out by Manila Observatory (2005), the areas most at risk to simultaneous incidence of such hazards are Southeastern Luzon and Eastern Visayas. The Observatory explained ‘that the risk to typhoons and risk to projected rainfall change dominate the sum’; this confirms the substantial amount of rain dumped on the country, almost all year round, by large-scale atmospheric phenomena. However, the uneven distribution of rain over time and space varies the severity of the impact of disasters across provinces and regions. Half of the top 20 provinces (Albay, Sorsogon, Sulu, Ifugao, Northern Samar, Masbate, Biliran, Western Samar, Basilan, Camarines Sur) that run a higher risk to all climate- and weather-related hazards (Manila Observatory, 2005) also have a High Poverty Incidence Rating (NSCB and World Bank, 2005).
POVERTYAND VULNERABILITY The greater vulnerability to natural hazards of provinces and regions with high poverty incidence emphasizes the importance of understanding the links between poverty and the country’s vulnerability beyond its geophysical characteristics. These linkages are illustrated in a recent study conducted by the World Bank and NDCC (no date: 13):
‘‘Poverty and vulnerability to natural hazards are closely linked and mutually reinforcing. Poor and socially disadvantaged groups are usually the most vulnerable to hazards, reflecting their social, cultural, economic and political environments … Indeed, at the household level, poverty is the single most important factor determining vulnerability, in part reflecting location of housing (e.g. on floodplains, riverbanks, steep slopes …); level of access to basic services (e.g. refuse collection)
particularly for illegal squatters; sources of livelihood; and level of access to financial and other assets and resources, leaving limited recourse to inter-temporal consumption smoothing.’
In that same study, the country’s poverty incidence is reported at 26 percent in 2000, which remains a major challenge to national development. The study further describes poverty as highly concentrated in rural areas, where about 77 percent of the poor reside; two-thirds of these people rely on the agriculture, fishing and forestry sectors for their livelihoods. Absence or lack of land tenure is a central issue among the poor, forcing many to live and work in high-risk areas (World Bank and NDCC, no date), such as in the danger zones of the six most active volcanoes and practically all deforested mountains, riverbeds, low-lying flood plains and coastal areas in the country. While most of the poor are now aware of the risk and vulnerability of these areas to natural hazards, they have no other choice but to accept or ignore such realities, in order to be closer to their sources of livelihood. These areas attract the poor, who often have no assets in the more developed lowland areas for constructing houses and developing livelihoods. As a result, informal settlements including resettlement sites have gradually expanded in high-risk areas in recent years. Even the remaining natural barriers such as patches of forested slopes and mangroves have not been spared from this informal settlement expansion.
Poverty compels people to build houses from light scrap materials or locally-collected bamboos and palm leaves that are unable to withstand the impact of tropical cyclones, floods, landslides and storm surges. Repair or reconstruction of houses becomes a frequent activity of the poor after every disaster. Lack of secure tenure also reduces incentives for people to invest in housing improvements and in permanent agricultural production systems, or to modify their micro-environment to protect their farms and fishing grounds against floods, landslides, droughts, etc. This desolate condition weakens the capacity of the poor to prepare for disasters, or adapt to changes and recover after such events. Consequently, as the World Bank and NDCC (no date) reports, 24 of the 30 families who suffered from the 1991 Ormoc flood returned to their original areas because they had nowhere else to live, although they recognized the dangers of living on the riverside. In other cases, families returned to their original areas even when resettlement sites were made available to them, due to the proximity of these to their place of work and other means of livelihood2. Surprisingly, neither the affected families nor the support organizations have given attention to land tenure issues following disasters.
In major cities, urban poverty is manifested by the uncontrolled expansion of informal settlements on public land and hazard-prone areas. The vulnerability to disasters of informal settlements in key urban areas is magnified by the following: (i) a lack of land tenure or legal ownership of the land (ii) structures are usually made of scrap and lightweight materials (iii) a lack of a logical spatial pattern of settlement, due to the absence of land development plans; hence there is no provision for safety structures such as alleys, roads, easements (iv) the majority are located in easements such as along rivers, creeks or drainage systems and/or danger zones such as under bridges, beside railroad tracks, and inside garbage dumpsites (Vicente et al., 2006). In the area of Quezon City, for example, a tragedy occurred in the biggest dumpsite in Metro Manila called the Payatas area, when a huge mountain of decaying garbage collapsed in July 2000 burying 224 people, injuring 36 and leaving 16 missing. This damaged 103 houses and affected 135 families, or 680 people.
ECOLOGICAL DEGRADATION In addition to adverse socio–economic conditions that lead people to inhabit high-risk areas, many people also engage in unsustainable and dangerous livelihoods. In the Payatas landslide, for instance, affected families had been engaged in scavenging and recovery of recyclable materials, despite awareness of the dangers they would be exposed to in this enterprise. The tragic 1991 landslide in Ormoc City, Leyte Province, and the 2004 devastating landslides and flashfloods in Aurora and Quezon Provinces, had been partly attributed to logging (legal or illegal) and other wood-based industries. In the latter provinces, these activities have served as the main sources of people’s livelihoods, reducing forest cover to only 20 percent in Quezon Province and 70 percent in Aurora Province (CDRC, 2004). As the areas affected by landslides lie along
2 For example, an interview with two of the more than 220 affected families after the 2006 Typhoon Reming flood and mudflow (in Barangay Padang within Legaspi City, Albay), found that they returned to their former areas because they could readily find sources of livelihood, such as selling ready-to-eat food and fishing on nearby municipal waters. These sources were not available in the resettlement site located in an upland section of Barangay Taysan. The families also cited the proximity to market, the transport network and the stable supply of potable water in their areas, as compared with the resettlement site, as factors involved in their decision to stay.
the Philippine Fault Line, logging and inappropriate mountainside farming practices make these areas unstable generally and thus more vulnerable.
In urban areas, environmental degradation arises from the unplanned growth of informal settlements, indiscriminate waste disposal and clogging of waterways, and inadequate drainage systems (Vicente et al., 2006). Inappropriate urban land development practices also contribute to disasters, such as that which occurred in an upper middle-class subdivision in the eastern part of Metro Manila. This borough was issued with an Environmental Clearance Certificate (ECC), despite the unsuitability of its geophysical characteristics to support such structures. Overall, improper land development, absence of a sound landuse policy, and the poverty–environmental degradation nexus, combine to increase vulnerability to disasters.
■ 2. MAJOR NATURAL DISASTERS AND THEIR SOCIO-ECONOMIC CONSEQUENCES ■ 2.1 Disasters from Major Natural Hazards for the Period 1990–2006
Between 1990 and 2006, the Philippines experienced 520 disasters from seven major natural hazards (Table 1), which killed 20 898 people, injured 20 095 and left 6375 others missing. About 1230 people were killed each year. These disasters affected 19 298 190 families or 94 809 689 people. This suggests that many of these people were repeatedly affected, particularly by tropical cyclones, floods and/or landslides during this period. More than 5.9 million houses were damaged, either totally or partially, mainly because many were made of light materials and semi-concrete structures located in high-risk areas.
Volcanic eruptions. Six volcanic eruptions had been recorded from 1990 to 2006, as shown in Table 1, resulting in the deaths of 958 people and injuries to 201 others, affecting 339 149 families or over 1.6 million people, and damaging 112 698 houses. The Mount Pinatubo eruption of June 1991 was by far the worst disaster in the country’s history. This eruption affected a densely-populated area in five provinces in Central Luzon Region – the rice granary of the Philippines – covering 364 barangays, involving 249 371 families or 1.18 million people3. They represent about one-fifth of the entire region’s population. Of these families, about 8000 families or 35 000 people belong to the indigenous people called Aetas. The Mount Pinatubo disaster accounted for around 74 percent of the total families affected by volcanic eruptions during the period under review. Total damage to agriculture, infrastructure, and personal property was at least PhP 10.1 billion (US$374 million) in 1991 and an additional PhP 1.9 billion (US$69 million) in 1992. Foregone business was estimated at PhP 454 million (US$1.4 million) in 1991, and an additional PhP 37 million (US$1.4 million) in 1992. The costs of caring for evacuees was at least PhP 2.5 billion (US$93 million) in 1991–92, and an additional PhP 4.2 billion (US$154 million) was spent on dikes and dams to control lahar during the same period (Mercado et al., 1999).
The same study also estimated a PhP 1.6 billion, or a 2.3 percent reduction, of gross regional domestic product (GRDP) in the Central Luzon Region from 1990 to 1991 as the economic impact of the disaster. Almost all sectors of the economy were affected by the eruption. Among the hardest hit were manufacturing, mining and quarrying, agriculture and private services. The effect on agriculture was more prominent such that agricultural productivity in 1992 was still below the 1991 level, because the lahars took additional agricultural lands out of production in 1992.
Earthquakes. Of the 12 major earthquakes that hit the country from 1968 to 2006, nine occurred during the last 17 years of this period (1990–2006). The nine earthquakes affected 262 174 families or 1 444 913 people, and caused the deaths of 1394 people, injuries to 3566 others, and left 329 missing. These earthquakes damaged 115 937 houses, around a quarter of which were completely wiped out. In recent decades, the Luzon earthquake of July 1990 was the most destructive, registering a death toll of 1283 people, or 92 percent of total deaths recorded for the period 1990–2006. It also affected 227 918 families or some 1.3 million people, accounting for 87 percent of total affected families and people for the same period. The damage it caused to housing (estimated at 98 554 units) represent 85 percent of total housing units destroyed.
Landslides. From 1990 to 2006, the country recorded 142 landslide incidents, with an average of eight
TABLE 1 – Major Natural Disaster Impacts in the Philippines, 1990–2006
DISASTER TYPE FREQ CASUALTIES POPULATION AFFECTED HOUSES DAMAGED
DEAD INJURED MISSING FAMILIES PEOPLE TOTALLY PARTIALLY
Volcanic eruption 6 958 201 23 339 149 1 619 029 44 247 68 451 Earthquake 9 1394 3,566 329 262 174 1 444 913 27 276 88 661 Landslides 142 735 387 81 15 422 75 147 719 1574 Tropical cyclones 139 12 274 15 184 4524 15 422 872 76 638 345 1 430 039 4 224 617 Floods 175 5523 685 1364 1 107 405 5 253 367 9234 35 828 Tornado 46 14 72 54 7227 38 950 652 1364 Drought and the El Niño phenomenon 3 0 0 0 2,143,941 9 739 938 0 0 Total 520 20 898 20 095 6375 19 298 190 94 809 689 1 512 167 4 420 495
Source: Data obtained from National Disaster Coordinating Council, Office of Civil Defense.
incidents annually. The frequency of the landslides, however, increased if compared with six for the previous decade (1981–1990). The Guinsaugon landslide of December 2003 in St Bernard, Southern Leyte, was one of the most disastrous events, killing 154 people, displacing and disrupting the lives of 3811 families, and incurring about PhP 115.0 million of damage to agriculture and infrastructure.
Tropical cyclones. These are the single most important cause of disasters in the Philippines. About 46 percent of the 303 cyclones that hit the country during the last 17 years turned destructive, with at least eight occurring annually. Two of these eight destructive cyclones per year were considered ‘most destructive’, causing the highest number of casualties, affecting families and damaging houses, and incurring the highest cost of damages. Between 1990 and 2006, the 139 cyclones have killed about 16 800 people (including missing people), of which about 6400 died during Typhoon Uring, which submerged the entire Ormoc City in Leyte Province. For the same period, cyclones killed about 990 people and incurred over PhP 8.0 billion of total damages each year.
Floods. The combined confluence of geological and climate factors has caused more flooding incidents than any other hazard that hit the country in the period 1990–2006. There were 175 flooding incidents, which killed 5523 people, affected about 1.1 million families or over 5.2 million people, damaged 45 062 houses, and caused financial losses amounting to around PhP 6.08 million. The misplacement of human settlements, including livelihood sources, in high-risk areas has clearly contributed to the environmental degradation that enhances the occurrence of flood, even in the absence of tropical cyclones. The available limited studies (World Bank and NDCC, no date; Vicente et al., 2006) tend to support this observation.
Storm surges. These are another hazard facing the Philippines, but little information on storm surges is available. ADRC (2002) recorded two occurrences of storm surges in 1991 and 2000, which killed 10 people in Samar and Leyte Islands and left 5250 others homeless. No estimates on economic damages were reported.
Tornados. Forty six tornadoes struck the Philippines during the period 1990–2006, which claimed the lives of 14 people, injured 72 and left 54 others missing. Overall, these incidents affected 7227 families or 38 950 people, the majority living in the provinces of North and South Cotabato, Sultan Kudarat, Maguindanao, Sulu and Zamboanga Sibugay in Mindanao, and Negros Occidental, Leyte, Southern Leyte, and Cebu in the Visayas. In Luzon, although these events were not so significant, tornados also caused human and property impacts in the provinces of Zambales, Tarlac, Nueva Ecija and Bulacan. Total tornado damages have been estimated at around PhP 128.62 million.
Droughts. The El Niño induced drought has recently caused damage on a wider scale in the Philippines. Although there were only three drought incidents during the period 1990–2006, the 1998 drought produced the most extensive damage to the country’s economy. Apart from causing severe water supply problems throughout the country (covering all 16 regions), it also paralysed agricultural production in over 368 469 hectares, with an estimated value of PhP 20.6 billion. Extreme dryness also brought about several forest fires in 41 barangays within 17 cities and

©FAO/Maimone
municipalities in eight provinces, covering 5482 hectares, with damages valued at PhP 42.8 million. This drought also inflicted damage on various industries because of the reduced capacity for power generation and increased scarcity of water supplies, resulting in partial operations and the dismissal of workers.
2.2 Economic Impacts of Major Natural Disasters
In the Philippines, economic impacts of natural disasters have been measured in terms of direct losses to agriculture, public infrastructure and private property. Between 1990 and 2006, the average annual direct damage to the country as a consequence of the major natural disasters reviewed in the previous section, has been estimated at around PhP 9.2 billion (in current prices; Table 2). This direct damage was equivalent to an average of 0.2 percent of the country’s Gross Domestic Product (GDP) every year, a marked difference from an earlier study (calculated at 0.7 percent) prepared by World Bank and NDCC (no date) based on data over a longer time span (1970–2000). However, the problem of data inconsistencies4 as regards annual damages by disaster type could partly account for the difference in the estimated average percentage of annual direct damage to GDP. Tropical cyclones and earthquakes caused the most damage to the country over the period 1990–2007, with cyclones alone accounting for about 87 percent of total damage, reflecting their high annual frequency (World Bank and NDCC, no date). Earthquakes accounted for about 9 percent of total damage. These two extreme events also caused over 65 percent of total deaths recorded during the same period.
Flooding, which accounted for the second highest death toll and human impact after tropical cyclones, amounted to an additional 4 percent of total damages. This hazard has shown an increasing occurrence in recent years, reflecting the continuing growth and densification of populations and human settlements, as well as the intensification of agricultural activities in high-risk areas. Other natural disasters (tornados, landslides and volcanic eruptions) accounted for only 0.15 percent of total damages, partly reflecting the localized nature of their impacts.
4 Some tabulated data on different natural disasters obtained from NDCC contain certain discrepancies – even for a similar time period – as regards disaster occurrences, human and housing impacts, and economic damages. This might be explained by the periodic updating undertaken by NDCC, in which the specific dates of data updating or revision are not indicated or reflected.