| contents page | news | events | advertisers’ index | contact |
Additive Manufacturing at PM Titanium 2015
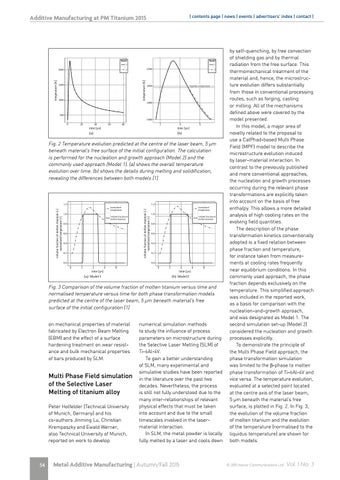
For both models, the overall behavior of the temperature evolution is similar during the heating and cooling period, see Fig. 1a. During the heating period the temperature vs. time curves are identical, but during the cooling period they differ significantly from each other, as soon as temperature falls below the liquidus temperature (approximately 1980 K), see Fig. 1b.
selected point is located fully in the molten pool where homogeneous nucleation of β-titanium is assumed. For a small supercooling below the liquidus temperature, the driving force for nucleation is small leading to an incubation time which is larger than the simulated time span. Therefore the phase transformation is dominated by the movement of the β/molten titanium interface which bounds the molten pool. Even in case of small supercooling, the interface moves towards the material’s free surface with a velocity proportional to the driving force. This is in accordance with the elongated β-grains observed in SLM processed Ti-6Al-4V as reported in [21]. The resolidification of titanium requires actually no nucleation because β-grains are located (a) (b) at the boundary of the molten pool. Even for a small supercooling, β-grains begin to grow into the molten pool towards the material’s freeatsurface. Knowing preferred Fig. 1: Temperature evolution predicted the center of thethat laserthe beam, 5 µmcrystallographic beneath mateFig. 2 Temperature evolution at the centre the laserisforbeam, 5 of μm growth is configuration. thepredicted 1 0 0 direction, the textureisofofperformed β-grains the the rial’s freedirection surface of β-phase the initial The calculation theresult nucleation selection of approach preferredfree crystallographic direction during Even calculation though the exact and growth (Model 2) and of the commonly usedsolidification. approach (Model 1). a.) shows the beneath material’s surface the initial configuration. The value of interface mobility is over unknown, supercooling calculated the simulation is about temperature evolution time. the b.) shows details during by melting is overall performed for the nucleation and growththe approach (Model 2) and andsolidification, the 4% belowthe thedifferences liquidus temperature (inmodels. K), Fig. 2b, which does not exceed the experimentally revealing between both commonly used approach (Model 1). (a) themelting overall temperature measured maximum supercooling of about 15%shows below the point (in K) [12]. Theassumption small coefficient fordetails the substitutional alloying elements in Ti-6Al-4V [20] The of small wetting the angles is leading to a high nucleation rate when transformaevolution overpartitioning time. (b) shows during melting and solidification, in combination high cooling ratesa of moreinstantaneous than 106 K/s transformation leads to the conclusion that an tion temperaturewith is exceeded, ensuring nearly from β-titanium revealing the differences between both models [1] homogenous toalmost molten titanium. distribution of alloying elements due to solute trapping can be expected. Therefore, it is justified to assume thatduring the free densities dependfrom exclusively on the The different temperature evolution theenthalpy cooling period orginates the dissimilar temperature. description of phase transition in the two models. Figure 2a shows that the volume fraction of the molten titanium becomes 1 as soon as the temperature at the selected point exceeds the liquidus temperature and is zero if the temperature falls below the solidus temperature. Figure 2b shows a different but more credible behavior, because molten titanium is supercooled, a phenomenon which is observed for many materials [12]. Knowing that Model 2 allows for supercooling, the difference in temperature evolution during the cooling period can be explained by the larger thermal conductivitiy of β-titanium compared to that of molten titanium below the liquidus temperature, see Table 1. Therefore, the heat fluxes decrease when the selected point and its surrounding is in molten state and the temperature falls below the liquidus temperature. Consequently, the selected point cools down more slowly, which can be seen in the detailed view of the temperature evolution (s. Fig. 1b). The delay of the β/molten titanium phase transition during the cooling period shown in Fig. 2b is caused by nucleation and growth and the associated incubation time during the nucleation of β-titanium, and the finite interface velocity. The incubation time during the nucleation of β-titanium or molten titanium depends on the free enthalpy change and the wetting angles. The
(a) Model 1
(b) Model 2
Fig. 2: Comparison of the volume fraction of molten titanium versus time and normalized
Fig.temperature 3 Comparison of the fraction of molten titanium time and versus time for volume both phase transformation models predictedversus at the center of the laser beam, temperature 5 µm beneath material’s surface of thephase initial configuration. normalised versus free time for both transformation models predicted at the centre of the laser beam, 5 μm beneath material’s free surface of the initial configuration [1] Conclusions The nucleation and growth model provides a thermodynamically motivated description of the
transformations during of melting and re-solidification. Thissimulation model can capture the effect of on phase mechanical properties material numerical methods fabricated by Electron Beam Melting to study the influence of process (EBM) and the effect of a surface parameters on microstructure during hardening treatment on wear resistthe Selective Laser Melting (SLM) of ance and bulk mechanical properties Ti-6Al-4V. of bars produced by SLM. To gain a better understanding of SLM, many experimental and simulative studies have been reported Multi Phase Field simulation in the literature over the past two of the Selective Laser decades. Nevertheless, the process Melting of titanium alloy is still not fully understood due to the many inter-relationships of relevant physical effects that must be taken Peter Holfelder (Technical University into account and due to the small of Munich, Germany) and his timescales involved in the laserco-authors Jinming Lu, Christian material interaction. Krempaszky and Ewald Werner, In SLM, the metal powder is locally also Technical University of Munich, fully melted by a laser and cools down reported on work to develop
54
Metal Additive Manufacturing | Autumn/Fall 2015
by self-quenching, by free convection of shielding gas and by thermal radiation from the free surface. This thermomechanical treatment of the material and, hence, the microstructure evolution differs substantially from those in conventional processing routes, such as forging, casting or milling. All of the mechanisms defined above were covered by the model presented. In this model, a major area of novelty related to the proposal to use a CalPhad-based Multi Phase Field (MPF) model to describe the microstructure evolution induced by laser-material interaction. In contrast to the previously published and more conventional approaches, the nucleation and growth processes occurring during the relevant phase transformations are explicitly taken into account on the basis of free enthalpy. This allows a more detailed analysis of high cooling rates on the evolving field quantities. The description of the phase transformation kinetics conventionally adopted is a fixed relation between phase fraction and temperature, for instance taken from measurements at cooling rates frequently near equilibrium conditions. In this commonly used approach, the phase fraction depends exclusively on the temperature. This simplified approach was included in the reported work, as a basis for comparison with the nucleation-and-growth approach, and was designated as Model 1. The second simulation set-up (Model 2) considered the nucleation and growth processes explicitly. To demonstrate the principle of the Multi Phase Field approach, the phase transformation simulation was limited to the β-phase to molten phase transformation of Ti-6Al-4V and vice versa. The temperature evolution, evaluated at a selected point located at the centre axis of the laser beam, 5 μm beneath the material’s free surface, is plotted in Fig. 2. In Fig. 3, the evolution of the volume fraction of molten titanium and the evolution of the temperature (normalised to the liquidus temperature) are shown for both models.
© 2015 Inovar Communications Ltd
Vol. 1 No. 3