*Customary for Seller to Pay
RealEstateAgentCommissions
Reconveyance/ReleaseFees
PrepaymentPenalties(IfApplicable)
Owner'sTitleInsurance
EscrowFee
TaxProrations
LienSearch(ifapplicable)
Mortgages&Encumbrances
AnyPropertyTaxDue
LoanOriginationFee/Discount
CreditFee
MortgageInsurance(ifapplicable)
ReserveSetUpFee(ifapllicable)
FireInsurance1year(homeownerspolicy)
Floodinsurance(ifapplicable)
FloodandTaxCertifications
PrepaidInterest
HomeOwnersAssociationFees(ifapplicable)
VAFundingFee
TaxProration
EscrowFee
RecordingFee LendersTitleInsurance
* Items listed are intended to represent only what may be customarily charged and may not reflect actual charges at closing. Consult with your real estate professional or title company representtaive for actual charges specific to your transaction.
Seller to pay full escrow fee (includes buyer escrow fee)
ConventionalFHA VA ● ● ● ● ● ● ● ● ● ● ● ● ● ● ● ● ● ● ● ● ● ● ● ● ● ● ● ● ● ● ● ● ● ● ● ● ● ConventionalFHA VA ● ● ● ● ● ● ● ● ● ● ● ● ● ● ● ● ● ● ● ● ● ● ● ● ● ● ● ● ● ● ● ● ● ● ● ● ● ● ● ● ● ● ● ● ●
GUIDE TO CLOSING COSTS
Buyer'sLenderFees(variesbylender)
AppraisalFee
TypeofFinancing TypeofFinancing
for Buyer to Pay Cash (no loan) Cash (no loan)
*Customary


Market Data
Realtors
OR
REPORT FOR 7/5/2023 Single-Family Homes Presented by Mike Simonsen mike+website@altosresearch.com Schedule a demo today at AltosResearch.com
Altos
for
Powell Butte,
97753
This week the median list price for Powell Butte, OR 97753 is $1,645,000 with the market action index hovering around 37. This is an increase over last month's market action index of 33 Inventory has increased to 22.
This answers “How’s the Market?” by comparing rate of sales versus inventory.
Powell Butte, OR 97753
Real-Time Market Profile
Home sales continue to outstrip supply and the Market Action Index has been moving higher for several weeks. This is a Seller’s market so watch for upward pricing pressure in the near future if the trend continues
Market Segments
Each segment below represents approximately 25% of the market ordered by price.
Single-Family Homes
Median List Price $1,645,000 Median Price of New Listings $2,100,000 Per Square Foot $522 Average Days on Market 162 Median Days on Market 39 Price Decreased 32% Price Increased 5% Relisted 23% Inventory 22 Median Rent $2,550 Market Action 37 Slight Seller's Advantage Altos Market Data for Realtors Schedule a demo today at AltosResearch.com
Market Action Index
Buyer's Market Seller's Market 0 10 20 30 40 50 60 70 80 90 100 Tod a y LastMonth 37 Slight Seller's Advantage
Median Price Sq. Ft. Lot Size Beds Bath Age New Absorbed DOM $2,599,000 5,298 0 5 - 1 acre 4 5 5 14 0 0 245 $2,100,000 3,543 0.5 - 1 acre 4 3 17 1 0 28 $1,420,000 2,847 5 - 10 acres 3 2.5 15 0 1 7 $907,000 1,979 0.5 - 1 acre 3 2.5 10 0 0 42 2 of 6 Wed Jul 05 2023 Powered by Altos Research, Inc. | www.altos.re | Copyright © 2023 Altos Research, Inc.
Median List Price
In the last few weeks we’ve seen prices in this zip code bouncing around this plateau. Look for a persistent down-shift in the Market Action Index before we see prices deviate from these levels.
Segments
In the quartile market segments, we see prices in this zip code generally settled at a plateau, although Quartile 2 is on a bit of an up trend in recent weeks. We'll need to see a persistent shift in the Market Action Index before we see prices across the board move from these levels.
Single-Family Homes
97753 Altos Market Data for Realtors
a demo today at AltosResearch.com
Powell Butte, OR
Schedule
7-Day Average 90-Day Average Jul 2018 Feb 2019 Aug 2019 Feb 2020 Aug 2020 Feb 2021 Aug 2021 Feb 2022 Aug 2022 Feb 2023 $500K $750K $1.0M $1.3M $1.5M $1.8M $2.0M
Top 90-Day Upper 90-Day Lower 90-Day Bottom 90-Day Jul 2018 Feb 2019 Aug 2019 Feb 2020 Aug 2020 Feb 2021 Aug 2021 Feb 2022 Aug 2022 Feb 2023 $0 $5.0M $10.0M $15.0M $20.0M 3 of 6 Wed Jul 05 2023 Powered by Altos Research, Inc. | www.altos.re | Copyright © 2023 Altos Research, Inc.
Price Per Square Foot
The market plateau is seen across the price and value. The price per square foot and median list price have both been reasonably stagnant. Watch the Market Action Index for persistent changes as a leading indicator before the market moves from these levels.
Inventory has been falling in recent weeks. Note that declining inventory alone does not signal a strengthening market. Look to the Market Action Index and Days on Market trends to gauge whether buyer interest is changing with the available supply.
Single-Family Homes Powell Butte, OR 97753 Altos Market Data for Realtors Schedule a demo today at AltosResearch.com
Jul 2018 Feb 2019 Aug 2019 Feb 2020 Aug 2020 Feb 2021 Aug 2021 Feb 2022 Aug 2022 Feb 2023 $200 $400 $600 $800 $1.0K Inventory
7-Day Average 90-Day Average
7-Day
90-Day
Jul 2018 Feb 2019 Aug 2019 Feb 2020 Aug 2020 Feb 2021 Aug 2021 Feb 2022 Aug 2022 Feb 2023 0 10 20 30 40 50 4 of 6 Wed Jul 05 2023 Powered by Altos Research, Inc. | www.altos.re | Copyright © 2023 Altos Research, Inc.
Average
Average
Market Action Index
Home sales continue to outstrip supply and the Market Action Index has been moving higher for several weeks. This is a Seller’s market so watch for upward pricing pressure in the near future if the trend continues.
Market Action Segments
Not surprisingly, all segments in this zip code are showing high levels of demand. Watch the quartiles for changes before the whole market changes. Often one end of the market (e.g. the high-end) will weaken before the rest of the market and signal a slowdown for the whole group.
Single-Family Homes Powell Butte, OR 97753 Altos Market Data for Realtors Schedule a demo today at AltosResearch.com
7-Day Average 90-Day Average Jul 2018 Feb 2019 Aug 2019 Feb 2020 Aug 2020 Feb 2021 Aug 2021 Feb 2022 Aug 2022 Feb 2023 0 100 25 50 75 125
Top 90-Day Upper 90-Day Lower 90-Day Bottom 90-Day Jul 2018 Feb 2019 Aug 2019 Feb 2020 Aug 2020 Feb 2021 Aug 2021 Feb 2022 Aug 2022 Feb 2023 0 20 40 60 80 100 5 of 6 Wed Jul 05 2023 Powered by Altos Research, Inc. | www.altos.re | Copyright © 2023 Altos Research, Inc.
Schedule a demo today at AltosResearch.com
Median Days on Market (DOM)
The properties have been on the market for an average of 185 days. Half of the listings have come newly on the market in the past 85 or so days. Watch the 90-day DOM trend for signals of a changing market.
Segments
It is not uncommon for the higher priced homes in an area to take longer to sell than those in the lower quartiles.
Single-Family Homes
Altos Market Data for Realtors
Powell Butte, OR 97753
7-Day Average 90-Day Average Jul 2018 Feb 2019 Aug 2019 Feb 2020 Aug 2020 Feb 2021 Aug 2021 Feb 2022 Aug 2022 Feb 2023 0 100 200 300 400
Top 90-Day Upper 90-Day Lower 90-Day Bottom 90-Day Jul 2018 Feb 2019 Aug 2019 Feb 2020 Aug 2020 Feb 2021 Aug 2021 Feb 2022 Aug 2022 Feb 2023 0 200 400 600 800 6 of 6 Wed Jul 05 2023 Powered by Altos Research, Inc. | www.altos.re | Copyright © 2023 Altos Research, Inc.
AreaProfiled:PowellButteViewEstates
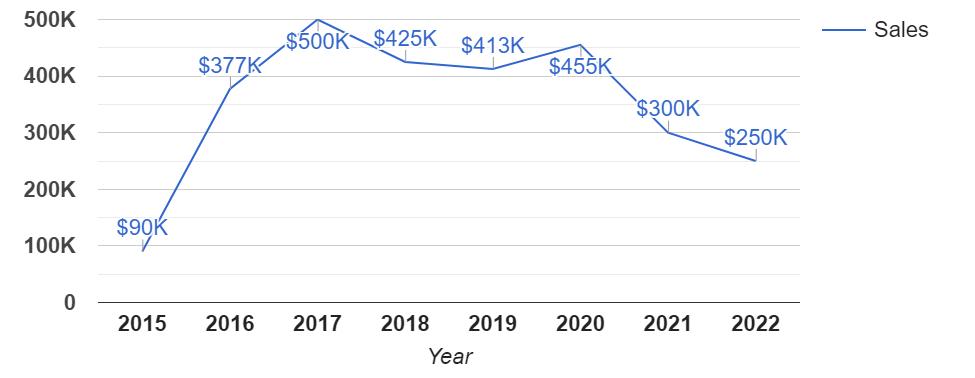
AverageSalePricebyYear:01/01/2015-07/05/2023
LengthofResidence
*15sale(s)areincludedinthegraph **6sale(s)withnosalepriceareexcludedfromthegraph
SalesStatisticsbyYear:01/01/2015-07/05/2023

AgeofHomes
InformationisdeemedreliablebutnotguaranteedPoweredbygeoAdvantage
NumberofParcels:56 ParcelswithViews:0
WaterfrontParcels:0
ReportDate: 07/05/2023
SalesDates: 09/16/1991-04/10/2023
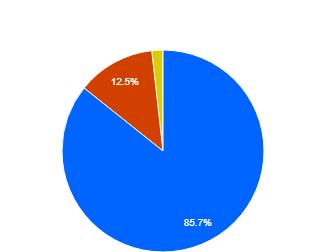
AverageLengthofResidence 15yr(s) OwnershipLength # %ofHomes 0-2Years 4 7% 2-4Years 6 10% 4-6Years 4 7% 6-10Years 12 21% 10+Years 29 52%
fromthecalculation
*55parcel(s)areincludedinthecalculation **1parcel(s)withnosaledateareexcluded
Year # Sales Price/SqFtPrice/FinSqFt % Turnover AvgSale Price MinSale Price MaxSale Price 2015 1 $72 $72 2 $90,000 $90,000 $90,000 2016 3 $232 $232 5 $377,167 $277,500 $539,000 2017 1 $242 $242 2 $500,000 $500,000 $500,000 2018 1 $266 $266 2 $425,000 $425,000 $425,000 2019 3 $176 $176 5 $412,667 $310,000 $464,000 2020 4 $267 $292 7 $455,250 $375,000 $512,000 2022 1 $128 $128 2 $154,000 $154,000 $154,000 *14sale(s)areincludedinthetable **8sale(s)withnosalepriceorbuildingsqftareexcludedfromthetable
AverageAgeofHome 28yr(s) YearBuilt # %ofHomes <5Years 2 4% 5-10Years 4 7% 10+Years 52 93% OwnerOccupancy OwnerMail # %ofHomes OwnerOccupied 48 86% InStateNon-OwnerOcc 7 12% OutofState 1 2% AssessedValues AverageValues $198,430 YearAssessment # %ofHomes $1k-$250k 43 77% $251k-$500k 13 23% $501k-$750k 0 0% $751k-$15M 0 0% $15M+ 0 0%
Property Profile Taxes Deed
PropertyProfileSummary

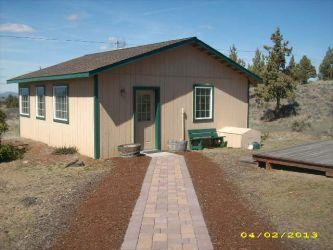
SUBJECTPROPERTY
2103 CrookCounty ADDRESS
OR97753
OWNER StephenCLibbyTrust
DATE 07/05/2023
PREPAREDBY SarahLewis sarahl@deschutestitle.com
Crook County Property Summary Report
Report Date: 7/5/2023 10:56:14 AM
Disclaimer
Account Summary
Account Information
Mailing Name:
Map and Taxlot: Account:
Tax Status:
Situs Address:
Subdivision:
15 Lot:
161422A0-02500-2103
2103
STEPHEN C LIBBY TRUST Taxable
UNDETERMINED SITUS ADDRESS
Mailing Address:
STEPHEN C LIBBY TRUST 860 DANA CT AUBURN, CA 95603-6085
POWELL BUTTE VIEW ESTATES
Property Class: 100
Ownership
3 Assessor
Property
Assessment Tax Code
Current
Valuation
Land Structures Total
Real
Maximum
Assessed
Veterans
Current
Acres:
Taxes
Area:
Tax Year: 0035 2022 1.82
$159,090
$159,090
Market Values as of Jan. 1, 2023 $31,970 $31,970
Assessed
Value
Exemption $0.00
Assessed Values:
Warnings, Notations, and Special Assessments Block:
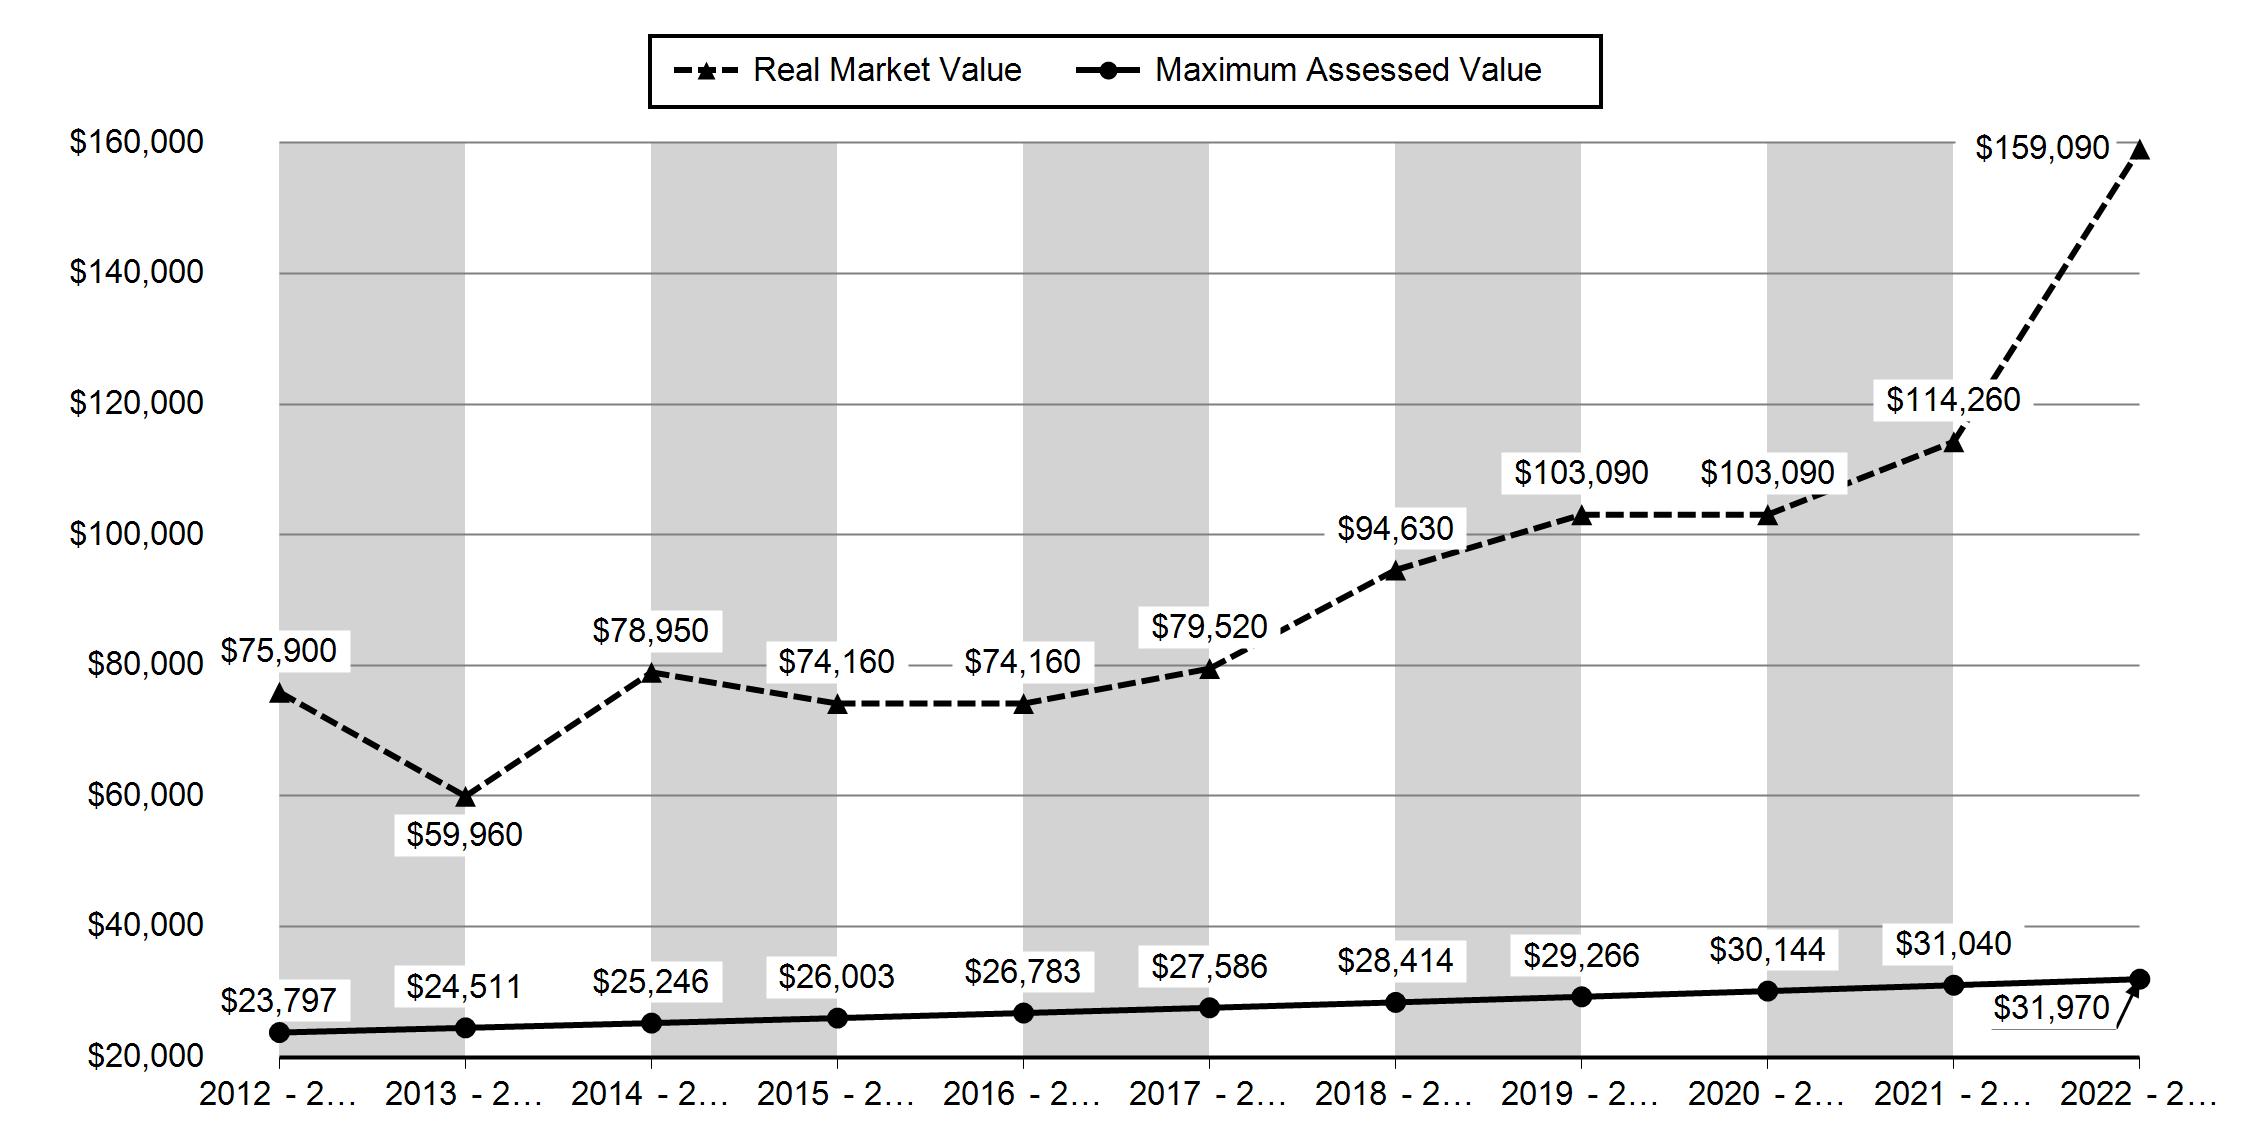
2012 - 2013 2013 - 2014 2014 - 2015 2015 - 2016 2016 - 2017 Real Market Value - Land $75,900 $59,960 $78,950 $74,160 $74,160 Real Market Value - Structures $0 $0 $0 $0 $0 Total Real Market Value $75,900 $59,960 $78,950 $74,160 $74,160 Maximum Assessed Value $23,797 $24,511 $25,246 $26,003 $26,783 Total Assessed Value $23,797 $24,511 $25,246 $26,003 $26,783 Exemption Value $0 $0 $0 $0 $0 Valuation History All values are as of January 1 of each year. Tax year is July 1st through June 30th of each year. Property Information Report, page 1
The information and maps presented in this report are provided for your convenience. Every reasonable effort has been made to assure the accuracy of the data and associated maps. Crook County makes no warranty, representation or guarantee as to the content, sequence, accuracy, timeliness or completeness of any of the data provided herein. Crook County explicitly disclaims any representations and warranties, including, without limitation, the implied warranties of merchantability and fitness for a particular purpose. Crook County shall assume no liability for any errors, omissions, or inaccuracies in the information provided regardless of how caused. Crook County assumes no liability for any decisions made or actions taken or not taken by the user of this information or data furnished hereunder.
2017 - 2018 2018 - 2019 2019 - 2020 2020 - 2021 2021 - 2022 2022 - 2023 $79,520 $94,630 $103,090 $103,090 $114,260 $159,090 $0 $0 $0 $0 $0 $0 $79,520 $94,630 $103,090 $103,090 $114,260 $159,090 $27,586 $28,414 $29,266 $30,144 $31,040 $31,970 $27,586 $28,414 $29,266 $30,144 $31,040 $31,970 $0 $0 $0 $0 $0 $0 Property Information Report, page 2 (For Report Disclaimer see page 1)
Tax Payment History
Year Date Due Transaction Type Transaction Date As Of Date Amount Received Tax Due Discount Amount Interest Charged Refund Interest 2022 11/15/2022 PAYMENT 11/14/2022 11/14/2022 $402.21 ($414.65) $12.44 $0.00 $0.00 2022 11/15/2022 IMPOSED 10/12/2022 11/15/2022 $0.00 $414.65 $0.00 $0.00 $0.00 Total: $0.00 2021 11/15/2021 PAYMENT 11/12/2021 11/12/2021 $401.44 ($413.86) $12.42 $0.00 $0.00 2021 11/15/2021 IMPOSED 10/12/2021 11/15/2021 $0.00 $413.86 $0.00 $0.00 $0.00 Total: $0.00 2020 11/15/2020 PAYMENT 10/30/2020 10/30/2020 $390.41 ($402.48) $12.07 $0.00 $0.00 2020 11/15/2020 IMPOSED 10/16/2020 11/15/2020 $0.00 $402.48 $0.00 $0.00 $0.00 Total: $0.00 2019 11/15/2019 IMPOSED 11/15/2019 11/15/2019 $0.00 $388.39 $0.00 $0.00 $0.00 2019 11/15/2019 PAYMENT 10/21/2019 11/15/2019 $376.74 ($388.39) $11.65 $0.00 $0.00 Total: $0.00 2018 11/15/2018 IMPOSED 11/15/2018 11/15/2018 $0.00 $378.51 $0.00 $0.00 $0.00 2018 11/15/2018 PAYMENT 10/26/2018 11/15/2018 $367.15 ($378.51) $11.36 $0.00 $0.00 Total: $0.00 2017 11/15/2017 PAYMENT 12/01/2017 11/15/2017 $44.61 ($44.61) $0.00 $0.00 $0.00 2017 11/15/2017 IMPOSED 11/15/2017 11/15/2017 $0.00 $372.43 $0.00 $0.00 $0.00 2017 11/15/2017 PAYMENT 11/14/2017 11/15/2017 $321.26 ($327.82) $6.56 $0.00 $0.00 Total: $0.00 2016 11/15/2016 PAYMENT 11/17/2016 11/15/2016 $345.06 ($355.73) $10.67 $0.00 $0.00 2016 11/15/2016 IMPOSED 11/15/2016 11/15/2016 $0.00 $355.73 $0.00 $0.00 $0.00 Total: $0.00 2015 11/15/2015 PAYMENT 12/10/2015 11/15/2015 $342.07 ($340.56) $0.00 $1.51 $0.00 2015 11/15/2015 IMPOSED 11/15/2015 11/15/2015 $0.00 $340.56 $0.00 $0.00 $0.00 Total: $0.00 2014 11/15/2014 PAYMENT 11/17/2014 11/15/2014 $316.64 ($326.43) $9.79 $0.00 $0.00 2014 11/15/2014 IMPOSED 11/15/2014 11/15/2014 $0.00 $326.43 $0.00 $0.00 $0.00
Property Information Report, page 3 (For Report Disclaimer see page 1)
Sales History
Year Date Due Transaction Type Transaction Date As Of Date Amount Received Tax Due Discount Amount Interest Charged Refund Interest Total: $0.00 2013 11/15/2013 PAYMENT 11/19/2013 11/15/2013 $315.62 ($325.38) $9.76 $0.00 $0.00 2013 11/15/2013 IMPOSED 11/15/2013 11/15/2013 $0.00 $325.38 $0.00 $0.00 $0.00 Total: $0.00 2012 11/15/2012 WRITE OFF 12/03/2012 11/15/2012 $0.00 ($1.41) $0.00 $0.00 $0.00 2012 11/15/2012 PAYMENT 12/03/2012 11/15/2012 $316.18 ($314.77) $0.00 $1.41 $0.00 2012 11/15/2012 IMPOSED 11/15/2012 11/15/2012 $0.00 $316.18 $0.00 $0.00 $0.00 Total: $0.00 2011 11/15/2011 IMPOSED 11/15/2011 11/15/2011 $0.00 $309.45 $0.00 $0.00 $0.00 2011 11/15/2011 PAYMENT 11/01/2011 11/15/2011 $300.17 ($309.45) $9.28 $0.00 $0.00 Total: $0.00 2010 11/15/2010 PAYMENT 11/15/2010 11/15/2010 $289.97 ($298.94) $8.97 $0.00 $0.00 2010 11/15/2010 IMPOSED 11/15/2010 11/15/2010 $0.00 $298.94 $0.00 $0.00 $0.00 Total: $0.00 2009 11/15/2009 PAYMENT 11/20/2009 11/15/2009 $281.14 ($289.83) $8.69 $0.00 $0.00 2009 11/15/2009 IMPOSED 11/15/2009 11/15/2009 $0.00 $289.83 $0.00 $0.00 $0.00 Total: $0.00 2008 11/15/2008 IMPOSED 11/15/2008 11/15/2008 $0.00 $288.04 $0.00 $0.00 $0.00 2008 11/15/2008 PAYMENT 11/04/2008 11/15/2008 $279.40 ($288.04) $8.64 $0.00 $0.00 Total: $0.00 2007 11/15/2007 PAYMENT 04/07/2008 11/15/2007 $3.61 ($3.61) $0.00 $0.00 $0.00 2007 11/15/2007 PAYMENT 02/11/2008 11/15/2007 $270.89 ($267.28) $0.00 $3.61 $0.00 2007 11/15/2007 IMPOSED 11/15/2007 11/15/2007 $0.00 $270.89 $0.00 $0.00 $0.00 Total: $0.00 2006 11/15/2006 PAYMENT 04/03/2007 11/15/2006 $4.70 ($4.70) $0.00 $0.00 $0.00 2006 11/15/2006 PAYMENT 03/16/2007 11/15/2006 $267.55 ($259.33) $0.00 $8.22 $0.00 2006 11/15/2006 IMPOSED 11/15/2006 11/15/2006 $0.00 $264.03 $0.00 $0.00 $0.00 Total: $0.00 2005 11/15/2005 IMPOSED 11/15/2005 11/15/2005 $0.00 $254.95 $0.00 $0.00 $0.00 2005 11/15/2005 PAYMENT 10/27/2005 11/15/2005 $247.30 ($254.95) $7.65 $0.00 $0.00 Total: $0.00 2004 11/15/2004 PAYMENT 02/11/2005 11/15/2004 $253.89 ($250.55) $0.00 $3.34 $0.00 2004 11/15/2004 IMPOSED 11/15/2004 11/15/2004 $0.00 $250.55 $0.00 $0.00 $0.00 Total: $0.00 2003 11/15/2003 PAYMENT 04/09/2004 11/15/2003 $253.95 ($246.29) $0.00 $7.66 $0.00 2003 11/15/2003 IMPOSED 11/15/2003 11/15/2003 $0.00 $246.29 $0.00 $0.00 $0.00 Total: $0.00 2002 11/15/2002 PAYMENT 02/25/2003 11/15/2002 $229.29 ($226.27) $0.00 $3.02 $0.00 2002 11/15/2002 IMPOSED 11/15/2002 11/15/2002 $0.00 $226.27 $0.00 $0.00 $0.00 Total: $0.00 2001 11/15/2001 PAYMENT 11/20/2001 11/15/2001 $215.55 ($222.22) $6.67 $0.00 $0.00 2001 11/15/2001 IMPOSED 11/15/2001 11/15/2001 $0.00 $222.22 $0.00 $0.00 $0.00 Total: $0.00 2000 11/15/2000 IMPOSED 11/15/2000 11/15/2000 $0.00 $215.96 $0.00 $0.00 $0.00 2000 11/15/2000 PAYMENT 11/14/2000 11/15/2000 $209.48 ($215.96) $6.48 $0.00 $0.00 Total: $0.00
Property Information Report, page 4 (For Report Disclaimer see page 1)
Structures
Land Characteristics
Related Accounts
Related accounts apply to a property that may be on one map and tax lot but due to billing have more than one account. This occurs when a property is in multiple tax code areas. In other cases there may be business personal property or a manufactured home on this property that is not in the same ownership as the land.
No Related Accounts found.
Ownership
Sale Date Seller Buyer Sale Amount Sale Type Recording 08/10/2021 GORDON MATTHEW J & DIONDRA M STEPHEN C LIBBY TRUST $299,999 2021-311032 01/10/2018 MILLIGAN ROBERT CARL II GORDON MATTHEW J & DIONDRA M $89,000 2018-284727 04/01/1992 UNDETERMINED GRANTOR NAME $9,000 1994-105771
Land Description Acres Land Classification Market 1.82 Mrkt OSD 0.00 CONVERSION OSD
Name Type Name Ownership Type Percentage OWNER STEPHEN C LIBBY TRUST , Taxpayer STEPHEN C LIBBY TRUST, 100.00% 100.00% Property Information Report, page 5 (For Report Disclaimer see page 1)
161422-A0-02500 CODE: 0035
UNDETERMINED
MAP: JULY 1, 2022 TO JUNE 30, 2023 CROOK COUNTY TAX COLLECTOR 200 NE 2nd St Prineville, OR 97754 2103 ACCOUNT NO:
C LIBBY TRUST 860 DANA
AUBURN
STEPHEN
CT
CA 95603-6085
VALUES: REAL MARKET (RMV) LAND STRUCTURES TOTAL RMV TOTAL ASSESSED VALUE NET TAXABLE: TOTAL PROPERTY TAX: LAST YEAR THIS YEAR 114,260 114,260 159,090 159,090 31,040 31,040 413.86 31,970 31,970 414.65
CROOK COUNTY TAX COLLECTOR 402.21 TOTAL DUE (After Discount ) 414.65 - 2022 2023 TAX ( Before Discount ) PROPERTY DESCRIPTION 2023 - 2022 CURRENT TAX BY DISTRICT
Crook County Website - www.co.crook.or.us 1/3 PAYMENT 5.53 Nov 15, 2022 Date Due Amount Discount Allowed (See back of statement for instructions) 270.90 PAYMENT OPTIONS 138.22 12.44 Nov 15, 2022 Nov 15, 2022 2/3 PAYMENT 402.21 FULL PAYMENT No Discount .... 3% Discount .... 2% Discount .... TAX PAYMENT OPTIONS Tax Collector (541) 447-6554 or Assessor (541) 447-4133 ACRES: 1.82 REAL PROPERTY TAX STATEMENT Tear Here ↑ Tear Here ↑
RETURN THIS
PAYMENT ACCOUNT NO. 2103 PAYMENT OPTIONS Discount Date Due Amount Full Payment Enclosed or 2/3 Payment Enclosed or 1/3 Payment Enclosed 3% 2% 0% 11/15/22 11/15/22 11/15/22 138.22 270.90 402.21 MAILING ADDRESS CHANGES ON BACK Enter Payment Amount $ STEPHEN C LIBBY TRUST 860 DANA CT AUBURN CA 95603-6085 MAKE PAYMENT TO: CROOK COUNTY 200 NE 2nd St Prineville, OR 97754 07100000021030000013822000002709000000402217 CROOK COUNTY TAX COLLECTOR 2022 - 2023 PROPERTY TAXES DISCOUNT IS LOST & INTEREST APPLIES AFTER DUE DATE TAX COLLECTOR HIGH DESERT ESD 3.08 CROOK COUNTY SCHOOL DIST 153.00 CENTRAL OR COMM COLLEGE 19.83 EDUCATION TOTAL: 175.91 CROOK COUNTY GENERAL FUND 123.73 AG EXTENSION SERVICE 3.86 CROOK CO HISTORICAL FUND 1.92 CROOK CO FIRE & RESCUE 50.83 HAHLEN ROAD DISTRICT 27.17 CEMETERY DISTRICT 3.18 GENERAL GOVT TOTAL: 210.69 CC JAIL BOND 6.37 CC SCHOOL BOND 19.23 COCC BOND & INTEREST 2.45 BONDS - OTHER TOTAL: 28.05 Property Information Report, page 6 (For Report Disclaimer see page 1)
SITUS:
Please Make Payment To:
(Refer to back of statement and insert enclosed for more information)
PLEASE
PORTION WITH YOUR
00 0 0 0 0 0 0 0 0 0 0 0 0 0 0 0 0 00 0 0 0 0 0 00 0 0 0 0 00 0 0 0 0 0 0 0 0 0 0 0 0 0 0 0 0 00 0 0 0 0 0 0 0 0 0 0 0 0 0 0 0 0 P O W E L L BUTTE VIE
Property Information Report, page 7 (For Report Disclaimer see page 1)
W ESTATES
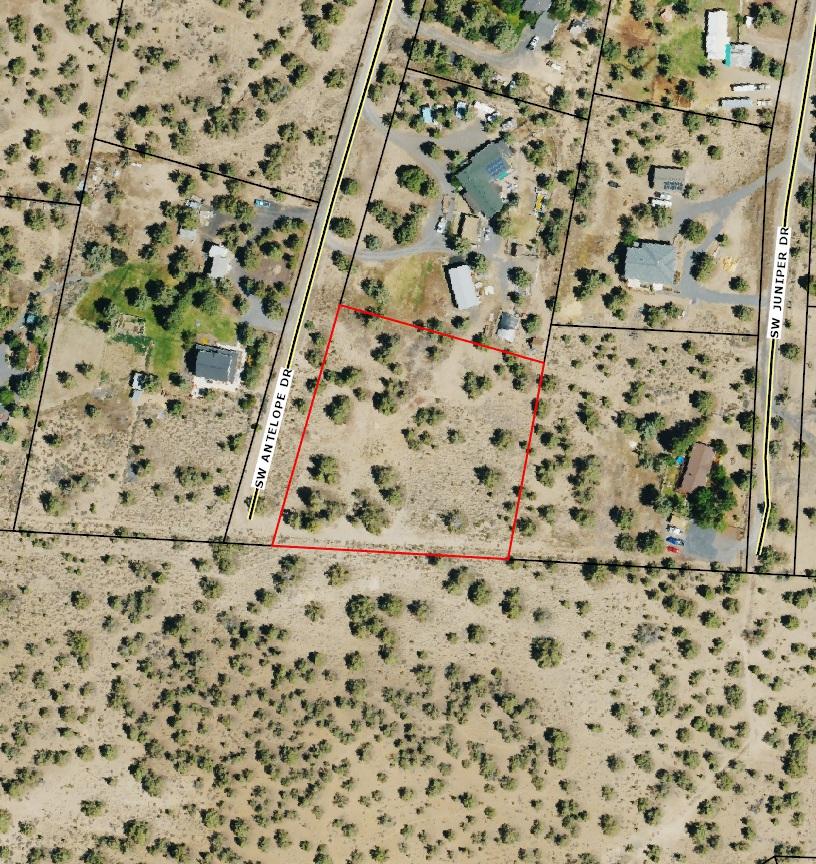
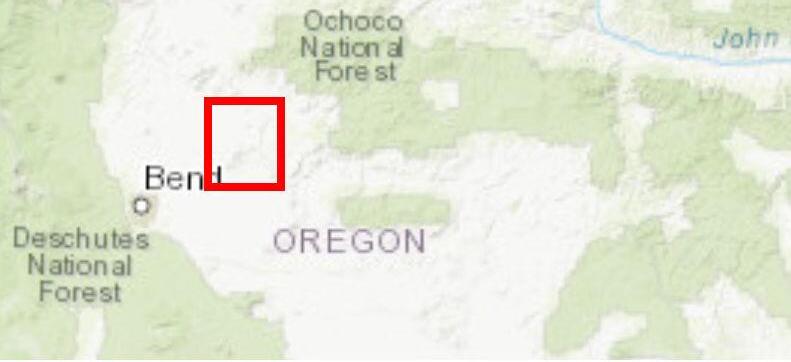
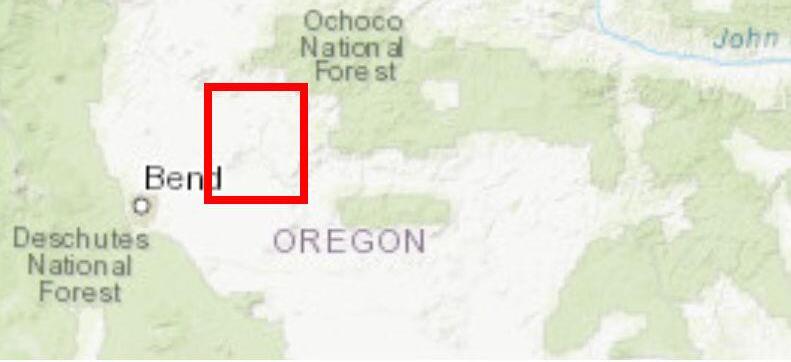
AerialMap
ParcelID:2103
TaxAccount#:161422A002500
OR97753
Thismap/platisbeingfurnishedasanaidinlocatingtheherein describedlandinrelationtoadjoiningstreets,naturalboundariesand otherland,andisnotasurveyofthelanddepictedExcepttotheextent apolicyoftitleinsuranceisexpresslymodifiedbyendorsement,ifany, thecompanydoesnotinsuredimensions,distances,locationof easements,acreageorothermattersshownthereon
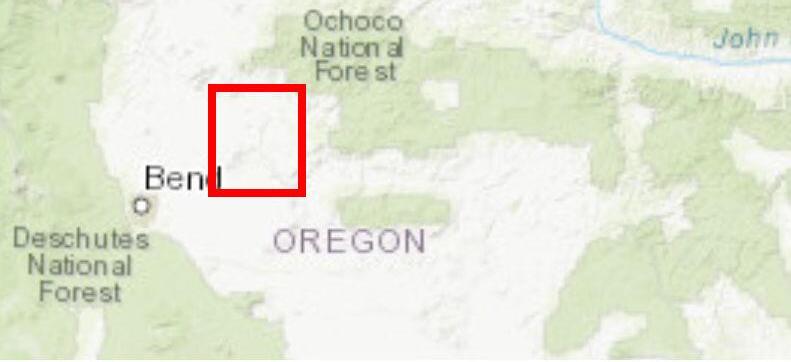
AssessorMap

ParcelID:2103
TaxAccount#:161422A002500
OR97753
Thismap/platisbeingfurnishedasanaidinlocatingtheherein describedlandinrelationtoadjoiningstreets,naturalboundariesand otherland,andisnotasurveyofthelanddepictedExcepttotheextent apolicyoftitleinsuranceisexpresslymodifiedbyendorsement,ifany, thecompanydoesnotinsuredimensions,distances,locationof easements,acreageorothermattersshownthereon
CC&R Hard CopiesAvailable upon Request
or Click on hyperlink below to view CC&R’s https://issuu.com/infodeschutestitle/docs/powell_butte_view_estates_cc_r_s_4f48f164ed7e49?fr=sOT BjMzU4ODE0NDc
Covenants, Conditions and Restrictions
CC&R’s Hard CopyAvailable Upon Request Or Clink the Hyperlink on the next page to view Electronically
CROOKCOUNTYPROPERTYPROFILEINFORMATION
Parcel#:2103
TaxLot:161422A002500
Owner:StephenCLibbyTrust
CoOwner:
Site:
OR97753
Mail:860DanaCt
AuburnCA95603
LandUse:100-ResUnimp
StdLandUse:RSFR-SingleFamilyResidence
Legal:POWELLBUTTEVIEWESTATESLot:15,Block:3,Township:16S,Range:14E,Section:22
Twn/Rng/Sec:T:16SR:14ES:22Q:NEQQ:
ASSESSMENT&TAXINFORMATION
MarketTotal:$159,090.00
MarketLand:$159,090.00
MarketImpr:
AssessmentYear:2022
AssessedTotal:$31,970.00
Exemption:
Taxes:$414.65
LevyCode:0035
LevyRate:129702
SALE&LOANINFORMATION
SaleDate:08/10/2021
SaleAmount:$299,99900
Document#:311032
DeedType:Deed
LoanAmount:$239,99900
Lender:FIRSTINTERSTATEBK
LoanType:Conventional
InterestType:ADJ
TitleCo:WESTERNTITLE&ESCROWCO
YearBuilt:
EffYearBuilt:
Bedrooms:
Bathrooms:
#ofStories:
TotalSqFt:
Floor1SqFt:
Floor2SqFt:
BasementSqFt:
PROPERTYCHARACTERISTICS
Lotsize:182Acres(79,279SqFt)
GarageSqFt:
GarageType:
AC:
Pool:
HeatSource: Fireplace:
BldgCondition:
Neighborhood:
Lot:15
Block:3
Plat/Subdiv:PowellButteViewEstates
Zoning:R5-RuralResidential
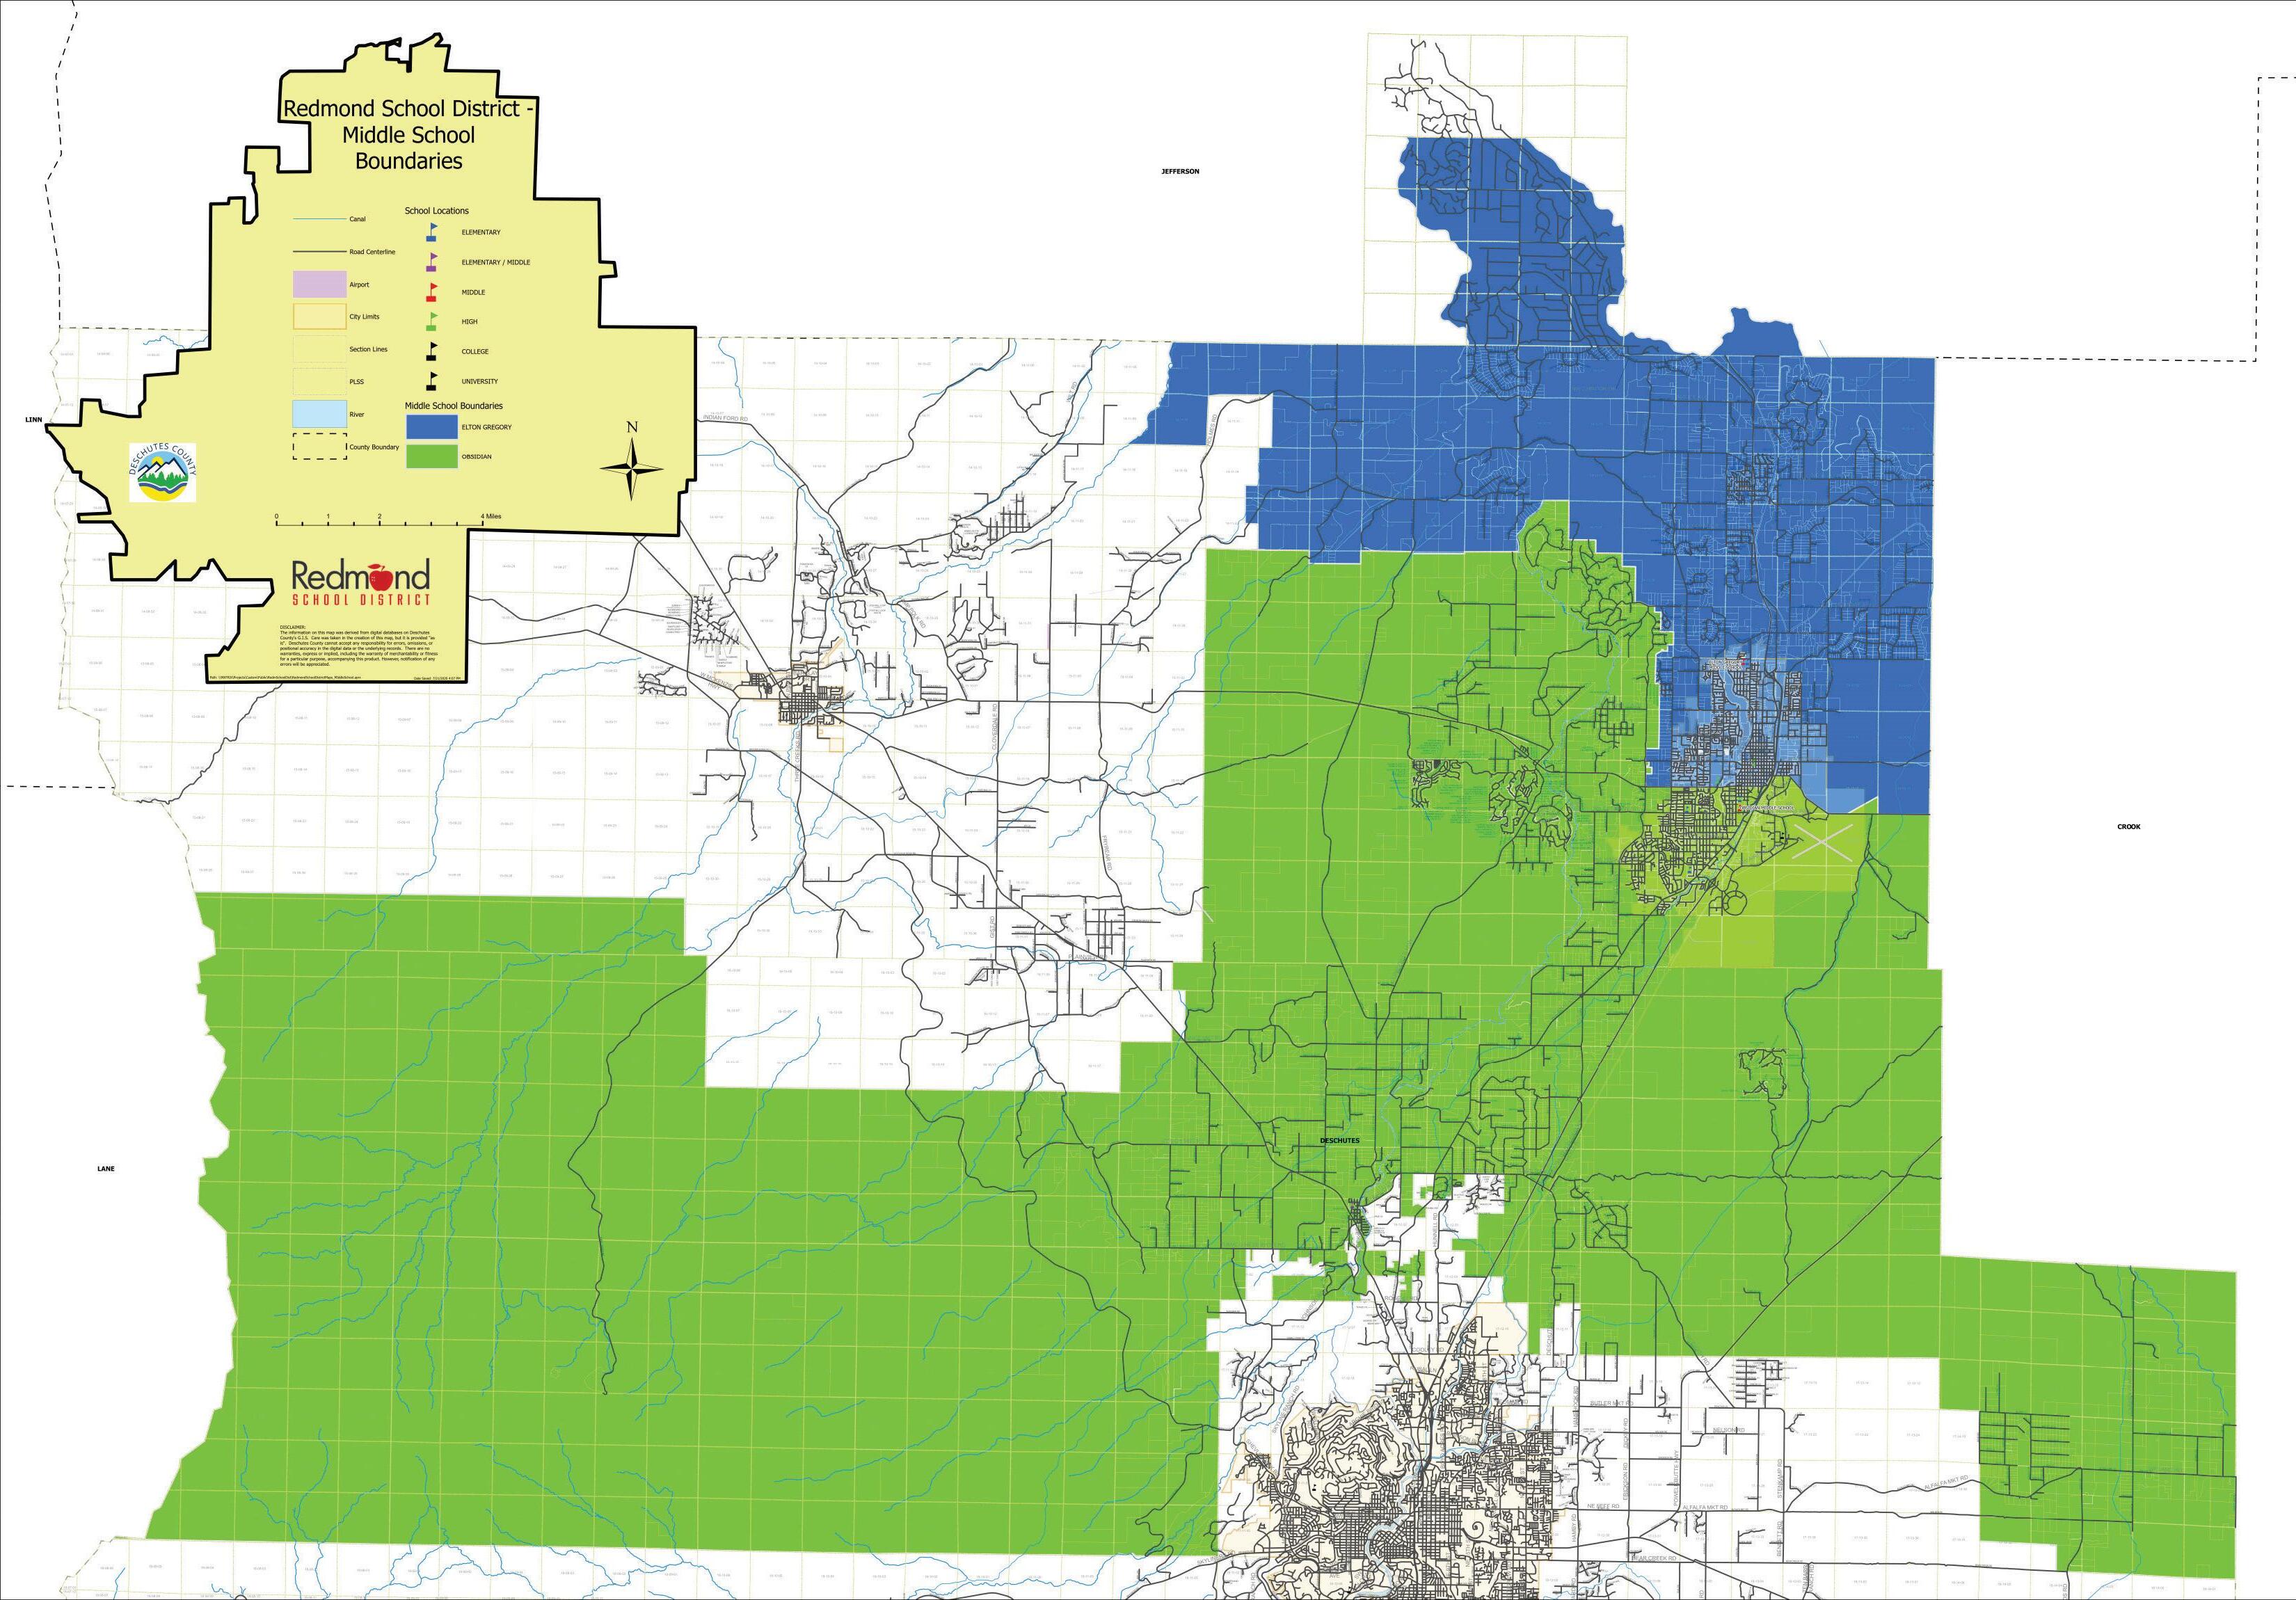
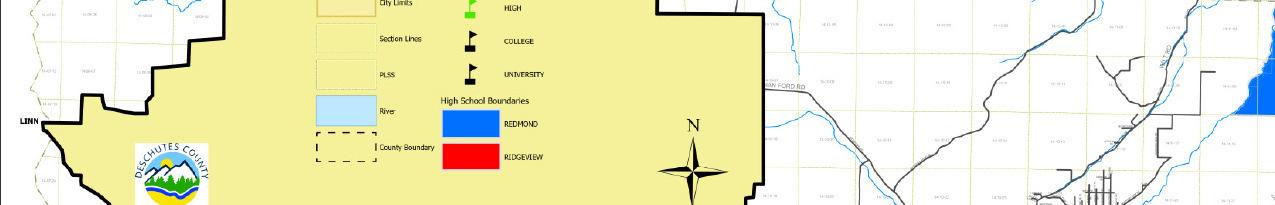
SchoolDist: PowellButteSchoolDistrict
Census:5096-950300
Recreation:
SentryDynamics,Inc anditscustomersmakenorepresentations,warrantiesorconditions,expressorimplied,astotheaccuracyorcompletenessofinformationcontainedinthisreport
Property Maps
161422A002500

SW ANTELOPE DR
D o c u m e n t P a t h : C \ U s e r s s a r a h e w i s \ D o c u m e n s \ A r c G I S \ P a c k a g e s \ C r o o k C o u n y H o m e b o o k M a p V e r 1 0 7 8 9 A D 2 9 3 26 E 6 14 9 D 48 3 1 F3 8 E 2 4 1 9 8 B 0 0 2 \ v 1 0 \ C r o o k C o u n y H o m e b o o k M a p V e r 1 0 7 m x d D a e : 7 / 5 / 2 0 2 3 0 100 200 50 Fee t
Source: Esri, Maxar, E arthstar Geographics, and the GIS User Community
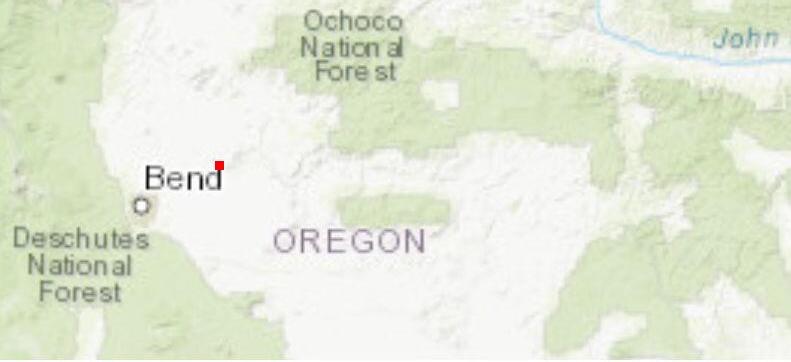
Aerial Map 16 1 42 2 A0 0 25 0 0 ! 38 0 ! 27 ! 26 ! 12 6 ! 37 0 Bend Redmond Pr ine ville Sis ter s John Da y Mitche ll Se nec a Culv er Day ville Sources: Esri, HERE, Garmin, Intermap, increment P Corp , Map D ata is deemed reliable but not guaranteed Deschutes County Title accepts no responsibility for accuracy
Source: Esri, Maxar, E arthstar Geographics, and the GIS User Community
161422A002500

D o c u m e n t P a t h : C \ U s e r s s a r a h e w i s \ D o c u m e n s \ A r c G I S \ P a c k a g e s \ C r o o k C o u n y H o m e b o o k M a p V e r 1 0 7 8 9 A D 2 9 3 26 E 6 14 9 D 48 3 1 F3 8 E 2 4 1 9 8 B 0 0 2 \ v 1 0 \ C r o o k C o u n y H o m e b o o k M a p V e r 1 0 7 m x d D a e : 7 / 5 / 2 0 2 3 0 9,250
4,625 Fee t
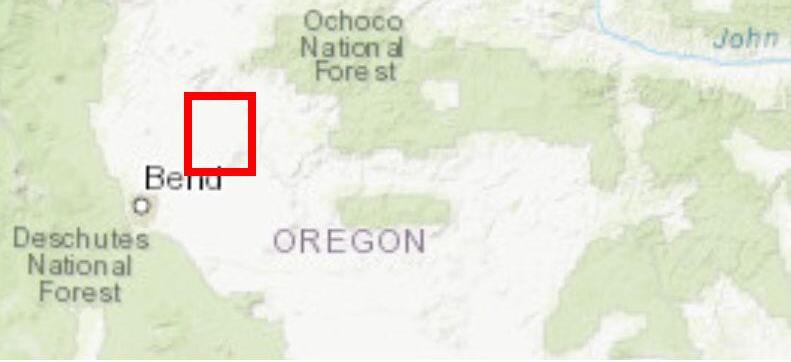
16 1 42 2 A0 0 25 0 0 ! 38 0 ! 27 ! 26 ! 12 6 ! 37 0 Bend Redmond Pr ine ville Sis ter s John Da y Mitche ll Se nec a Culv er Day ville Sources: Esri, HERE, Garmin, Intermap, increment P Corp , Map D ata is deemed reliable but not guaranteed Deschutes County Title accepts no responsibility for accuracy Urban G rowth B oundary Map Pr in eville UGB
18,500

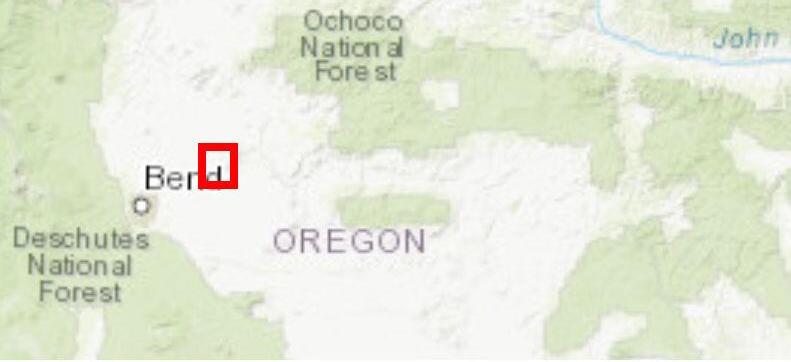
n n s n s n ns s n s n s Cou nty She r f Cou n y Sea ch & Re s cu e P n ev e F re S a t on C ty o P ne v le Pol c e St C h l M d C County Sherif f County Search & Resc ue Prineville Fire S tation City of P rineville P olice Powell Butte Fire St ation Juniper Canyon Fire Station St. Charles M edical C e Source: Esri, Maxar, E arthstar Geographics, and the GIS User Community D o c u m e n t P a t h : C \ U s e r s s a r a h e w i s \ D o c u m e n s \ A r c G I S \ P a c k a g e s \ C r o o k C o u n y H o m e b o o k M a p V e r 1 0 7 8 9 A D 2 9 3 26 E 6 14 9 D 48 3 1 F3 8 E 2 4 1 9 8 B 0 0 2 \ v 1 0 \ C r o o k C o u n y H o m e b o o k M a p V e r 1 0 7 m x d D a e : 7 / 5 / 2 0 2 3 0 11,000 22,000 5,500 Fee t 161422A002500 16 1 42 2 A0 0 25 0 0 ! 38 0 ! 27 ! 26 ! 12 6 ! 37 0 Bend Redmond Pr ine ville Sis ter s John Da y Mitche ll Se nec a Culv er Day ville Sources: Esri, HERE, Garmin, Intermap, increment P Corp , Map D ata is deemed reliable but not guaranteed Deschutes County Title accepts no responsibility for accuracy Emergenc y Serv ic es
Source: Esri, Maxar, E arthstar Geographics, and the GIS User Community
161422A002500
D o c u m e n t P a t h : C \ U s e r s s a r a h e w i s \ D o c u m e n s \ A r c G I S \ P a c k a g e s \ C r o o k C o u n y H o m e b o o k M a p V e r 1 0 7 8 9 A D 2 9 3 26 E 6 14 9 D 48 3 1 F3 8 E 2 4 1 9 8 B 0 0 2 \ v 1 0 \ C r o o k C o u n y H o m e b o o k M a p V e r 1 0 7 m x d D a e : 7 / 5 / 2 0 2 3 0 8,000 16,000 4,000 Fee t
16 1 42 2 A0 0 25 0 0 ! 38 0 ! 27 ! 26 ! 12 6 ! 37 0 Bend Redmond Pr ine ville Sis ter s John Da y Mitche ll Se nec a Culv er Day ville Sources: Esri, HERE, Garmin, Intermap, increment P Corp , Map D ata is deemed reliable but not guaranteed Deschutes County Title accepts no responsibility for accuracy Rai l Road M ap
Source: Esri, Maxar, E arthstar Geographics, and the GIS User Community
161422A002500
D o c u m e n t P a t h : C \ U s e r s s a r a h e w i s \ D o c u m e n s \ A r c G I S \ P a c k a g e s \ C r o o k C o u n y H o m e b o o k M a p V e r 1 0 7 8 9 A D 2 9 3 26 E 6 14 9 D 48 3 1 F3 8 E 2 4 1 9 8 B 0 0 2 \ v 1 0 \ C r o o k C o u n y H o m e b o o k M a p V e r 1 0 7 m x d D a e : 7 / 5 / 2 0 2 3 0 4,100 8,200 2,050 Fee t
16 1 42 2 A0 0 25 0 0 ! 38 0 ! 27 ! 26 ! 12 6 ! 37 0 Bend Redmond Pr ine ville Sis ter s John Da y Mitche ll Se nec a Culv er Day ville Sources: Esri, HERE, Garmin, Intermap, increment P Corp , Map D ata is deemed reliable but not guaranteed Deschutes County Title accepts no responsibility for accuracy Water Course Map Lege n d Wate r Bo die s Floo dplai n
Source: Esri, Maxar, E arthstar Geographics, and the GIS User Community
Oc hoco State Scenic Viewpoint Meadow
County Fairgrounds
Park Oc hoco Creek Park
Park
Lak es Golf Course Crook
Crooked River
Gary A Ward Park Yellowpine
D o c u m e n t P a t h : C \ U s e r s s a r a h e w i s \ D o c u m e n s \ A r c G I S \ P a c k a g e s \ C r o o k C o u n y H o m e b o o k M a p V e r 1 0 7 8 9 A D 2 9 3 26 E 6 14 9 D 48 3 1 F3 8 E 2 4 1 9 8 B 0 0 2 \ v 1 0 \ C r o o k C o u n y H o m e b o o k M a p V e r 1 0 7 m x d D a e : 7 / 5 / 2 0 2 3 0 9,250 18,500 4,625 Fee t
16 1 42 2 A0 0 25 0 0 ! 38 0 ! 27 ! 26 ! 12 6 ! 37 0 Bend Redmond Pr ine ville Sis ter s John Da y Mitche ll Se nec a Culv er Day ville Sources: Esri, HERE, Garmin, Intermap, increment P Corp , Map D ata is deemed reliable but not guaranteed Deschutes County Title accepts no responsibility for accuracy Parks Map
161422A002500
Source: Esri, Maxar, E arthstar Geographics, and the GIS User Community
! !
ow Lakes Go lf C ourse
ineville
and Coun tr y Club
Mead
Pr
Golf
D o c u m e n t P a t h : C \ U s e r s s a r a h e w i s \ D o c u m e n s \ A r c G I S \ P a c k a g e s \ C r o o k C o u n y H o m e b o o k M a p V e r 1 0 7 8 9 A D 2 9 3 26 E 6 14 9 D 48 3 1 F3 8 E 2 4 1 9 8 B 0 0 2 \ v 1 0 \ C r o o k C o u n y H o m e b o o k M a p V e r 1 0 7 m x d D a e : 7 / 5 / 2 0 2 3 0 11,000 22,000 5,500 Fee t
16 1 42 2 A0 0 25 0 0 ! 38 0 ! 27 ! 26 ! 12 6 ! 37 0 Bend Redmond Pr ine ville Sis ter s John Da y Mitche ll Se nec a Culv er Day ville Sources: Esri, HERE, Garmin, Intermap, increment P Corp , Map D ata is deemed reliable but not guaranteed Deschutes County Title accepts no responsibility for accuracy Golf Course Map
161422A002500
Source: Esri, Maxar, E arthstar Geographics, and the GIS User Community
161422A002500

RA NCH PO WEL L BUT TE VIEW ESTAT ES
BRASADA
D o c u m e n t P a t h : C \ U s e r s s a r a h e w i s \ D o c u m e n s \ A r c G I S \ P a c k a g e s \ C r o o k C o u n y H o m e b o o k M a p V e r 1 0 7 8 9 A D 2 9 3 26 E 6 14 9 D 48 3 1 F3 8 E 2 4 1 9 8 B 0 0 2 \ v 1 0 \ C r o o k C o u n y H o m e b o o k M a p V e r 1 0 7 m x d D a e : 7 / 5 / 2 0 2 3 0 820 1,640 410 Fee t
16 1 42 2 A0 0 25 0 0 ! 38 0 ! 27 ! 26 ! 12 6 ! 37 0 Bend Redmond Pr ine ville Sis ter s John Da y Mitche ll Se nec a Culv er Day ville Sources: Esri, HERE, Garmin, Intermap, increment P Corp , Map D ata is deemed reliable but not guaranteed Deschutes County Title accepts no responsibility for accuracy Subdiv isi on Map
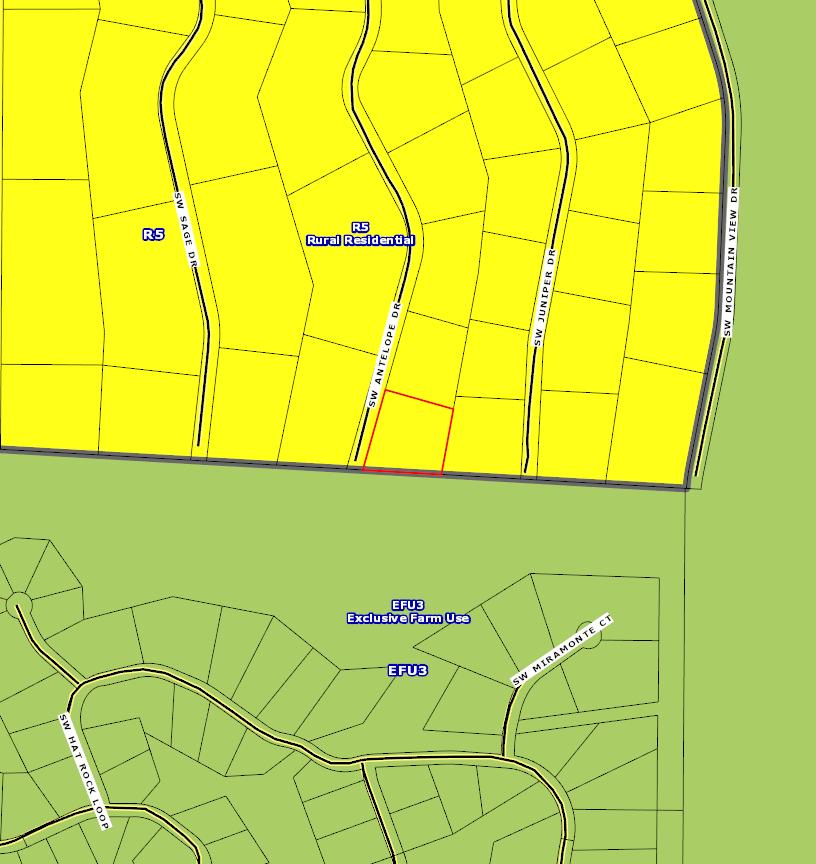
ZoningMap
ParcelID:2103
TaxAccount#:161422A002500
OR97753
Thismap/platisbeingfurnishedasanaidinlocatingtheherein describedlandinrelationtoadjoiningstreets,naturalboundariesand otherland,andisnotasurveyofthelanddepictedExcepttotheextent apolicyoftitleinsuranceisexpresslymodifiedbyendorsement,ifany, thecompanydoesnotinsuredimensions,distances,locationof easements,acreageorothermattersshownthereon
Rimroc k Trails
Crook Count y Christ ian School
Crooked River Element ary School
Powell But te Elementary Sc hool
Crook Count y High Sc hool
Crook Count y Middle Sc hool
Source: Esri, Maxar, E arthstar Geographics, and the GIS User Community
161422A002500
D o c u m e n t P a t h : C \ U s e r s s a r a h e w i s \ D o c u m e n s \ A r c G I S \ P a c k a g e s \ C r o o k C o u n y H o m e b o o k M a p V e r 1 0 7 8 9 A D 2 9 3 26 E 6 14 9 D 48 3 1 F3 8 E 2 4 1 9 8 B 0 0 2 \ v 1 0 \ C r o o k C o u n y H o m e b o o k M a p V e r 1 0 7 m x d D a e : 7 / 5 / 2 0 2 3 0 12,000 24,000 6,000 Fee t
16 1 42 2 A0 0 25 0 0 ! 38 0 ! 27 ! 26 ! 12 6 ! 37 0 Bend Redmond Pr ine ville Sis ter s John Da y Mitche ll Se nec a Culv er Day ville Sources: Esri, HERE, Garmin, Intermap, increment P Corp , Map D ata is deemed reliable but not guaranteed Deschutes County Title accepts no responsibility for accuracy Sc hools Map
Community Services


------


----------
Schools Report
SubjectParcel SiteAddress OR97753 Parcel 2103 SchoolDistrict PowellButteSchoolDistrict AssignedPrimary School PowellButteCommunityCharter School AssignedMiddle School PowellButteCommunityCharter School AssignedHighSchool CrookCountyHighSchool CrookCounty ReportDetail QueryDistanceFromParcel 1miles SchoolsInQuery 2 PrimarySchool PowellButteCommunity CharterSchool MiddleSchool HighSchool CrookCountyHighSchool OtherSchool SchoolMap
SchoolReport
School#1
SchoolDistrict CrookCountySD
DistFromSubject523miles
School PowellButteCommunityCharterSchool SiteAddress 13650SWHwy126 City PowellButte Zip 97753
1-Regularschool
211
SchoolDistrict CrookCountySD DistFromSubject1288miles
School CrookCountyHighSchool SiteAddress 1100SELynnBlvd City Prineville Zip 97754
1-Regularschool
762
Type
Students
Charter
Magnet
Title1 6-NotaTitleIschool Free/Reduced Lunch FTETeachers Count
Student/Teacher Ratio 1835 GradeLevels Kindergarten-8thGrade Male 107 Female 104 Hispanic 10 White 188 Black 2 Am Indian 2 Asian/PacificIsl. 1
Yes
Title1Elig 2-No
1150
School#2
Type
Students
Charter
Magnet Title1Elig
Title1 6-NotaTitleIschool Free/Reduced Lunch FTETeachers Count 4380 Student/Teacher Ratio 1740 GradeLevels 9thGrade-12thGrade Male 400 Female 360 Hispanic 136 White 573 Black 4 Am.Indian 3 Asian/PacificIsl 6
No
2-No
OREGON AT-A-GLANCE SCHOOL PROFILE


Powell Butte Community Charter School
PRINCIPAL: Jennifer Berry-O'Shea | GRADES: K-8 | 13650 SW Hwy 126, Powell Butte 97753 | 541-548-1166
Academic Progress
2021-22
REGULAR ATTENDERS
Students who attended more than 90% of their enrolled school days.
INDIVIDUAL STUDENT PROGRESS
Year-to-year progress in English language arts and mathematics.
58%
Academic Success
ENGLISH LANGUAGE ARTS

MATHEMATICS
Students meeting state grade-level expectations.
Data not available in 2021-22
SCIENCE
Students meeting state grade-level expectations.
School Goals
PBCCS strives to meet the needs of all learners. Among our school improvement goals are increasing student achievement in the core content areas. This includes ensuring that curriculum is aligned with standards, assessments and our place-based learning focus.
PBCCS is committed to professional development, meaningful data collection and analysis to improve student achievement, as well as creating integrated place-based learning opportunities.
State Goals
The Oregon Department of Education is partnering with school districts and local communities to ensure a 90% ontime, four year graduation rate by 2025. To progress toward this goal, the state will prioritize efforts to improve attendance, provide a well-rounded education, invest in implementing culturally responsive practices, and promote continuous improvement to close opportunity and achievement gaps for historically and currently underserved students.
Safe & Welcoming Environment
At PBCCS we are committed to building a warm and welcoming environment for all students. The school building and systems are designed to promote positive, predictable and safe learning spaces. Staff work to build relationships, create a sense of community and foster respect.
Students We Serve Student Enrollment 219 DEMOGRAPHICS American Indian/Alaska Native Students 1% Teachers 0% Asian Students <1% Teachers 0% Black/African American Students 1% Teachers 0% Hispanic/Latino Students 5% Teachers 7% Multiracial Students 3% Teachers 0% Native Hawaiian/Pacific Islander Students <1% Teachers 0% White Students 89% Teachers 93% Ever English Learners * Languages Spoken 3 Students with Disabilities 12% Required Childhood Vaccinations 91% Free/ Reduced Price Lunch >95% *<10 students or data unavailable School Environment CLASS SIZE Median class size. 23 Oregon average 22
Oregon
average 64%
Students
state grade-level expectations. 53% Oregon average 44%
meeting
Oregon
32%
39%
average
Oregon
40%
average 29%
School Website: www.powellbuttecharterschool.org Eligibility for Free/Reduced Price Lunch expanded in 2020-21, for more information please visit: www.oregon.gov/ode/schools-and-districts/reportcards/reportcards/Pages/Accountability-Measures.aspx
Powell Butte Community Charter School

Outcomes
12


REGULAR ATTENDERS
ENGLISH LANGUAGE ARTS
MATHEMATICS
88%
About Our School
BULLYING, HARASSMENT, AND SAFETY POLICIES

PBCCS strives to ensure students feel safe and secure at school. Bullying and harassment is taken seriously, and remedies to solve issues and repair relationships are of the highest priority. Systems are designed to teach and encourage problem solving, as well as empower students.
Yes
EXTRACURRICULAR ACTIVITIES
PBCCS believes in providing multiple opportunities for students to develop and foster their individual strengths. Enrichment opportunities include: Art, Music, Technology, STEM, and Outdoor Activities.
PARENT ENGAGEMENT
At PBCCS we believe that when families and schools work together, students are more successful. We encourage open communication through newsletters, social media, classroom communication and meetings. We encourage parents to share in their child’s school experience.

COMMUNITY ENGAGEMENT
PBCCS works collaboratively with the community in a number of ways. Community partners, including agencies, organizations and individuals assist PBCCS with the facilitation of our placebased learning mission by offering resources, expertise and hosting field work to support student learning. PBCCS also works with community partners to ensure students and families have access to crucial services and resources needed to be successful in school and in life.
OREGON AT-A-GLANCE SCHOOL PROFILE CONTINUED 2021-22
Our Staff (rounded FTE)
Teachers
Educational assistants <1 Counselors/ Psychologists Average teacher retention rate
% of licensed teachers
6
with more than 3 years of experience 75% Same principal in the last 3 years
American Indian/Alaska Native <10 students or data unavailable Asian <10 students or data unavailable Black/African American <10 students or data unavailable Hispanic/Latino 70% Multiracial <10 students or data unavailable Native Hawaiian/Pacific Islander <10 students or data unavailable White 56% Free/Reduced Price Lunch 58% Ever English Learner <10 students or data unavailable Students with Disabilities 36% Migrant <10 students or data unavailable Homeless <10 students or data unavailable Students in Foster Care <10 students or data unavailable Talented and Gifted <10 students or data unavailable Female 60% Male 57% Non-Binary <10 students or data unavailable
<10 students or data unavailable <10 students or data unavailable <10 students or data unavailable <10 students or data unavailable <10 students or data unavailable <10 students or data unavailable 53% 53% <10 students or data unavailable 11% <10 students or data unavailable <10 students or data unavailable <10 students or data unavailable <10 students or data unavailable 58% 48% <10 students or data unavailable
<10 students or data unavailable <10 students or data
<10 students
<10 students
<10 students
42% 39% <10 students or data unavailable <5% <10 students or data unavailable <10 students or data unavailable <10 students or data unavailable <10 students or data unavailable 32% 45% <10 students or data unavailable
unavailable <10 students or data unavailable
or data unavailable
or data unavailable
or data unavailable
Data are suppressed to protect confidential student information. For more information please visit: www.oregon.gov/ode/schools-and-districts/reportcards/reportcards/Pages/Accountability-Measures.aspx
OREGON AT-A-GLANCE SCHOOL PROFILE
Crook County High School
PRINCIPAL: Michelle Jonas | GRADES: 9-12 | 1100 SE Lynn Blvd, Prineville 97754 | 541-416-6900
REGULAR ATTENDERS
Students who attended more than 90% of their enrolled school days.
2021-22
Academic Progress
ON-TRACK TO GRADUATE
Students earning one-quarter of graduation credits in their 9th grade year. >95%
Academic Success
Students earning a diploma within four years. Cohort includes students who were first-time ninth graders in 2017-18 graduating in 2020-21
FIVE-YEAR COMPLETION
Students earning a high school diploma or GED within five years. Cohort Includes students who were firsttime ninth graders in 2016-17 finishing in 2020-21
COLLEGE GOING
Students enrolling in a two or four year college within 16 months of completing high school in 201920. Data from the National Student Clearinghouse.
School Goals
At Crook County High School, we strive to ensure that all students graduate college and career ready. Our community has expressed a strong desire for College Technical Education options and so, we have dramatically increased our CTE offerings. What's more, programs such as AVID, PBIS, Link Crew, and Juntos are designed to help our students achieve this mission. These intentional efforts have led to increases in our freshman on track and graduation rates. As a staff, we take a holistic approach focusing on the individual student as a human-being with a story and who is one caring adult relationship away from success.
97% Oregon average 88%
State Goals
The Oregon Department of Education is partnering with school districts and local communities to ensure a 90% ontime, four year graduation rate by 2025. To progress toward this goal, the state will prioritize efforts to improve attendance, provide a well-rounded education, invest in implementing culturally responsive practices, and promote continuous improvement to close opportunity and achievement gaps for historically and currently underserved students.
41% Oregon average 56%
Safe & Welcoming Environment
At Crook County High School we understand the importance of providing students a safe and welcoming learning environment. Staff actively use positive behavioral interventions and support (PBIS) strategies and Character Strong social emotional learning curriculum to create a positive school culture. CCHS offers a Welcome Center with bilingual staff available to assist parents who are not native English speakers. All communication sent home is translated for parent access and interpreters are available as needed for parent meetings.
Students We Serve Student Enrollment 673
Indian/Alaska Native Students <1% Teachers 0% Asian Students 1% Teachers 2% Black/African American Students 1% Teachers 0% Hispanic/Latino Students 18% Teachers 2% Multiracial Students 5% Teachers 0% Native Hawaiian/Pacific Islander Students 0% Teachers 0% White Students 75% Teachers 96% Ever English Learners 12% Languages Spoken 10 Students with Disabilities 15%
Childhood Vaccinations 95% Free/ Reduced Price Lunch >95% *<10 students or data unavailable
DEMOGRAPHICS American
Required
CLASS SIZE
School Environment
18 Oregon average 22
Median size of classes in core subjects.
59% Oregon average 64%
Oregon average 83%
ON-TIME GRADUATION
98% Oregon average 81%
School Website: cchs.crookcounty.k12.or.us/ Eligibility for Free/Reduced Price Lunch expanded in 2020-21, for more information please visit: www.oregon.gov/ode/schools-and-districts/reportcards/reportcards/Pages/Accountability-Measures.aspx
Our Staff (rounded FTE)
44
Outcomes
REGULAR ATTENDERS
ON-TRACK TO GRADUATE
ON-TIME GRADUATION
91%
Coming in 2022-23
About Our School
ADVANCED COURSEWORK
Crook County High School offers 9 distinct AP courses.
· Chemistry, Physics, Calculus, Statistics, Human Geography, US History, Government, Literature and Composition, Language and Composition
We also offer 34 dual-enrollment classes that are articulated through a variety of community colleges and universities. Highlights include:
· Biology, Anatomy and Physiology, Spanish and Freshmen Success and WR 121, Business 101, Pre-Veterinary practices and Health Occupations among others.
CAREER & TECHNICAL EDUCATION
Our students have the opportunity to enroll in a variety of CTE courses in which they can receive dual credit, participate in internships and learn work force skills. These courses include:
Agricultural Science
Business Marketing
Communications Technology
Construction Technology
Culinary Arts
Graphic Design Media
Natural Resources
Health Sciences
Manufacturing and Engineering
EXTRACURRICULAR ACTIVITIES
Extra Curricular involvement is an area of particular strength at Crook County High School. The CC Connect Initiative reimburses Crook County High School staff for facilitating clubs and organizations and has resulted in the formation of over 30 such groups. These offerings include:
· 18 Interscholastic Sports
· 4 Service Clubs
· Drama
· Band
· Choir
· Leadership
· Link Crew
PARENT & COMMUNITY ENGAGEMENT
Crook County High School engages our parents and community by offering events that are open for parents and community members to attend including:
· Freshman Orientation
· Beyond High School Night
· AVID Parent Nights
· Fall/Spring Conferences
· Career Fair
· Booster Club
www.oregon.gov/ode/schools-and-districts/reportcards/reportcards/Pages/Accountability-Measures.aspx
OREGON AT-A-GLANCE SCHOOL PROFILE CONTINUED 2021-22 Crook County High School
Teachers
Educational assistants
Counselors/ Psychologists Average teacher retention rate
% of licensed teachers
7
3
with more than 3 years of experience 80% Same principal in the last 3 years Yes
American Indian/Alaska Native <10 students or data unavailable Asian <10 students or data unavailable Black/African American <10 students or data unavailable Hispanic/Latino 57% Multiracial 47% Native Hawaiian/Pacific Islander <10 students or data unavailable White 60% Free/Reduced Price Lunch 59% Ever English Learner 53% Students with Disabilities 55% Migrant <10 students or data unavailable Homeless 31% Students in Foster Care <10 students or data unavailable Talented and Gifted 75% Female 59% Male 60% Non-Binary <10 students or data unavailable
<10 students or data unavailable <10 students or data unavailable <10 students or data unavailable >95% <10 students or data unavailable <10 students or data unavailable >95% >95% >95% 90% <10 students or data unavailable <10 students or data unavailable <10 students or data unavailable >95% >95% 93% <10 students or data unavailable
<10 students or data unavailable <10 students or data unavailable <10 students or data unavailable >95% <10 students or data unavailable <10 students or data unavailable >95% >95% >95% >95% <10 students or data unavailable <10 students or data unavailable <10 students or data unavailable <10 students or data unavailable >95% >95%
Data are suppressed to protect confidential student information. For more information please visit:


Places to Go & Things to Do


Food Trucks/Carts
https://www.visitbend.com/food-drink/restaurants/food-carts/
https://www.google.com/search?q=food+carts+near+me&rlz=1C1GCEU_enUS874US875&oq=food+ca rts+&aqs=chrome.2.69i57j0i512j0i457i512j0i402j46i175i199i512l2j0i512l4.9132j0j15&sourceid=chrom e&ie=UTF-8
https://www.menupix.com/oregon/cn/158/370037/Food-Trucks-Prineville
https://www.google.com/search?q=food+trucks+in+sisters+oregon&rlz=1C1GCEU_enUS874US875&ei =nMxVYpS4Ns2dkPIPufeDoAg&oq=food+trucks+in+Sisters&gs_lcp=Cgdnd3Mtd2l6EAEYADIFCAAQgAQ yBQgAEIYDMgUIABCGAzoLCC4QgAQQxwEQrwE6BggAEBYQHkoECEEYAEoECEYYAFAAWPcKYNAiaABw AXgAgAHRAYgBugmSAQUwLjYuMZgBAKABAcABAQ&sclient=gws-wiz
https://www.google.com/search?q=food+trucks+in+madras&rlz=1C1GCEU_enUS874US875&ei=nMxV YpS4Ns2dkPIPufeDoAg&ved=0ahUKEwiU9pOLm4_3AhXNDkQIHbn7AIQQ4dUDCA8&uact=5&oq=food +trucks+in+madras&gs_lcp=Cgdnd3Mtd2l6EAMyBggAEBYQHjIFCAAQhgMyBQgAEIYDOgcIABBHELADO goIABBHELADEMkDOggIABCABBDJAzoFCAAQkgM6BQgAEIAEOgsILhCABBDHARCvAUoECEEYAEoECEYY AFDeEliMGmDVHGgBcAF4AIABrQGIAZoHkgEDMC42mAEAoAEByAEHwAEB&sclient=gws-wiz
https://www.google.com/search?q=food+trucks+in+culver+oregon&rlz=1C1GCEU_enUS874US875&ei =bM1VYqjDC_bTkPIP_Zuj2AY&ved=0ahUKEwioqYDum4_3AhX2KUQIHf3NCGsQ4dUDCA8&uact=5&oq =food+trucks+in+culver+oregon&gs_lcp=Cgdnd3Mtd2l6EAMyBQghEKsCOgoIABBHELADEMkDOgcIABB HELADOgYIABAWEB46BQgAEIYDOgUIIRCgAUoECEEYAEoECEYYAFD2BljNDmCFEGgBcAF4AIABswGIAcQ JkgEDMC43mAEAoAEByAEEwAEB&sclient=gws-wiz
https://pdx.eater.com/maps/best-restaurants-bend-oregon-guide
Central Oregon Healthy Food
https://www.visitbend.com/food-drink/restaurants/vegan-vegetarian-gluten-free/
https://www.google.com/search?q=healthy+eats+in+central+oregon&rlz=1C1GCEU_enUS874US875& ei=Vs5VYo6xJp_TkPIPjIqV4AI&ved=0ahUKEwiOtOXdnI_3AhWfKUQIHQxFBSwQ4dUDCA8&uact=5&oq =healthy+eats+in+central+oregon&gs_lcp=Cgdnd3Mtd2l6EAM6BggAEAcQHjoICAAQBxAFEB46BQgAEI YDSgQIQRgASgQIRhgAUABYjyhg6D5oAnABeAGAAe8DiAHND5IBCjIuMTAuMS4wLjGYAQCgAQHAAQE &sclient=gws-wiz
Kid Friendly Attractions
https://forgetsomeday.com/things-to-do-in-bend-oregon-with-kids/
https://www.cascadiakids.com/things-do-kids-bend-oregon/
https://oldmilldistrict.com/things-to-do-with-kids/
https://www.visitbend.com/things-to-do/activities/kid-family-friendly-activities/
Farmers Markets in Central Oregon
https://visitcentraloregon.com/dining/food/farmers-market/
https://www.localharvest.org/prineville-or/farmers-markets
https://hdffa.org/its-farmers-market-season/
https://redmondoregonfarmersmarket.com/
https://www.sistersfarmersmarket.com/
https://www.localharvest.org/redmond-or/farmers-markets
https://www.madrassaturdaymarket.com/
Central Oregon Breweries
https://www.visitbend.com/food-drink/restaurants/brewery-pub/
https://www.google.com/search?q=breweries+in+central+oregon&rlz=1C1GCEU_enUS874US875&oq =&aqs=chrome.0.69i59i450l8.68566434j0j15&sourceid=chrome&ie=UTF-8
https://visitcentraloregon.com/dining/drinks/breweries/redmond/
https://beermebend.com/bend-oregon-brewery-locations/
https://www.google.com/search?q=prineville+breweries&rlz=1C1CHBD_enUS1025US1025&oq=prine ville+breweries&aqs=chrome..69i57j0i22i30j0i390i650.4688j0j7&sourceid=chrome&ie=UTF-8
https://www.google.com/search?q=breweries+in+madras+oregon&rlz=1C1CHBD_enUS1025US1025& oq=breweries+in+madras+oregon&aqs=chrome..69i57.6398j0j4&sourceid=chrome&ie=UTF-8
Private Schools in Central Oregon
https://www.niche.com/k12/search/best-private-schools/c/deschutes-county-or/
https://movingtobend.com/relocation-blog/2021/a-guide-to-public-and-private-schools-in-bendoregon/
https://www.countyoffice.org/bend-or-private-schools/
Central Oregon Winter Activities
https://www.visitbend.com/things-to-do/activities/winter-fun/
https://visitcentraloregon.com/things-to-do/activities/winter/
https://www.google.com/search?q=winter+activities+central+oregon&rlz=1C1CHBD_enUS1025US102 5&oq=winter+activities+central+oregon&aqs=chrome..69i57j0i22i30l2j0i390i650l3j69i60l2.14288j0j4 &sourceid=chrome&ie=UTF-8
Central Oregon Trivia and Bingo Nights
https://www.riversplacebend.com/games
https://beermebend.com/bend-oregon-brewery-locations/
https://www.bendsource.com/bend/bingo-with-bren-supporting-saving-grace/Event?oid=16320982
https://www.visitbend.com/food-drink/astro-lounge/
https://theyardfoodpark.com/events/
https://www.silvermoonbrewing.com/events
https://www.bendsource.com/bend/tuesday-night-trivia-in-redmond/Event?oid=18829261
Calendar of Events for Central Oregon
https://visitcentraloregon.com/calendar-of-events
https://www.bendsource.com/bend/EventSearch?v=g#grid
https://www.visitbend.com/event-calendar/
Economic Development For Central Oregon

ECONOMIC DEVELOPMENT FOR CENTRAL OREGON EDCOINFO.COM #EDCOINFO @EDCOINFO 705 SW BONNETT WAY SUITE 1000 BEND, OR 97702 541.388.3236 2022 CENTRAL OREGON ECONOMIC PROFILE
Table of Contents
Welcome to Central Oregon
Where the commute times are short and breathtaking views await you at every turn. The region features dramatic snow-capped mountain ranges and high desert plateaus within Deschutes, Crook and Jefferson counties.
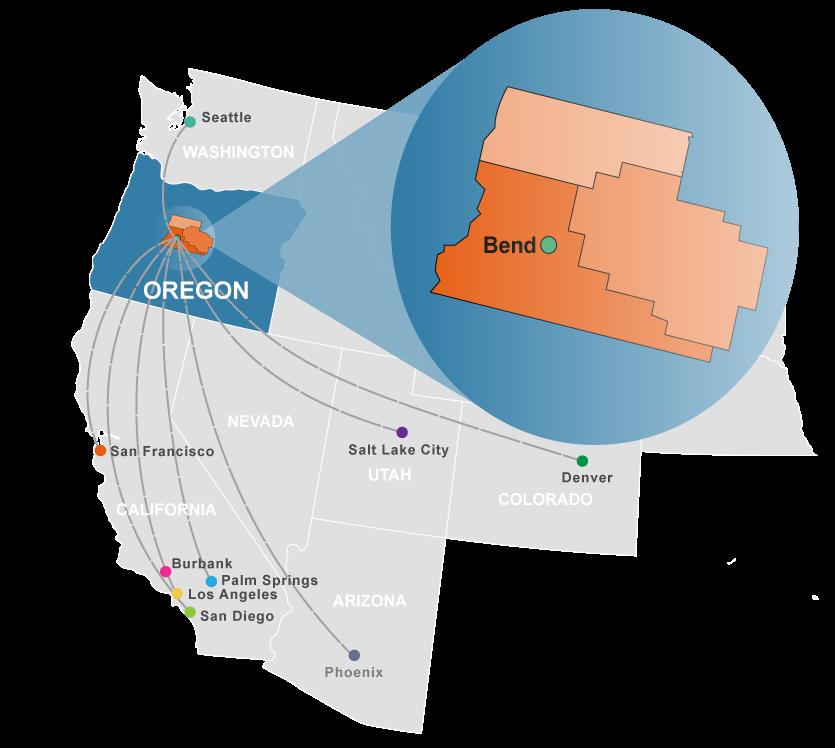
Located halfway between San Francisco and Seattle, one of the hottest small metropolitan markets in the U.S. is Central Oregon. In the last decade the region has seen some of the highest sustained GDP growth, job growth and population growth. With these factors in mind, The Milken Institute has named the region the best small metropolitan in the nation four years in a row – an unprecedented feat no other location has ever received.
Central Oregon is pulling extraordinary talent and capital, fostering a diverse and highly entrepreneurial business ecosystem. Deschutes County received the most investment in Oregon in 2022, according to Smartasset. Lured by natural scenic beauty and big city amenities without big city costs or hassle, people are learning that having a true work-life balance is possible. Employees are happier and companies are more innovative and capital-efficient. All in a region dominated by small to mid-sized firms that compete globally – and win.
Welcome........................................................................................................ Central Oregon Overview................................................................................ Population..................................................................................................... Move.............................................................................................................. Relocate / Expand.......................................................................................... Start................................................................................................................ Entrepreneurial Support................................................................................. Grow............................................................................................................... Workforce...................................................................................................... Delivering What Is Expected......................................................................... Transportation............................................................................................... Services / Infrastructure................................................................................ Top Employers............................................................................................... Foundations of Central Oregon’s Economy................................................... Lifestyle......................................................................................................... About EDCO................................................................................................... 2 3 4 6 7 8 9 10 11 12 13 14 15 16 20 21 Page 2 - Economic Development for Central Oregon
CENTRAL OREGON OVERVIEW
Regional Population: 253,761
(2021 estimates from Portland State University)
Regional Labor Force: 123,953
(Seasonally adjusted total for 2021 from Oregon Employment Department)
Bend-Redmond MSA GDP Per Capita: $54,390
(2020 estimate from the Bureau of Economic Analysis)
*Bureau of Economic Analysis data is only available for the Bend-Redmond MSA
Access to and from our region has never been easier with five national carriers flying up to 54 segments daily to nine international airports. Central Oregon is served by one of the most vibrant and successful regional airports in the country at Redmond (RDM).
edcoinfo.com - Page 3
Central Oregon has been among the fastest growing regions anywhere in the U.S.
In-migration has been the dominating factor in the region’s growth. With millions of visitors annually, Central Oregon continues to attract thousands of new residents from all over the country each year for it’s outdoor amenities, arts and culture opportunities, quality healthcare, and a growing education system.

“Central Oregon’s economic growth is stronger than the state and nation overall. The primary reason is the high quality of life that attracts new residents. Faster population growth means local businesses can hire and expand at a faster rate due to the influx of working-age migrants and the growing labor force.”
Josh Lehner Economist, Oregon Office of Economic Analysis
Oregon Jefferson County 11.4% 14.6% 85.2% 63.7% Area POPULATION CHANGES FOR CENTRAL OREGON Percent Change 2010 - 2021 Net Migration % 2010 - 2021 Counties Deschutes County 28.9% 89.0% Crook County 21.5% 81.1% Source: Population Research Center, PSU 2021. Oregon Employment Department, 2021. Page 4 - Economic Development for Central Oregon
POPULATION
NEW RESIDENTS, NEW IDEAS & NEW ENERGY

#1 TOP 10 COOLEST PLACES TO GO IN THE NEXT 10 YEARS
With over 4.5 million visitors flocking to Central Oregon each year, it proves a great introduction to our region’s culture, lifestyle and a great first impression for businesses. Central Oregon and the Bend-Redmond MSA continually top the nation in population growth. In fact, Bend has been among the 15 fastest growing cities in the U.S. five of the last six years. While our population grows, so does our workforce. We’re cultivating a community that has consciously decided to live here and attracting new talent pools to serve the increasing demand for labor.
POPULATION TOTALS FOR CENTRAL OREGON
- FORBES , 2021 Oregon 3,837,300 4,237,256 3,421,399 4,013,845 4,266,620 Area 2010 2020 2000 2015 2021 Crook County 21,020 23,440 19,184 21,085 25,482 Deschutes County 157,905 197,015 115,367 170,740 203,390 Bend 76,740 92,840 52,029 81,310 100,922 La Pine 1,660 2,005 1,670 2,654 Redmond 26,225 32,215 13,481 27,050 36,122 Sisters 2,040 3,220 959 2,280 3,286 Unincorporated 51,240 66,735 48,898 53,151 60,406 Jefferson County 21,750 24,105 19,009 22,445 24,889 Tri-County Total Source: Population Research Center, PSU. 2000 & 2010 Census numbers are for April 1 of that year; 2015-2021 data are for July 1 of that year. 200,675 244,560 153,560 214,270 253,761 Not incorporated
11.4% % Growth 2010-2021 21.5% 28.9% 24.1% 27.4% 38.0% 15.3% 14.6% 20.9% 37.7% edcoinfo.com - Page 5
MOVE
Business Cost Comparison
Oregon offers more incentive programs to traded-sector* businesses than Washington or California. Even without taking those incentives into consideration, Oregon is still a more cost-effective choice for doing business. Contact EDCO for a detailed look at the business costs in Central Oregon.


*companies that sell their products or services outside the area, bringing new jobs and capital investment to the area
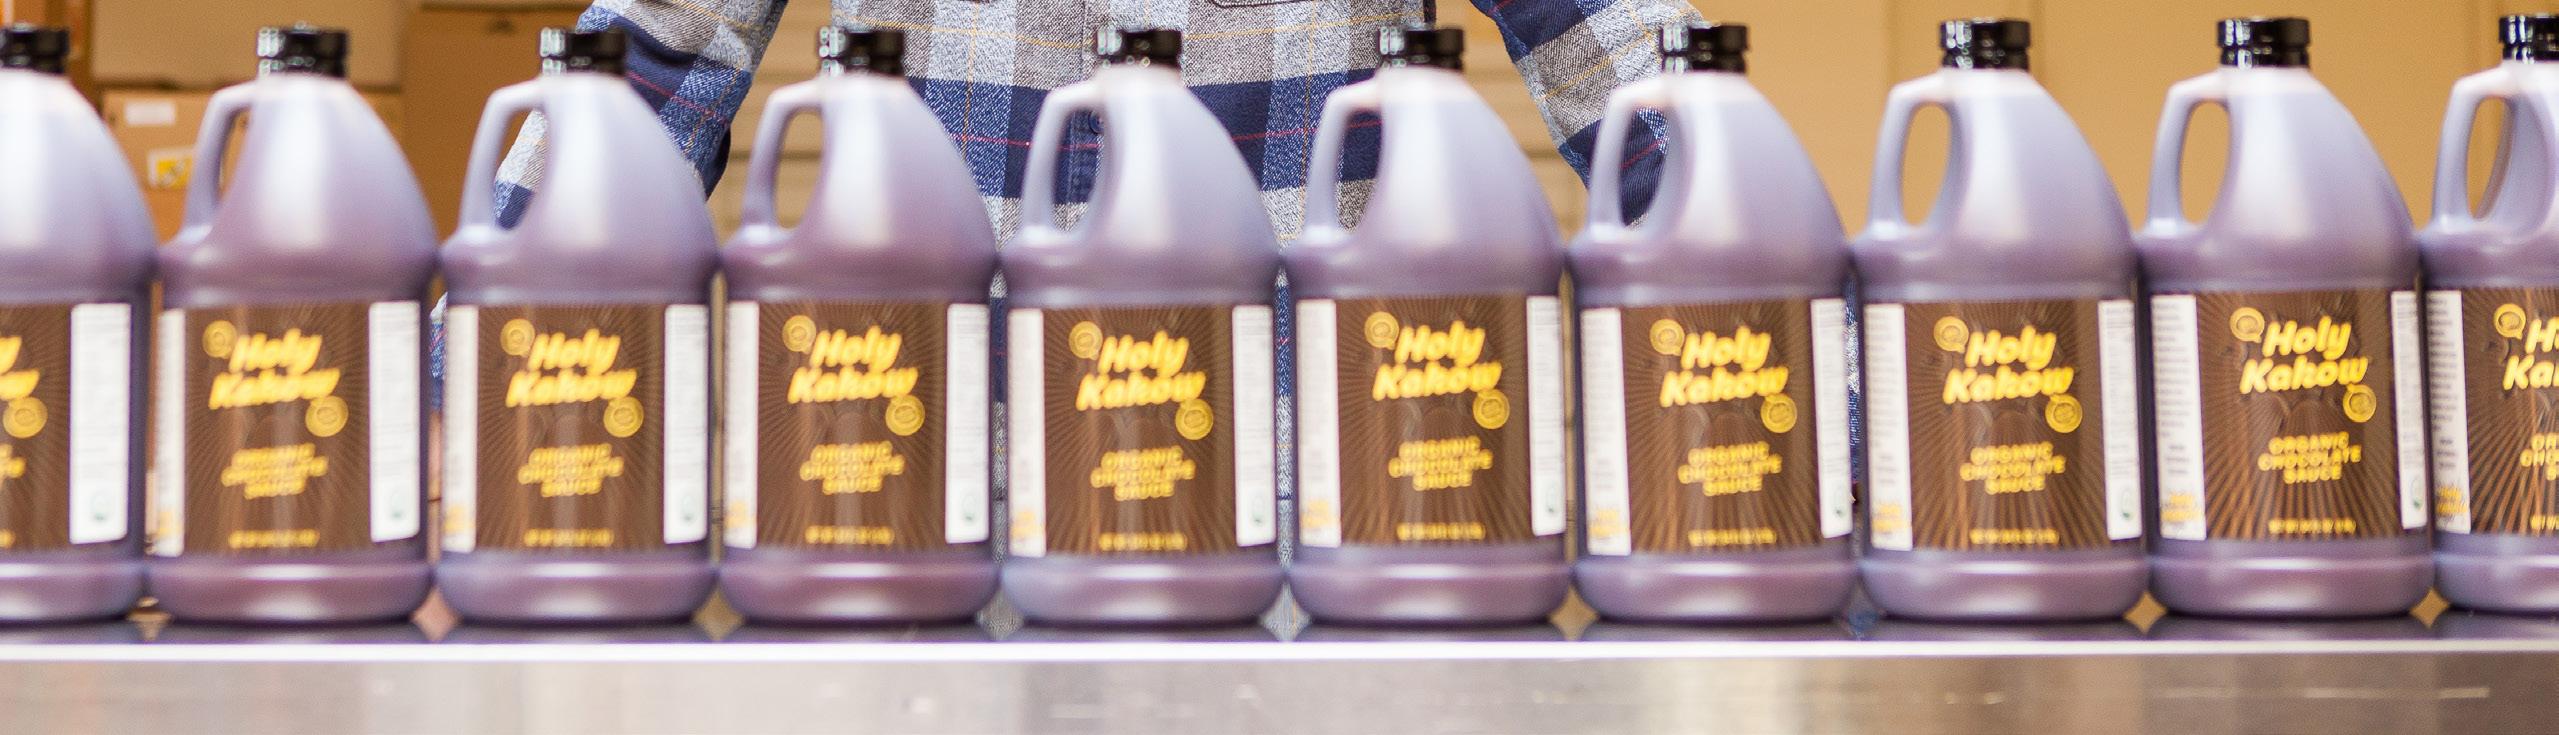
“While our move to Central Oregon may have started for personal reasons, it has allowed us to do more with our business than we thought possible. It has allowed us to hire amazing employees – the available talent here in Central Oregon has proven to be of the highest caliber and chocked full of integrity. Sometimes you feel like you can get lost in a big city. In Sisters we have been able to be part of a growing and nurturing business community.” - Wyatt Woods, President and Owner, Holy Kakow
Case Study: Holy Kakow


Founded in Portland in 2009, Holy Kakow creates premium organic chocolate sauces and syrups that are used in coffee shops across the nation and globe. After running the business for nearly a decade, Founder Wyatt Woods decided a move to the City of Sisters would be beneficial for his family. The next step was to figure out how to move the successful business. After EDCO’s help with site selection, incentives, permitting, and more, Holy Kakow was able to move their operations into a new building in the Sisters Business Park. The relocation allowed them to scale for growth, even during the pandemic, expanding their employment from three to eight in the span of a couple months. Holy Kakow have their sights set on new product launches. With the backing of the community and the growing number of craft food businesses in Sisters, the company is surrounded by a strong business ecosystem to help them succeed.
6.16¢ Avg. Electricity Rate (¢/kWh) None State & Local Sales Tax Rate $4.73 Avg. Natural Gas Rate ($/kcf) #22 State Business Tax Climate Index OR 15.14¢ 7.25%+ $9.74 #48 CA 5.81¢ 6.5%+ $7.72 #15 WA
We guide employers outside the region through the relocation process as a resource for regional data, incentives, talent, site selection, and A-Z problem solving.
Page 6 - Economic Development for Central Oregon
Sources: Tax Foundation 2022, US Energy Information Association (Natural Gas) 2021, US Energy Information Association (Electricity) 2021
RELOCATE & EXPAND
Get connected to our growing industry clusters that include: craft brewing/distilling, bioscience, outdoor products, technology, aerospace, and advanced manufacturing.

We link you to tools to help your company including: connections to the local supply chain, talent acquisition, incentives, business finance, market intelligence, and more.
WHY CENTRAL OREGON?
Central Oregon offers a pro-business environment with several incentives and supportive business finance options to encourage economic growth. Oregon also allows corporate net operating losses to be carried forward for up to 15 years without a cap, which can meaningfully reduce your business’s tax liability.
We help you navigate the regional and local real estate market, infrastructure and permitting processes.
For businesses looking to relocate, Central Oregon has a reputation for welcoming new companies. The region offers a tightknit community without sacrificing talent, education opportunities, or quality healthcare. EDCO’s network can help your business streamline decisions when choosing a new home.
edcoinfo.com - Page 7
We mentor and advise scalable young companies from concept to exit on issues such as access to capital, critical expertise and business strategy.
“The support we’ve received from EDCO and other organizations has been tremendous and allowed us to grow and develop our network and further develop our business in a short time. Their proactive approach to assisting and encouraging entrepreneurship in this region has been paramount to some of the large strides we’ve taken this year.”
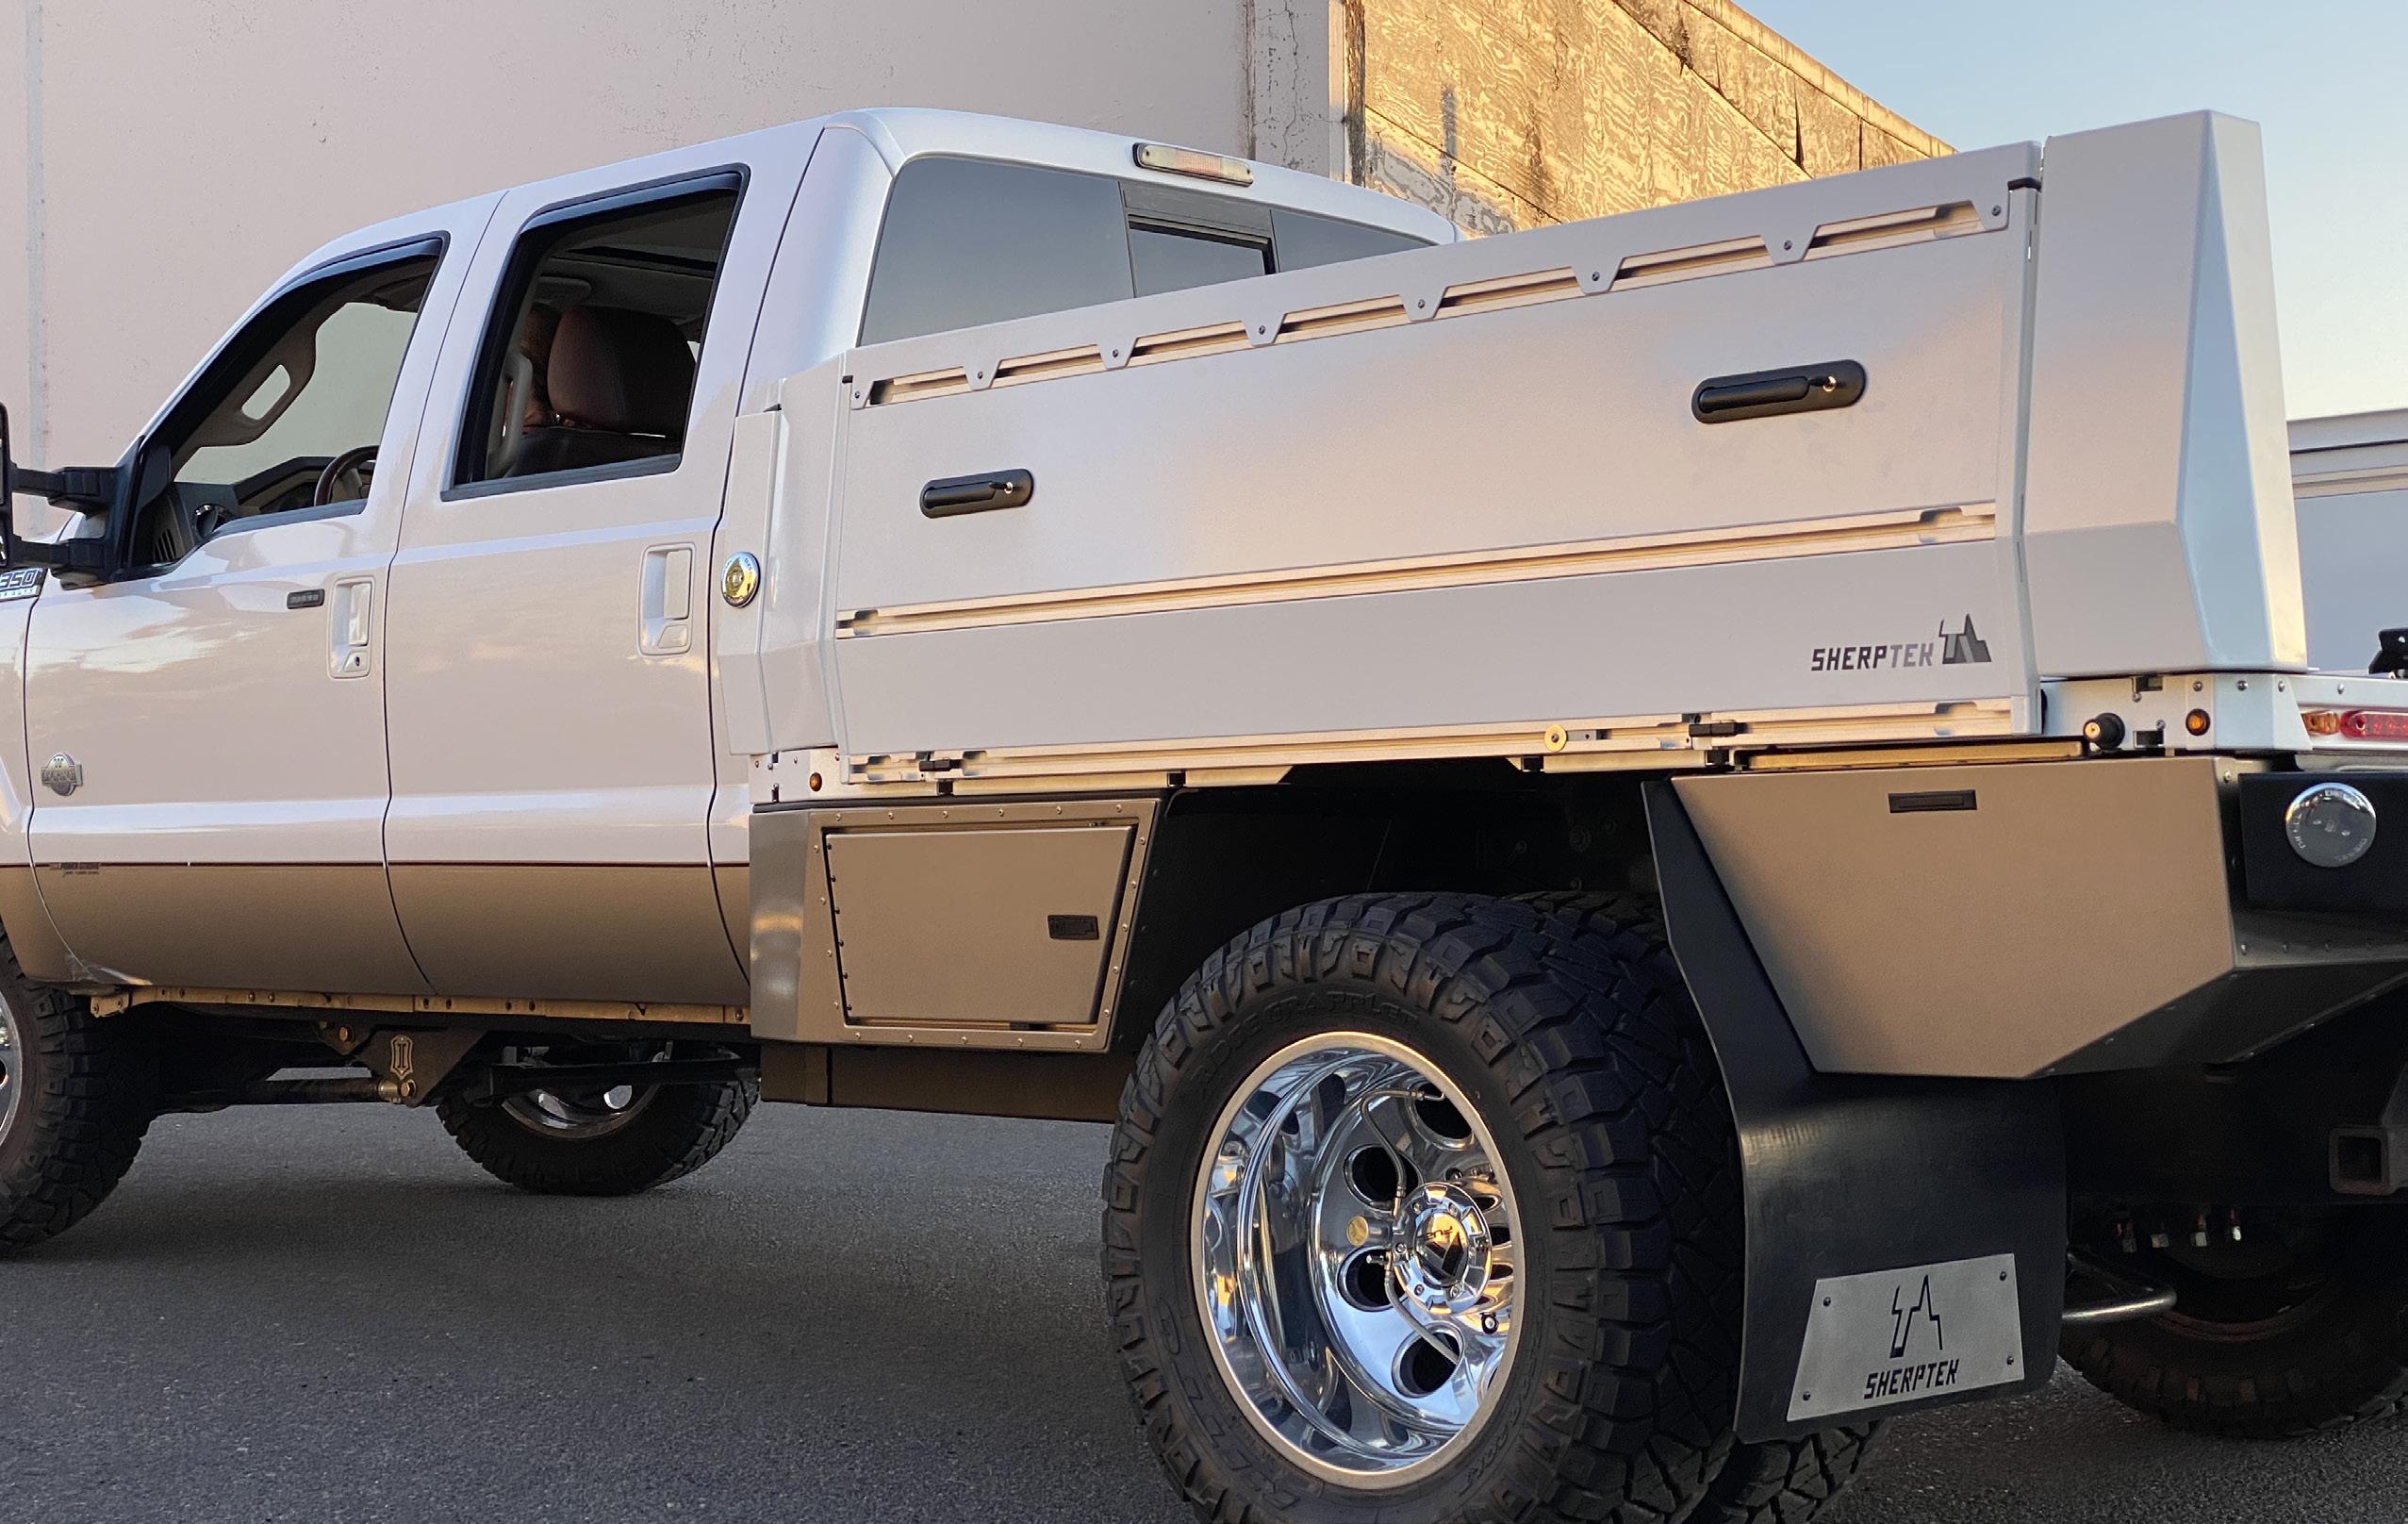
- Ryan Goodwin, Founder & Lead Designer Engineer, SherpTek
Case Study: SherpTek

SherpTek was among the first tenants to take occupancy in the redeveloped Woodgrain mill site, re-branded the “Prineville Campus,” where they design and manufacture modular truck bed systems and accessories to improve the functionality and adaptability of pickup trucks for day-to-day use and outdoor adventures.
SherpTek is an innovator in the automotive/outdoor industry. Their Founder and Lead Design Engineer, Ryan Goodwin, uses composite aerospace materials and construction methods to create a lightweight, yet super durable, precision-engineered product. SherpTek was one of Prineville’s first companies to pitch at EDCO’s Central Oregon PubTalk, an event that showcases local entrpreneurs. The company has been and continues to be supported by EDCO as well as many local and State partners in areas such as business financing, incentive utilization, internship coordination, staffing, network connections, scalability, and pitch coaching. Despite having just moved their start-up to Prineville earlier this year, SherpTek has ingrained itself into the entrepreneurial fabric of the region. They are already expanding their manufacturing facilities, hiring additional employees and training local high school students on their specialized processes.
* EDIT TITLE
START
Page 8 - Economic Development for Central Oregon
A driving force for our economic performance is a collaborative and inclusive entrepreneurial community. This is supported via the number of new business registrations, which has outpaced far larger cities. In 2022, AdvisorSmith ranked Bend fifth for Top Midsize Cities where Americans Start the Most Businesses at 3.79 businesses started per 1,000 residents.
The region is large enough to provide resources and access to capital that help new entrepreneurs get started, while still being small enough that those resources are interconnected to support businesses as they grow. Unique to Central Oregon, given its size, are the numerous community resources and assets that are available. Assets managed by EDCO include monthly Central Oregon PubTalks, the Stable of Experts mentorship program and the largest Angel Conference in the PNW, the Bend Venture Conference.
BEST SMALL CITIES FOR STARTING A BUSINESS
Source: WalletHub, April 2022.
Both Redmond and Bend made WalletHub’s Top 30 list for best cities to start a business at #16 and #17 respectively, based on an index of criteria that included business environment, access to resources and business costs. They were the only two Oregon cities to make it in the top 350 of 1,334 small cities ranked in the index.
ENTREPRENEURIAL SUPPORT St. George, UT Bend, OR 359 1 2 3 16 17 4 1 8 5 3 54 Area
Access to Resources Rank National Rank Business Environment Rank Washington, UT 3 Bozeman, MT 18
OR 127
Redmond,
edcoinfo.com - Page 9
GROW
“Our flagship manufacturing facility is located in Bend, nestled at the base of the Cascade Mountain Range, which also inspired the brand name. The views and outdoor amenities are unmatched, but the entrepreneurial and community support we have received from day one has been the driving factor in bringing our homegrown business sustainable success in Oregon and beyond. Our employees, customers and partners are what make Bend home and inspire continued growth.”
- Affton Coffelt, Founder and CEO, Broken Top Brands
Case Study: Broken Top Brands
Broken Top Brands creates handmade, sustainable, eco-conscious candles and body products that have been featured in National media outlets such as BuzzFeed, Oprah Daily and HuffPost. Started in 2015 out of Founder Affton Coffelt’s kitchen in Bend as Broken Top Candle Co., the company has now blossomed to 19 employees and recently moved into an 18,000 SF manufacturing facility.


Broken Top Brands is currently selling an array of all natural, biodegadble and paraben-free lifestyle products in the USA, as well as Canada and parts of Europe. The brand’s market is primarily wholesale with an organically growing e-commerce presence. Customers can find their products in over 2,800 retail locations nationally and internationally, with Whole Foods being their largest account.
Broken Top Brands was attracted to starting a business in Central Oregon for its quality of life and supportive community. Due to it’s unique company culture and location, the business has had success retaining employees which has enabled its continued expansion. Although supply chain timelines and transportation costs have been challenges through the pandemic, Broken Top Brands has sustained steady growth and continues to partner with EDCO, 1% for the Planet, One Tree Planted, Opportunity Knocks, Bend Chamber, and Business Oregon to serve their loyal customer base.
We partner with local traded-sector companies to help them grow and expand, offering them the very same incentives and assistance as relocation projects.
Page 10 - Economic Development for Central Oregon
#5 FOR 5-YEAR JOB GROWTH IN THE U.S.
- MILKEN INSTITUTE, 2022
Private sector employment grew by 47% in Central Oregon over the last 10 years, which is significantly faster than the statewide growth of around 20%. Employment in the private sector is projected to grow by 12% across the region between 2019 and 2029.

Workforce Development
Improving the Readiness and Employability of Central Oregon’s Future Workforce
Now in its fourth year, Youth CareerConnect (YCC) continues to connect employers and students with real work experience throughout Central Oregon. By supporting internships and experiential learning opportunities in the community, YCC has made it simpler for schools and employers to connect while fostering a work-ready labor force for years to come.
YCC Internship Coordinators host office hours at schools across the region to help students with professional goal setting, resume writing, interview skills, and internship placement for high school, college and alternative education students. Since its inception in 2017, YCC has built a rolodex of over 360 business partners and placed more than 493 students in meaningful internships. Personalization for both the business and the student is at the core of what YCC does, and why it continues to thrive. To get involved with Youth CareerConnect, visit: youthcareerconnect.org

WORKFORCE
- Damon Runberg, Oregon Employment Department
Source: State of Oregon Employment Department, 2021 Oregon 14.3% U.S. MANUFACTURING EMPLOYMENT GROWTH (2010-2021) 7.1% Deschutes County 60.6% Redmond 75.3% edcoinfo.com - Page 11
DESCHUTES COUNTY #1 COUNTY RECEIVING THE MOST INCOMING INVESTMENT IN OREGON
-SMARTASSET, 2022
“Central Oregon enjoys a truly collaborative environment. Everyone is not only supportive of each other, but excited to see one another grow. We share the same trails, rivers and slopes and ultimately share a similar vision to help the region succeed.”
The combination of a collaborative culture, a supportive attitude among government and economic development partners, plus a location that attracts talent and investment all help Central Oregon compete nationally.
 - Scott Allan , Former CEO and GM, Hydro Flask
Rank County New Building Permits (per 1,000 homes) Business Growth Federal Funding (per capita) GDP Growth (millions) Incoming Investment Index 1 3 5 2 4 6 Deschutes 26.4 Marion 13.8 Washington 13.4 Crook 21.8 Linn 15.8 Jefferson 9.8 Oregon Totals 7.8 11.3% $211 6.8% $920 4.1% $340 7.8% $225 4.8% $103 8.9% $192 3.4% $265 $317 56.94 $354 43.91 $660 42.09 $23 49.48 $111 42.77 $17 41.99 $1,480 Source: SmartAsset, 2022 INCOMING INVESTMENT BY COUNTY IN OREGON DELIVERING WHAT IS EXPECTED Page 12 - Economic Development for Central Oregon
TRANSPORTATION
Redmond Municipal Airport (RDM; www.flyrdm.com ) provides commercial air service with an average of 27 daily outbound flights to Burbank, Denver, Los Angeles, Palm Springs, Phoenix, Salt Lake City, San Diego, San Francisco, and Seattle via five carriers (Alaska, American, Avelo, Delta, and United).
Average Commute Times
SanFranciscoLosAngeles
The Central Oregon average commute time is 24 minutes each way, saving the average worker nearly one work week per year !
Source: Census.gov 2021
Travel Time & Distance by Car
RAIL FREIGHT

Burlington Northern-Santa Fe (BNSF), Union Pacific (UPRR) and the City of Prineville Railway (COPR) provide direct connections for shipping to any market in the United States, Canada and Mexico.
Travel Time By Air

U.S. Highways 97 and 20 are two of the State’s major trucking routes, with access to major metro areas with connections to Interstate 5 (N-S) and Interstate 84 (E-W).

PHOENIX, AZ
2 hour, 30 minutes
PALM SPRINGS, CA
Coming November 2022
SAN DIEGO, CA
2 hours, 40 minutes
30 min 33.3 min 31.9 min 27.7 min 26.2 min 16.6 min 25.7 min
20 min 10 min 0 min
OR 164 miles
hours, 13 minutes
WA 269 miles 4 hours, 44 minutes
LAKE CITY, UT 1 hour, 30 minutes
WA 329 miles 5 hours, 46 minutes BURBANK, CA 1 hour, 30 minutes
CO
hours, 24 minutes
ANGELES, CA 820 miles 12 hours, 38 minutes BEND, OR REDMOND,
RDM
OR 173 miles 3 hours, 15 minutes
WA
hour, 10 minutes
316 miles 5 hours, 12 minutes
FRANCISCO, CA 1 hour, 10 minutes
FRANCISCO,
491 miles
hours,
PORTLAND,
3
OLYMPIA,
SALT
SEATTLE,
DENVER,
2
LOS
OR
MEDFORD,
SEATTLE,
1
BOISE, ID
SAN
LOS ANGELES, CA 2 hours SAN
CA
7
55 minutes
Seattle Portland Denver Bend
AIR
edcoinfo.com - Page 13
UTILITIES

Most of our region has been newly built in the past two decades, making Central Oregon’s telecommunications infrastructure one of the Northwest’s most technologically advanced. Businesses and telecommuters benefit from reliable fast data speeds and upload times.
EDUCATION
Central Oregon is well-recognized for its high level of education, with some of the best K-12 public schools in the nation. In 2021, the Bend-La Pine school district’s average SAT scores surpassed the national average by over 180 points. Additionally, our higher education opportunities abound. From Oregon State University-Cascades’ ongoing expansion, to Central Oregon Community College’s four campuses in the region, there are opportunities for all to obtain a quality education.
HEALTHCARE
St. Charles Health System is the largest healthcare provider in the region, and is also the largest employer with over 4,500 employees across the tri-county area. The hospital received HealthGrade’s 2021 Pulmonary Care Excellence Award™ and offers a network of more than 100 clinics and specialty practices throughout the community.

& INFRASTRUCTURE
SERVICES
Page 14 - Economic Development for Central Oregon
TOP EMPLOYERS

According to the Oregon Employment Department, 76% of Oregon establishments have between one and nine covered payroll employees and the average private establishment employs around 11 people.
Still, a number of large employers operate successfully here, tapping into Central Oregon’s ever-expanding workforce, the overall low cost of doing business and business-friendly local governments. This year, the top 50 private companies collectively employ nearly 21,000 Central Oregonians, or roughly 21.9% of the region’s current total employment.
2021 Central
Private by Employment Trade, Transportation, & Utilities Education & Health Services Leisure & Hospitality Professional & Business Services Mining, Logging & Construction Manufacturing Financial Activities Other Services Information 7% 4% 2%
Oregon Industry Composition
- Oregon Employment Department , 2011-2021
CENTRAL OREGON RANKED #1 IN THE STATE FOR JOB GROWTH AT 29.7%
1 9 17 5 13 21 7 15 23 31 27 35 T-24 T-33 T-29 37 42 45 T-46 2022 1 7 T-13 5 12 T-23 8 15 T-23 36 T-17 T-38 28 T-38 T-31 37 NL 47 46 2021 4,509 605 336 894 375 249 640 350 238 206 225 199 235 200 220 176 159 153 150 2022 St. Charles Health System regional 2022 Central Oregon Largest 50 Private Employers Employees Rank McDonald’s regional PacificSource Mt. Bachelor Black Butte Ranch Opportunity Foundation Fred Meyer regional Meta - Facebook Data Center NeighborImpact regional Endura Products Eagle Crest - Aimbridge Hospitality Keith Manufacturing Co. 10 Barrel Brewing Co. Touchmark at Mt. Bachelor Village Tetherow First Interstate Bank regional Hayden Homes Rebound Physical Therapy regional Dutchie 4,626 682 365 860 375 259 669 350 259 200 300 195 230 195 220 198 122 149 150 2021 2 10 18 6 14 22 8 16 T-24 32 28 36 T-39 41 44 T-46 50 26 T-33 T-29 38 T-39 43 T-46 49 2 10 20 6 T-13 19 9 T-23 22 21 35 48 NL 42 41 T-43 T-50 29 40 33 45 30 T-31 T-17 T-43 1,030 440 296 714 365 245 628 340 235 204 221 190 165 164 154 150 142 226 200 220 171 165 157 150 149 Bright Wood Corporation regional Lonza, formerly Bend Research High Lakes Health Care regional Safeway regional ibex Consumer Cellular Summit Medical Group regional BASX Pronghorn Resort Bi-Mart regional Epic Air Indian Head Gaming Albertsons regional Nosler J Bar J Youth Services Deschutes Brewery Laird Superfood NL = Not Listed | T = Tied PCC Schlosser Sunriver Brewing Company The Center (Ortho/Neuro Care) Western Heavy Haul & SMAF G5 Riverhouse on the Deschutes BendBroadband/TDS Telecom Ray’s Food Place regional 1,093 438 279 751 365 294 607 259 270 272 210 145 201 173 174 162 132 224 190 216 155 221 220 300 162 3 11 19 3 16 26 1,000 415 280 Sunriver Resort Rosendin Electric Inc. Brasada Ranch 1,000 317 250 4 12 20 4 11 27 916 391 267 Les Schwab regional Mosaic Medical regional Medline ReNewal 890 378 246 21% 19% 16% 13% 10% 9% Source: State of Oregon Employment Department, 2021 edcoinfo.com - Page 15
FOUNDATIONS OF CENTRAL OREGON’S ECONOMY
ADVANCED MANUFACTURING AVIATION & AEROSPACE


• More than 100 businesses in advanced manufacturing make their own products here in Central Oregon, as well as provide a critical role in the supply chain for other OEM in aviation/aerospace, brewing & distilling, specialty food processing, and automotive.
• Additive and subtractive machining of metals and plastics, advanced welding and metal fabrication, specialty metals casting, production printing and publishing, as well as specialized machinery and equipment continue to advance locally.

• The largest employers in this industry group include Precision Cast Parts (PCC) Schlosser, Keith Manufacturing and BasX Solutions.


• The production of light aircraft in Central Oregon spans back more than 30 years and over that time, 25 aircraft have moved through the process of conceptual design to flight.
• Composite (carbon fiber) fabrication and innovation aircraft are the region’s specialty offering a cluster of world-class talent and capabilities here.
• Some of the most successful flight training programs in the country are located in the region with both fixed-wing and helicopter flight schools that serve the global industry, including Leading Edge, Hillsboro Aero Academy and Central Oregon Community College.

Page 16 - Economic Development for Central Oregon
BIOSCIENCE
• Producing everything from titanium implants to cutting edge drug research, our bioscience industry has been experiencing year-over-year double digit employment growth for nearly a decade.

• Quietly, Central Oregon’s bioscience industry has proven capable of attracting world class scientific and technical talent that has made companies here competitive on a global scale.

• Swiss-based pharmaceutical research and manufacturer Lonza is the largest bioscience company in the region, and among the largest in Oregon, with two campuses and additional operations scattered across the region.


BREWING & DISTILLING


• Central Oregon is home to breweries both large and small, with Deschutes Brewery’s production placing it in the top 10 largest craft breweries in the U.S.

• For Oregon, which has 312 craft breweries, nearly one-third of the largest 30 brewers by volume, are located in Central Oregon – testimony to the quality of product produced here.


• The region is also home to a dozen craft cideries and distilleries, two of which, Bendistillery and AVID Cider, are the second largest in the state in their respective sectors.
#3 LEADING HOP PRODUCTION STATE
#2 BEST CITIES FOR BEER DRINKERS
-STATISTA, 2020
-SMARTASSET, 2022 FOUNDATIONS OF CENTRAL OREGON’S ECONOMY edcoinfo.com - Page 17
FOUNDATIONS OF CENTRAL OREGON’S ECONOMY
BUILDING PRODUCTS

• After 100+ years and considerable systemic change across the industry, the building products sector is still Central Oregon’s largest traded-sector employer.
• Businesses in this sector compete and win on a global scale, innovating and automating as global leaders in their respective sub-industries, including wood doors and windows, mouldings, cabinetry, furniture, and musical instruments.

• The region’s largest manufacturer and second largest private employer, Brightwood Corporation, is based in Madras, with operations in Redmond, Culver and Prineville. The company has been growing in Central Oregon for over a half century.


OUTDOOR GEAR & APPAREL


• Central Oregon is home to a diverse group of businesses in a variety of subsectors, including rock climbing, water sports, hydration, hiking, backpacking, recreational vehicles, road and mountain biking, outerwear, and software.
• The region is home to the Oregon Outdoor Alliance (OOA) and Oregon’s Office of Outdoor Recreation, both of which are dedicated to connecting and cultivating the industry.
• Bend Outdoor Worx is the country’s first dedicated startup accelerator for the industry and offers investment, exposure and access to vetted resources for outdoor innovators.
#5 GREAT CITIES IN THE U.S. FOR OUTDOOR ADVENTURES

Page 18 - Economic Development for Central Oregon
- WASHINGTON POST, 2022
FOUNDATIONS OF CENTRAL OREGON’S ECONOMY
PROFESSIONAL SERVICES


• Professional services are incrasingly being exported out of the tri-county region including engineering, architecture, accounting, HR, recruitment, creative services, advertising, and publishing to name a few


• The creative, marketing and advertising sub-sectors of this industry are particularly strong in Central Oregon with firms being attracted to the region from as far away as Barcelona, Spain.


TECHNOLOGY
• Including software companies, electronics manufacturers, alternative energy and data centers, the region has over 130 tech companies employing nearly 3,000 people.


• Five dozen software companies call the region home, more often than not locating their headquarter operations here.
• Prineville is a growing data center hub and is home to Meta’s first and largest data center campus, a 4.5 million square foot complex. Central Oregon offers a unique advantage for data centers due to its available infrastructure, affordable industrial land, multiple telecom carriers, desert climate, and globally competitive tax incentives.

#3
FOR 5-YEAR HIGH TECH GDP GROWTH -MILKEN INSTITUTE, 2022
edcoinfo.com - Page 19
Located on the eastern slopes of the Cascade Range, where vast forests give way to the arid high desert, Central Oregon boasts year-round adventure and a rare mix of city amenities and world-famous outdoor recreation. The region offers the slower speed of a small town with access to toprated healthcare and infrastructure to support continued economic growth.
#10

#10 BEST PERFORMING SMALL CITIES & #1 FOUR YEARS IN A ROW
#2 MOST FITNESS FRIENDLY PLACE IN THE U.S.

30+ Golf Courses
Miles and Miles of Trails
Flourishing Arts & Culture Scene

#4 BEST MOUNTAIN TOWNS IN AMERICA

31 Breweries & Counting

300 Days of Sunshine

LIFESTYLE
-MILKEN INSTITUTE, 2022
BEST
BUSINESS -U.S. CHAMBER OF COMMERCE, 2022
LIVE IN
-MONEY, 2019 & LIVABILITY, 2020
SMALL CITIES FOR
TOP 100 BEST PLACES TO
AMERICA
-THRILLIST,
M T. BACHELOR
-AFAR, 2020
2021
AMONG BEST SKI AREAS IN THE U.S.
-SMARTASSET, 2022
Page 20 - Economic Development for Central Oregon
ABOUT EDCO
Founded in 1981, EDCO is a non-profit corporation supported by private and public members and stakeholders. Our mission is to create a balanced and diversified economy with a strong base of middle-class jobs in Central Oregon.
To do this, we focus on helping companies do the following:
MOVE. We guide employers outside the region through the relocation process as a resource for regional data, incentives, talent, site selection, and more.
START. We mentor and advise scalable young companies from concept to exit on issues such as access to capital, critical expertise and business strategy.
GROW. We partner with local traded-sector companies to help them grow and expand.
Central
Central
City
City
City of Prineville
City of Redmond
City of Sisters
Crook County
Deschutes County
First Interstate Bank
Jefferson County
Mid Oregon Credit Union
OSU-Cascades
Pacific Power
PacificSource Health Plans
Schwabe, Williamson & Wyatt
Sensiba San Filippo
U.S. Bank
Additional information available at EDCOINFO.COM
• Upcoming networking events, luncheons, conferences, and more
• EDCO Info Hub: current comprehensive data for Central Oregon
• Stable of Experts: a network of seasoned professionals with a passion for start-ups and small businesses
• Success stories from regional businesses
• Business news on EDCO’s blog
Fiscal Year Companies Jobs (New & Retained) New Capital Investment 2020 - 2021 2018 - 2019 2016 - 2017 2019 - 2020 2017 - 2018 2021 - 2022 Totals 34 40 48 36 31 13 202 451 587 735 774 288 483 3,318 $208.7 million $70.5 million $2.1 billion $67.1 million $199.7 million $1.98 billion $4.63 billion
BendTel
Natural Gas
AmeriTitle
Cascade
Electric Cooperative
Community
Oregon
College
of Bend
of La Pine
City of Madras
Combined Communications
St. Charles Health System
Members EDCO Contact Information Regional Office (Bend) CEO: Jon Stark Director: Don Myll 705 SW Bonnett Way Ste. #1000 Bend, OR 97702 541.388.3236 Redmond Director: Steve Curley 411 SW 9th Street Ste. #203 Redmond, OR 97756 541.923.5223 Prineville/Crook County Director: Kelsey Lucas PO Box 153 Prineville, OR 97754 541.213.3169 Sisters Director: Eric Strobel 520 E Cascade Street Sisters, OR 97759 541.410.8630 Sunriver/La Pine Director: Patricia Lucas 16345 Sixth Street La Pine, OR 97739 248.693.3049 Public Contracts EDCO’S Funding Sources Private Members Earned Revenue Other 36% 30% 21% 16% EDCO’S RESULTS edcoinfo.com - Page 21
Velox Systems EDCO Platinum


EDCOINFO.COM #EDCOINFO @EDCOINFO 705 SW BONNETT WAY SUITE 1000 BEND, OR 97702 541.388.3236