


Subject Property: 4807 SW Xero Ave.|Redmond, Oregon | 97756 Tax Lot # 1513300000905 Prepared By: Danetta Rider 845 SW Veterans Way Redmond, OR 97760 Office: 541-527-1274 Email: danettar@deschutestitle.com “Service is the Difference” Property Development Packet DISCLAIMER: Deschutes County Title has provided this information as a courtesy and assumes no liability for errors, omissions, or the accuracy of the data and does not warranty the fitness of this product for any particular purpose. Bend 397 SW Upper Terrace Dr Bend, Oregon 97702 Office: 541.389.2120 Fax: 541.389.2180 Redmond 845 SW Veterans Way Redmond, Oregon 97756 Office: 541.527.1274 Fax: 541.527.1281 La Pine 51515 Huntington Rd La Pine, Oregon 97739 Office: 541.876.6990 Fax: 541.876.2740 St Helens 240 South First Street St. Helens, Oregon 97051 Office: 503.397.2587 Fax: 503.366.1708 Prepared for Audrey Cook & Kariann Box audreycook1976@gmail.com (541) 480-9883 kariannbox@gmail.com (541) 420-4978
DESCHUTESCOUNTYPROPERTYPROFILEINFORMATION

Parcel#:130245
TaxLot:1513300000905
Owner:JohnnieMurrayFamilyTrust
CoOwner:
Site:4807SWXeroAve
RedmondOR97756
Mail:3632SWZenithPl
RedmondOR97756
LandUse:191-Residential-Potentialdevelopment-Improved(typicalofclass)
StdLandUse:RSFR-SingleFamilyResidence
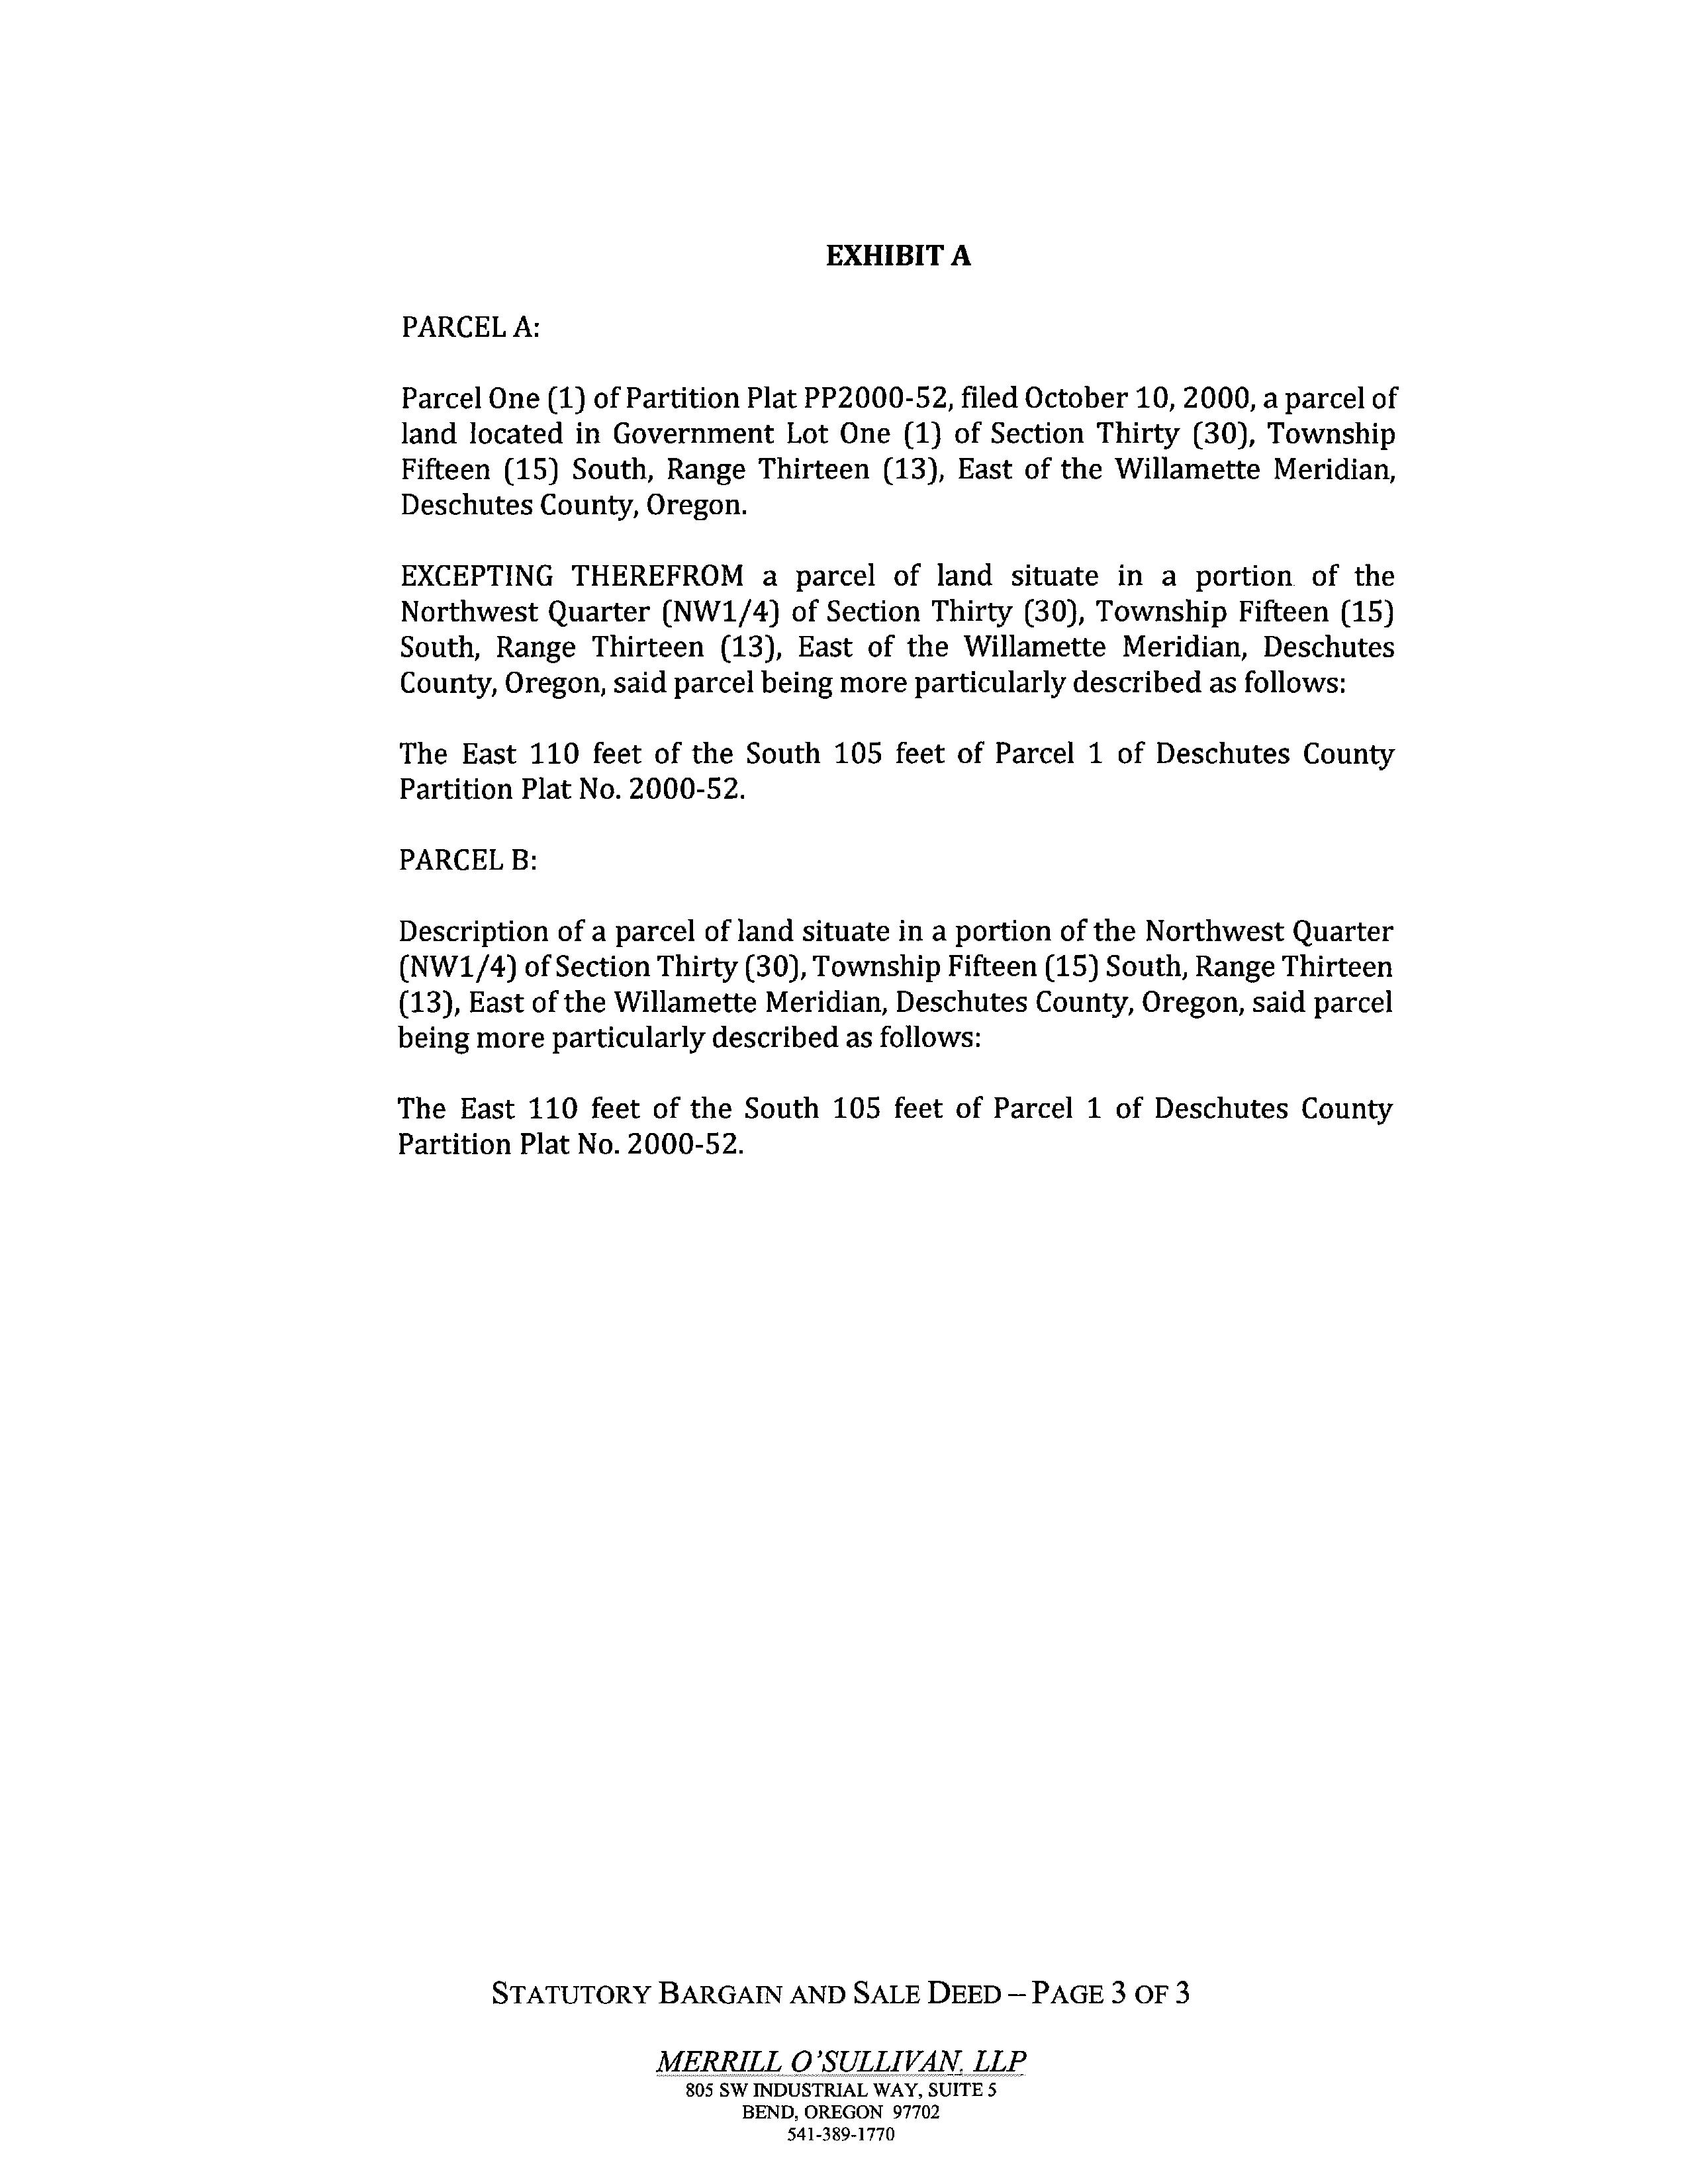
Legal:Lot:PARCEL1Block:52
Twn/Rng/Sec:T:15SR:13ES:30Q:QQ:
ASSESSMENT&TAXINFORMATION
MarketTotal:$935,390.00
MarketLand:$766,000.00
MarketImpr:$169,390.00
AssessmentYear:2022
AssessedTotal:$316,790.00
Exemption:
Taxes:$6,069.09
LevyCode:2-001
LevyRate:191581
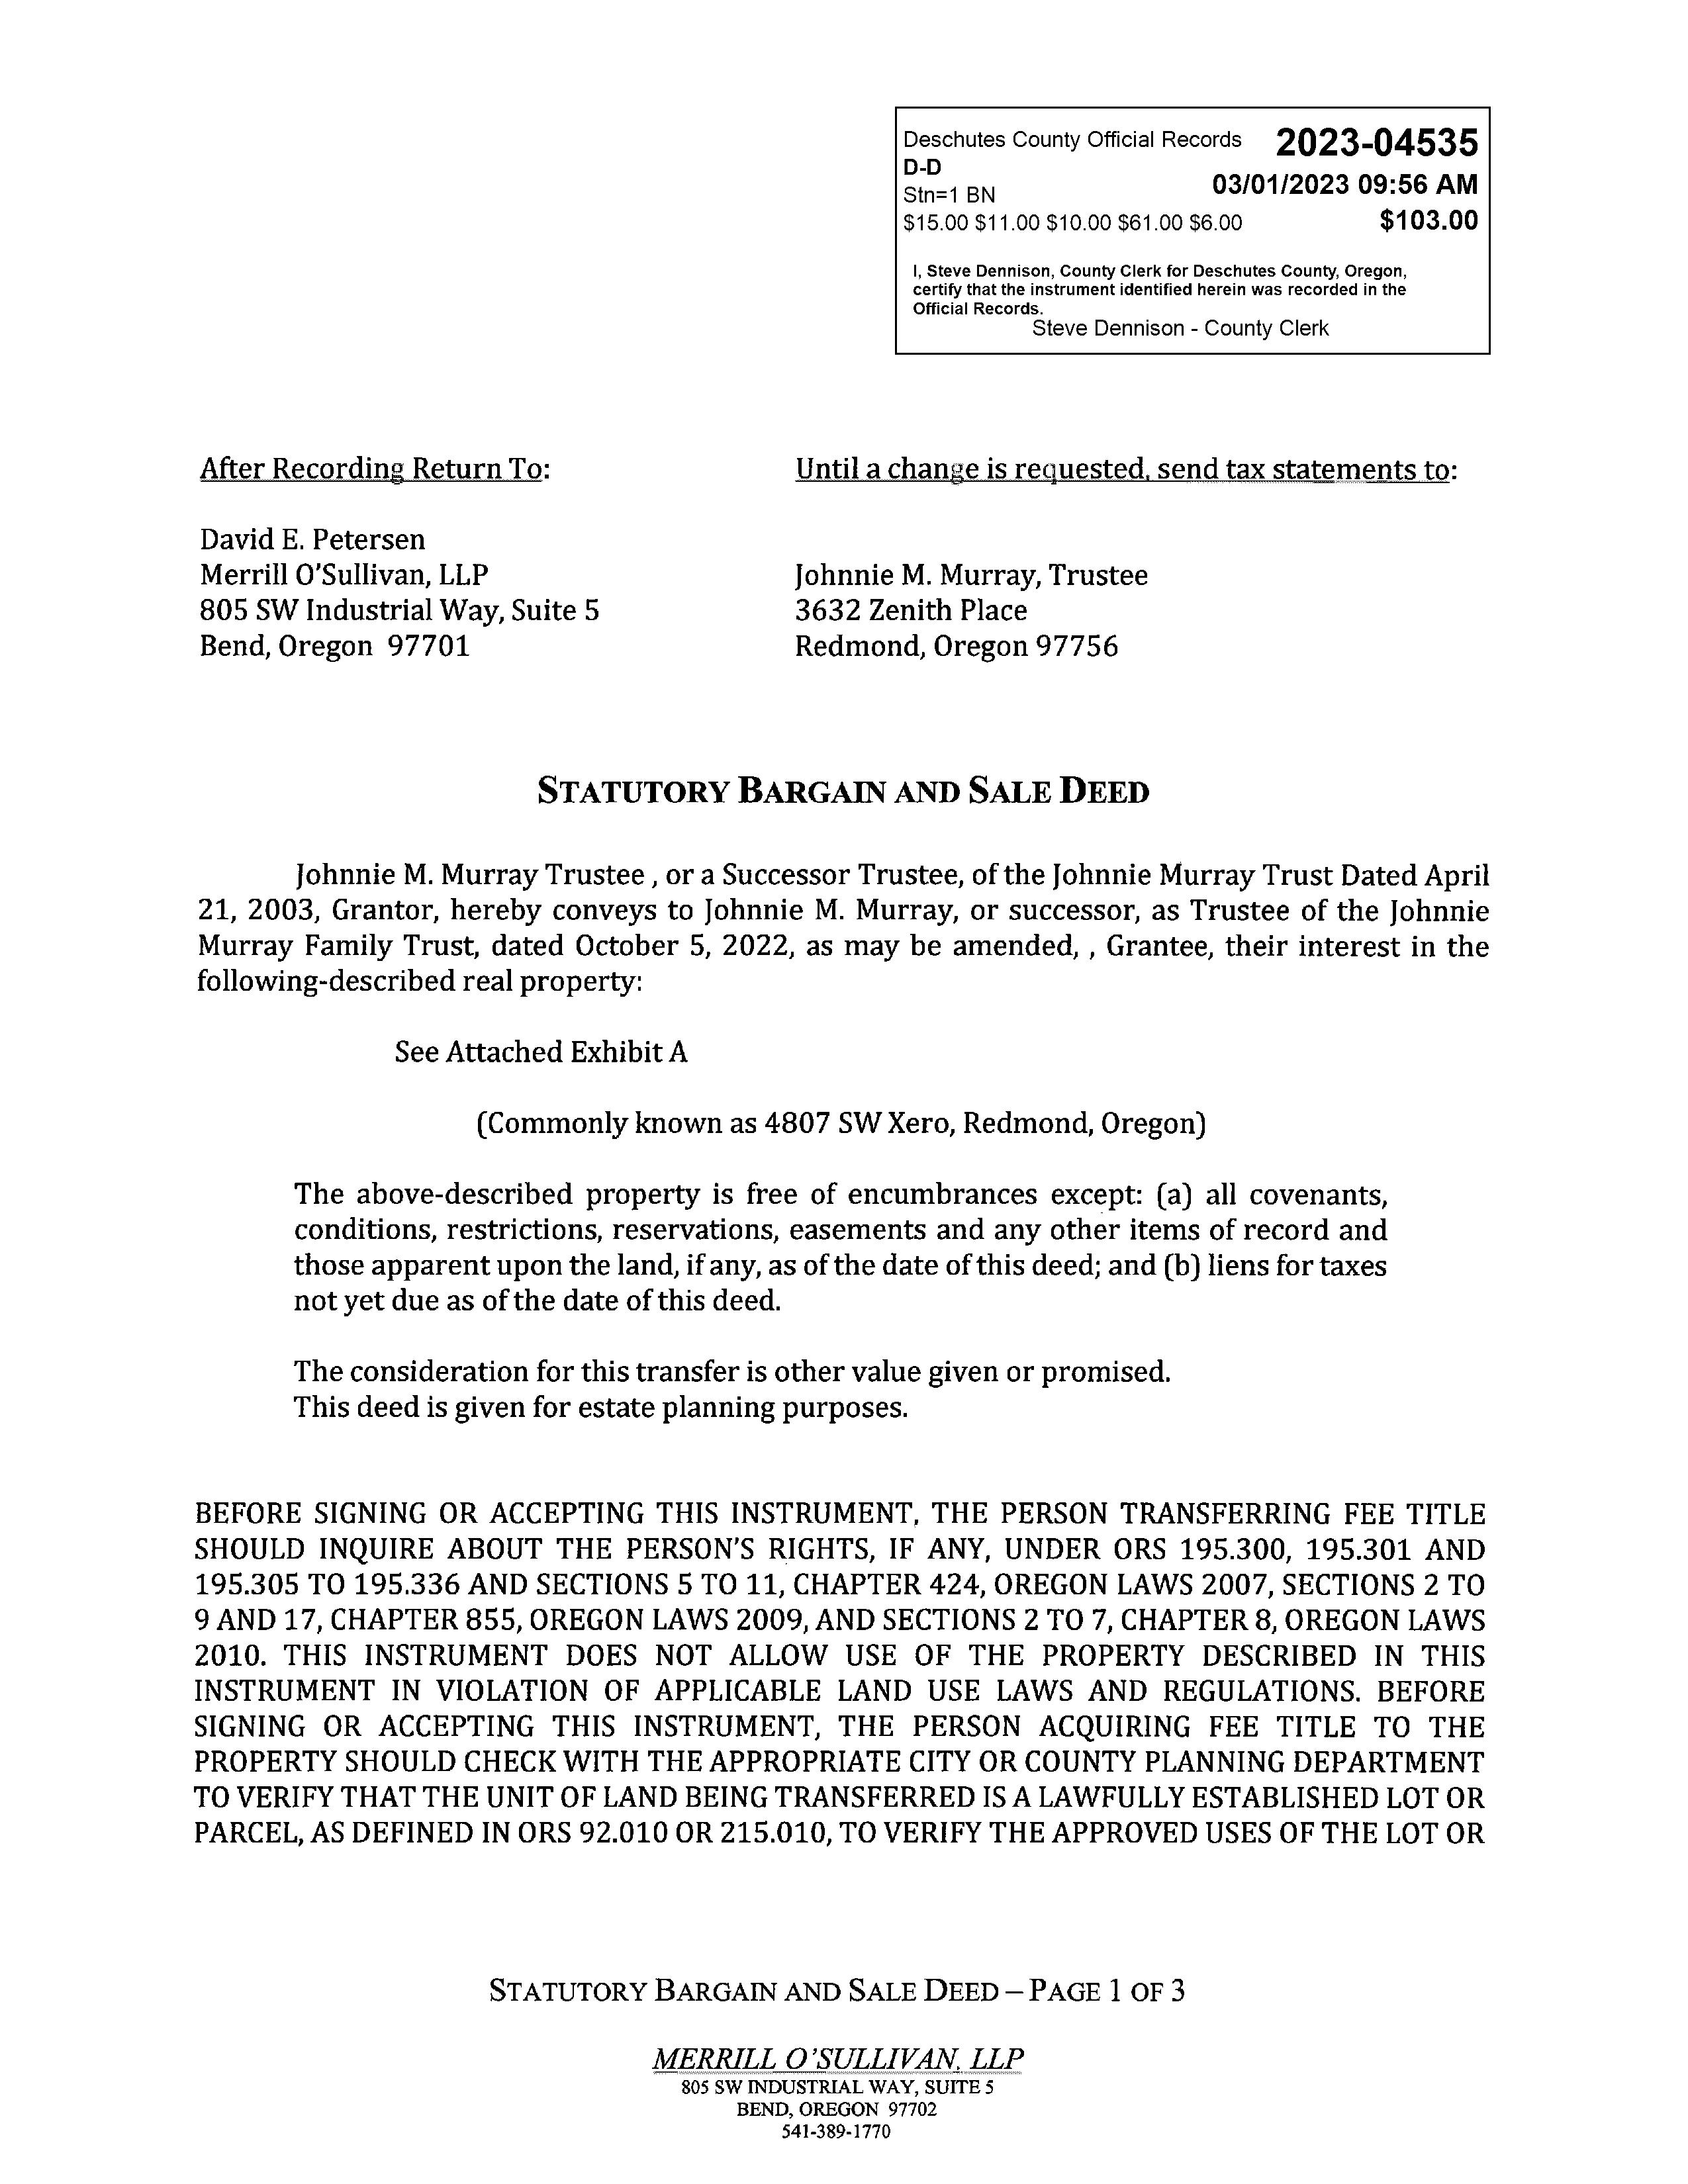
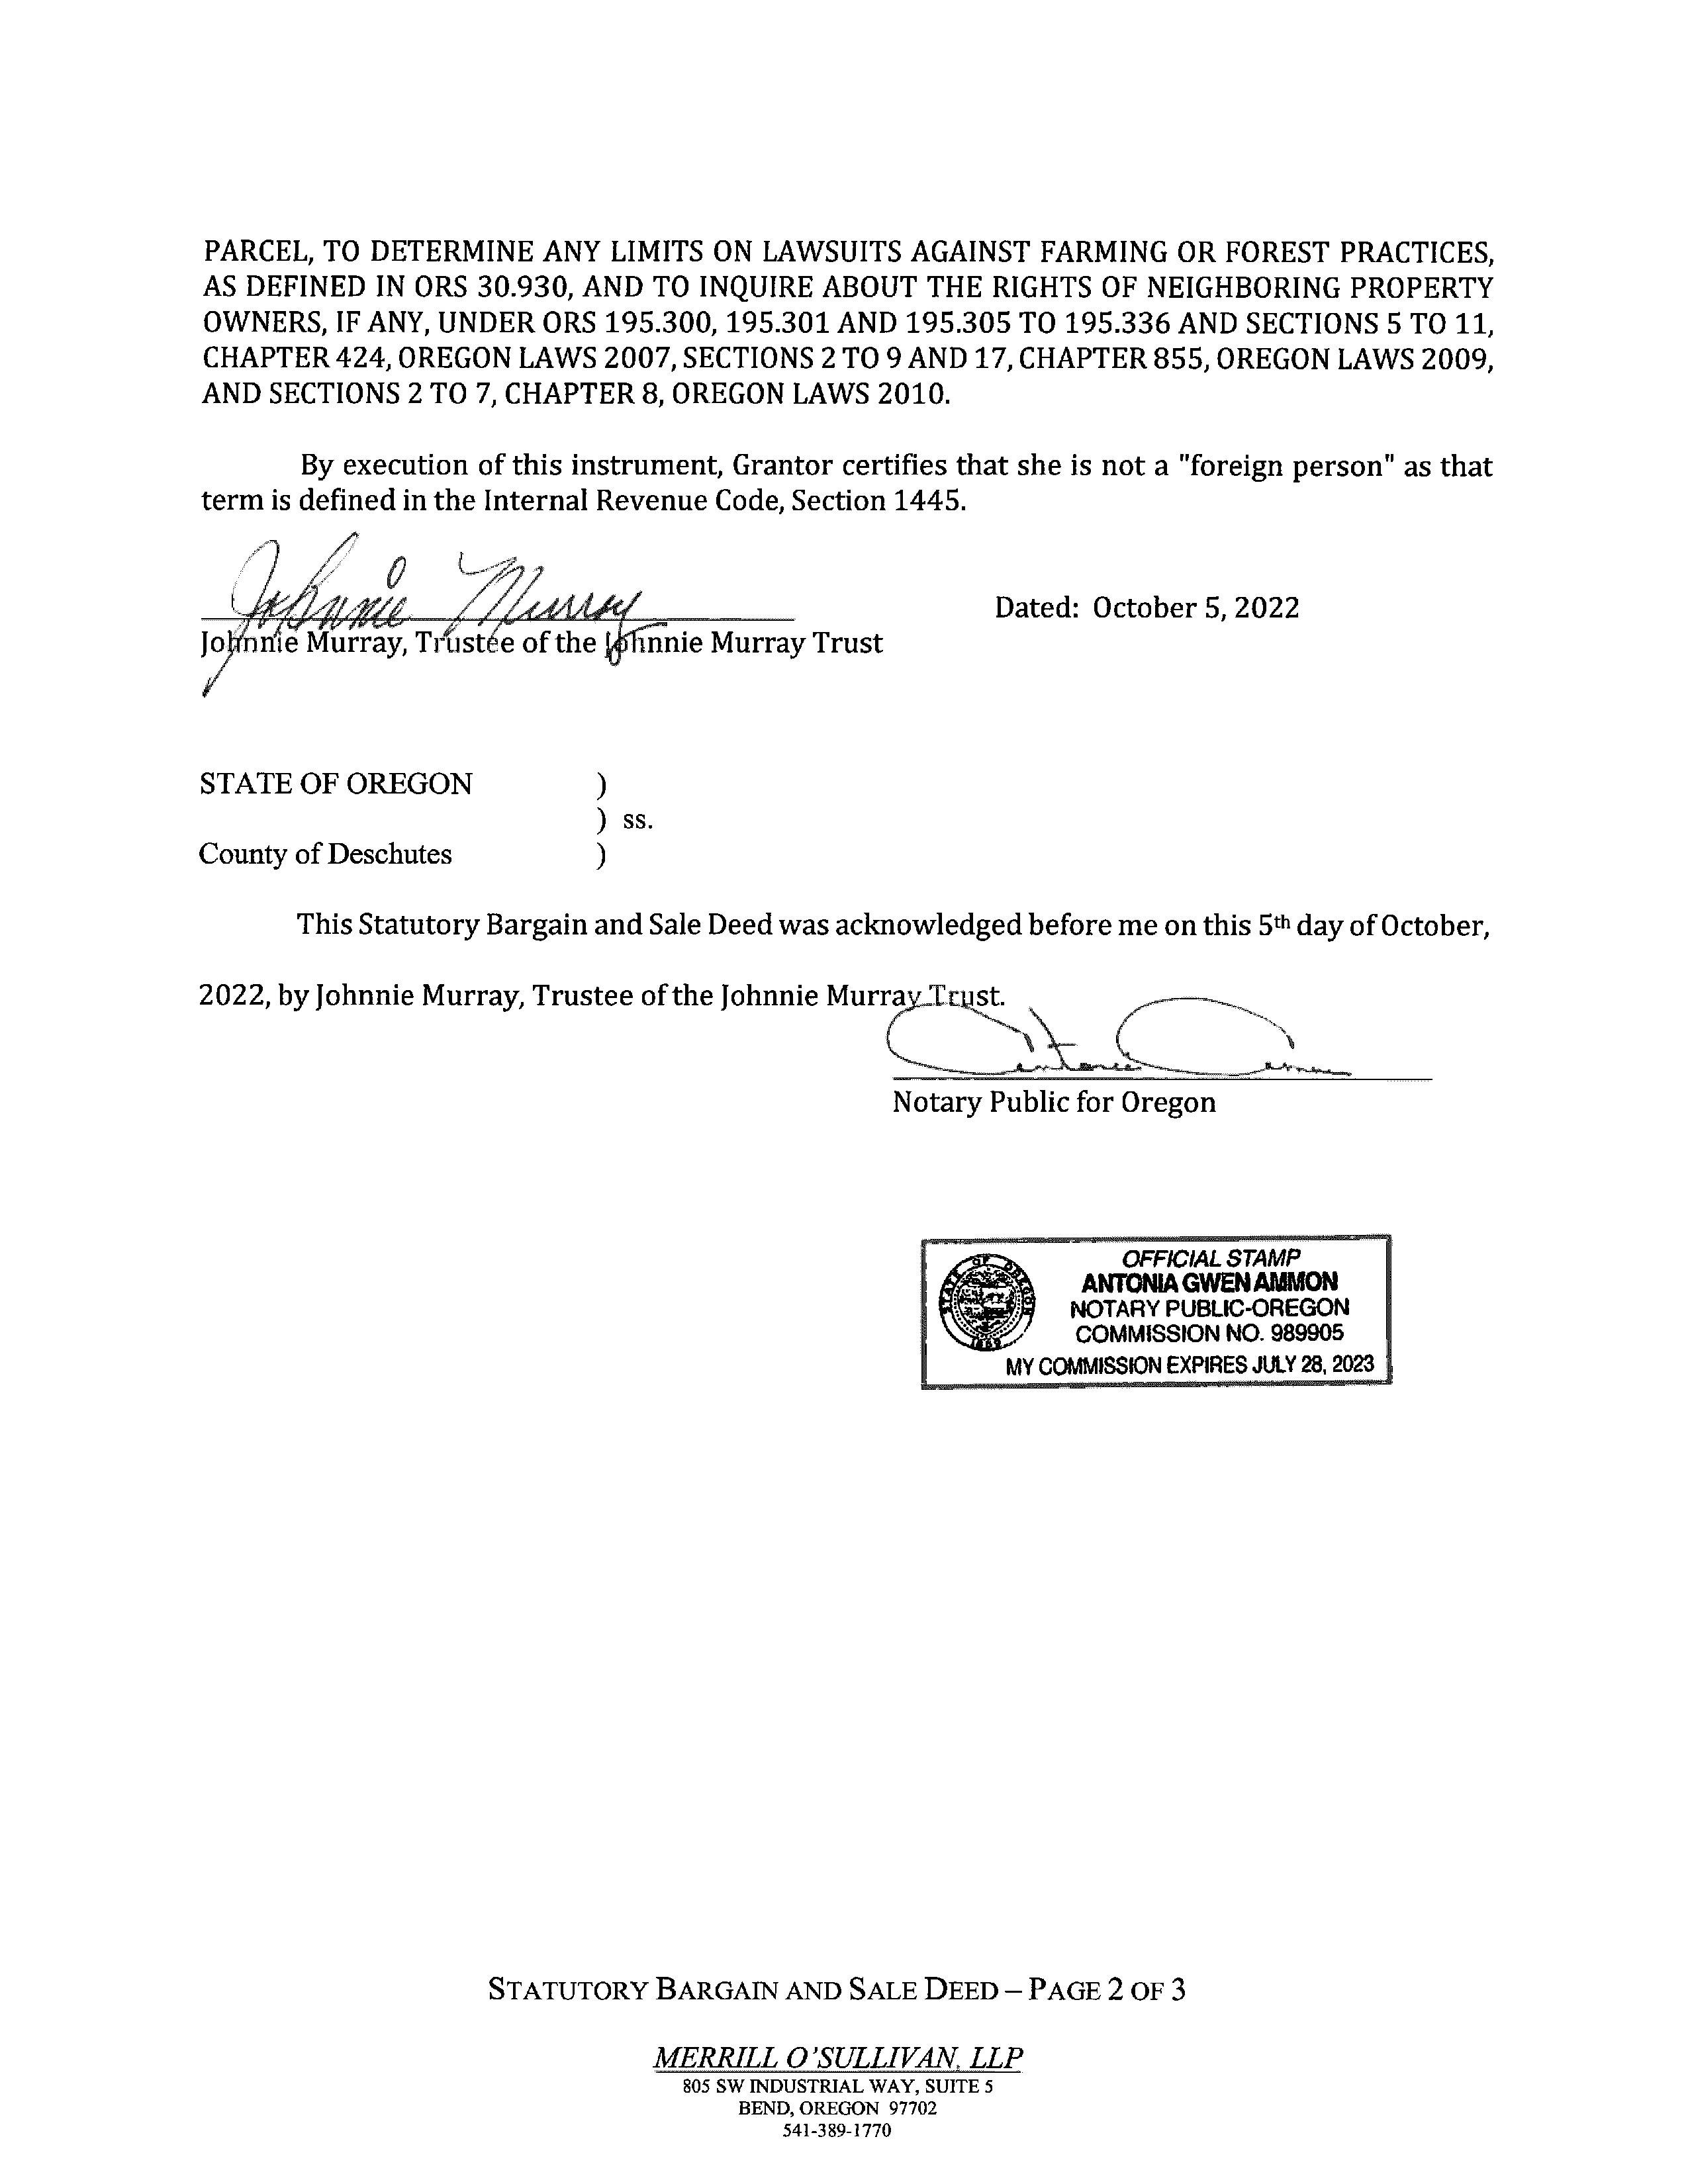
SALE&LOANINFORMATION
SaleDate:03/01/2023
SaleAmount:
Document#:4535
DeedType:Deed
LoanAmount:
Lender:
LoanType:
InterestType:
TitleCo:ATTORNEYONLY
PROPERTYCHARACTERISTICS
YearBuilt:2001
EffYearBuilt:
Bedrooms:4
Bathrooms:2
#ofStories:1
TotalSqFt:2,058SqFt
Floor1SqFt:2,058SqFt
Floor2SqFt:
BasementSqFt:
Lotsize:399Acres(173,804SqFt)
GarageSqFt:576SqFt
GarageType:
AC:
Pool:
HeatSource:HeatPump
Fireplace:
BldgCondition:Average
Neighborhood:999
Lot:PARCEL1
Block:52
Plat/Subdiv:Pp2000-52
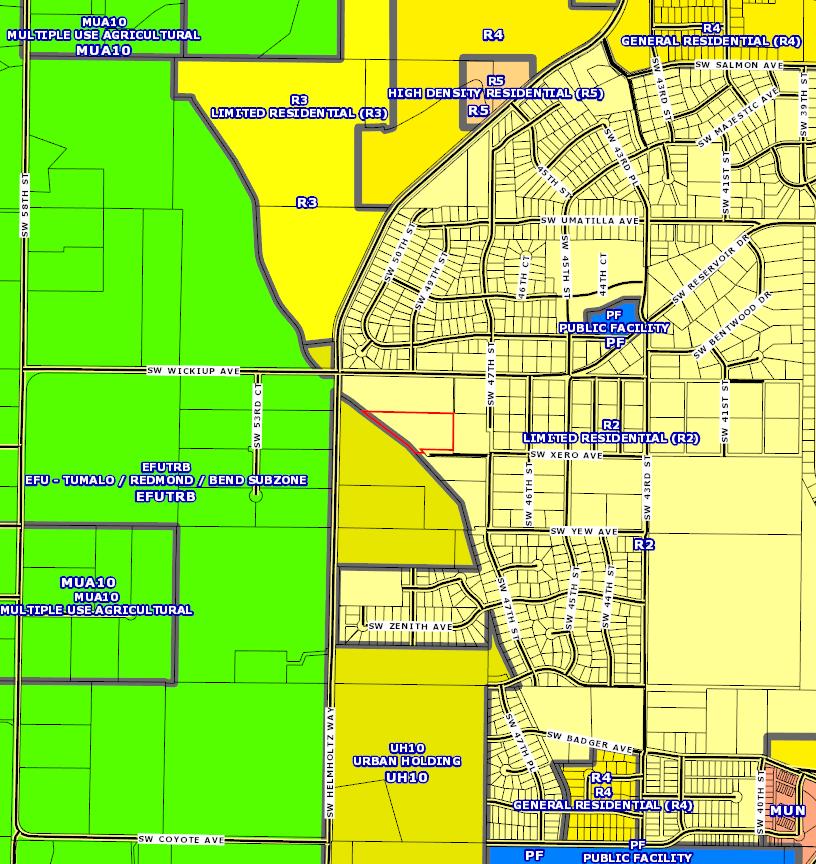
Zoning:R2-LimitedResidential(R2)
SchoolDist:2J-Redmond
Census:1055-001005
Recreation:
SentryDynamics,Inc anditscustomersmakenorepresentations,warrantiesorconditions,expressorimplied,astotheaccuracyorcompletenessofinformationcontainedinthisreport
Deschutes County Property Information

Report Date: 9/26/2023 12:51:14 PM
The information and maps presented in this report are provided for your convenience. Every reasonable effort has been made to assure the accuracy of the data and associated maps. Deschutes County makes no warranty, representation or guarantee as to the content, sequence, accuracy, timeliness or completeness of any of the data provided herein. Deschutes County explicitly disclaims any representations and warranties, including, without limitation, the implied warranties of merchantability and fitness for a particular purpose. Deschutes County shall assume no liability for any errors, omissions, or inaccuracies in the information provided regardless of how caused. Deschutes County assumes no liability for any decisions made or actions taken or not taken by the user of this information or data furnished hereunder.
Account Summary
Account Information
Mailing Address: Map and Taxlot: Account:
Mailing Name: Tax Status: 1513300000905 130245
Situs Address:
Assessable PP2000-52
Subdivision: Block: PARCEL 1 Lot:
Acres: Property Taxes Assessment Tax Code Area: Current Tax Year: 2001 $6,069.09 3.99 Valuation $766,000 $169,390 Land Structures Total $935,390 Real Market Values as of Jan. 1, 2022 $316,790 $316,790 Maximum Assessed Assessed Value Veterans Exemption Current Assessed Values:
Property Class: 191 -- RESIDENTIAL
Warnings, Notations, and Special Assessments
Review of digital records maintained by the Deschutes County Assessor’s Office, Tax Office, Finance Office, and the Community Development Department indicates that there are no special tax, assessment or property development related notations associated with this account. However, independent verification of the presence of other Deschutes County tax, assessment, development, and additional property related considerations is recommended. Confirmation is commonly provided by title companies, real estate agents, developers, engineering and surveying firms, and other parties who are involved in property transactions or property development. In addition, County departments may be contacted directly to discuss the information.
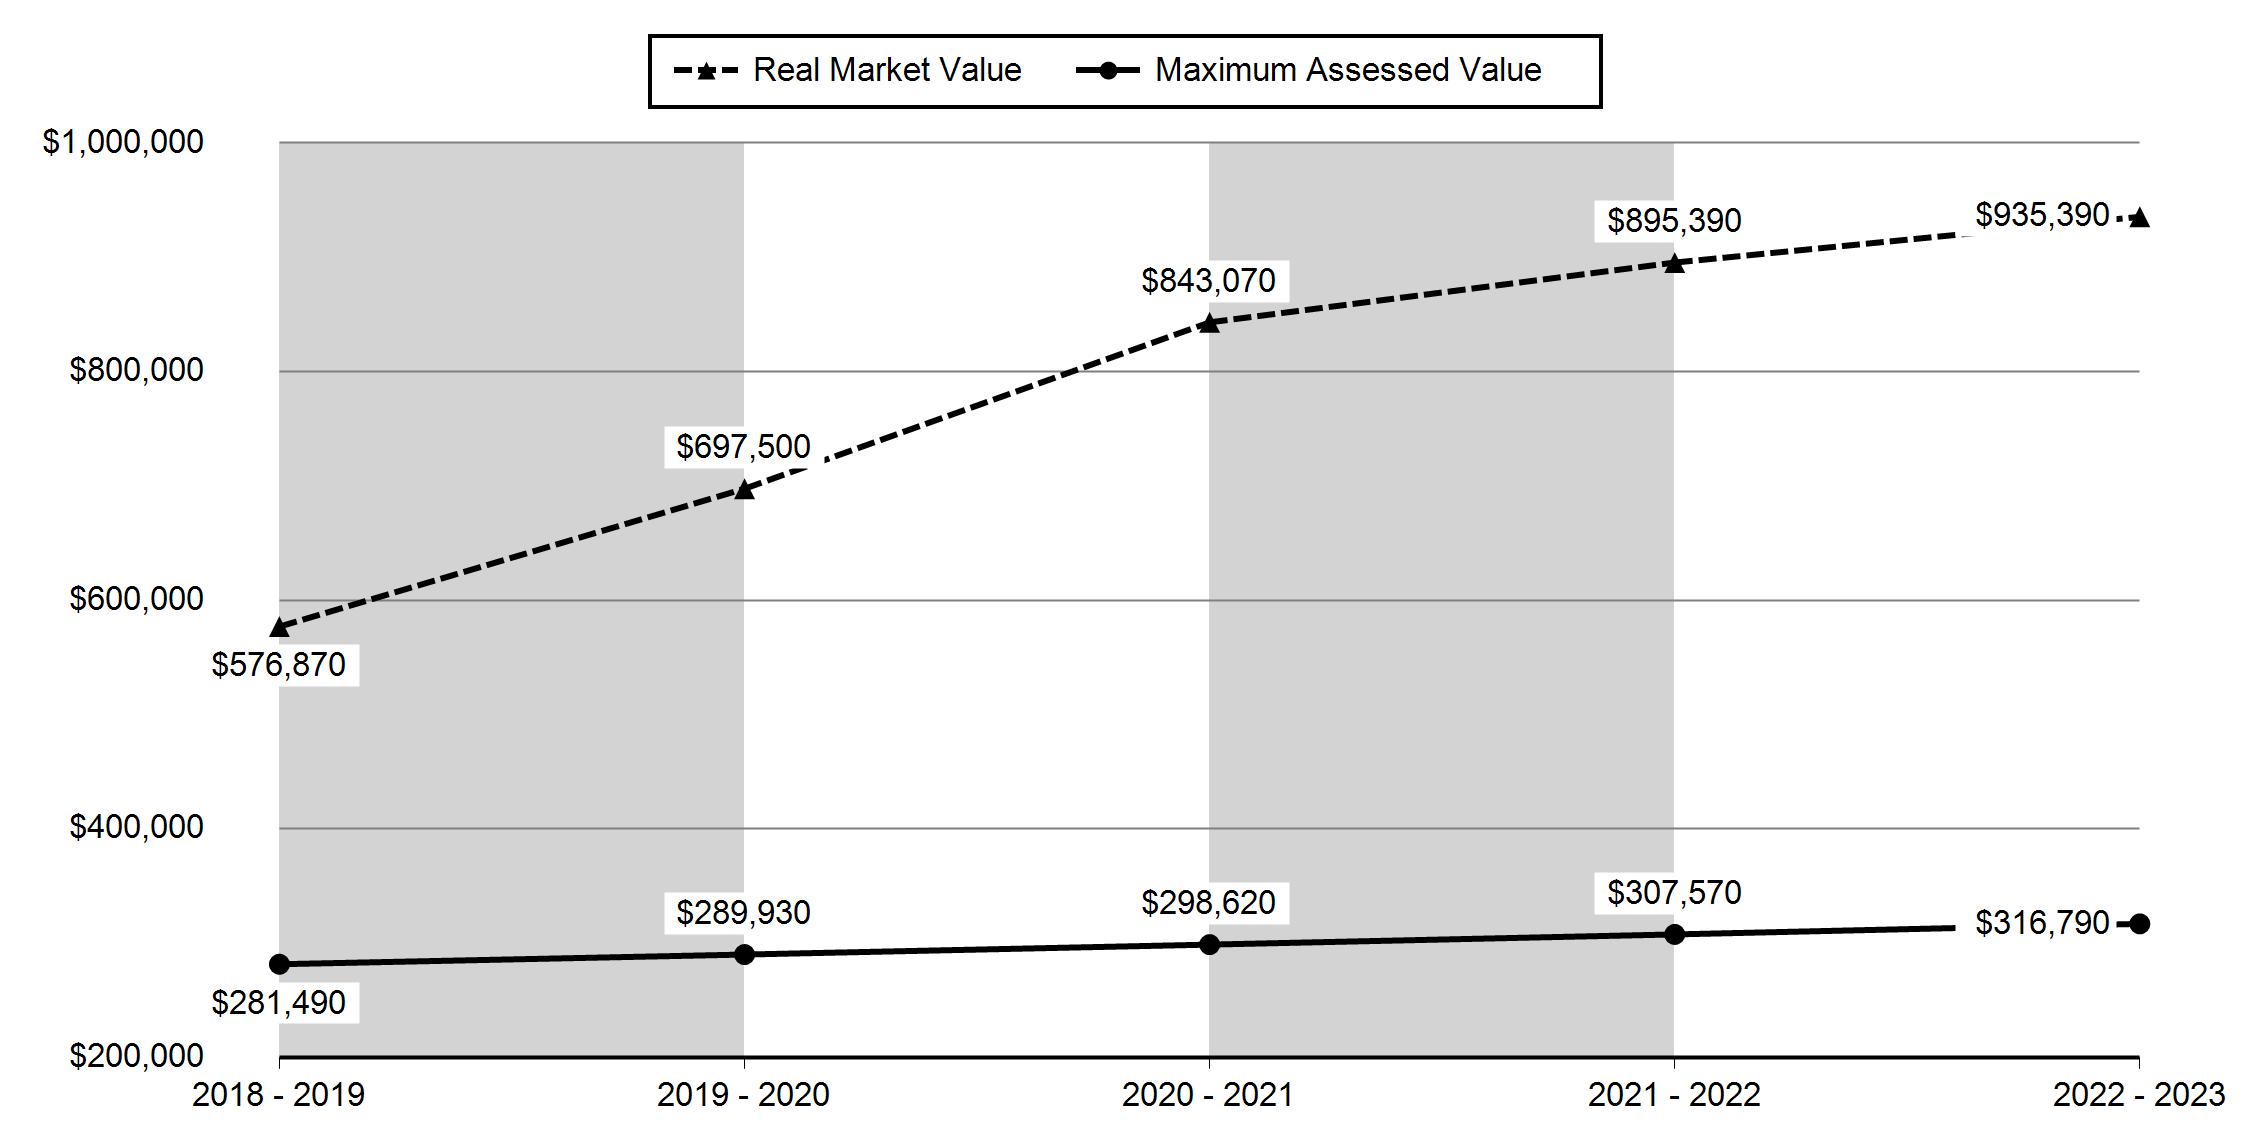
2018 - 2019 2019 - 2020 2020 - 2021 2021 - 2022 2022 - 2023 Real Market Value - Land $472,000 $536,000 $615,000 $656,000 $766,000 Real Market Value - Structures $104,870 $161,500 $228,070 $239,390 $169,390 Total Real Market Value $576,870 $697,500 $843,070 $895,390 $935,390 Maximum Assessed Value $281,490 $289,930 $298,620 $307,570 $316,790 Total Assessed Value $281,490 $289,930 $298,620 $307,570 $316,790 Veterans Exemption $0 $0 $0 $0 $0 Valuation History All values are as of January 1 of each year. Tax year is July 1st through June 30th of each year. Deschutes County Property Information Report, page 1
JOHNNIE MURRAY FAMILY TRUST 3632 SW ZENITH PL REDMOND, OR 97756 Ownership
4807 SW XERO AVE, REDMOND, OR 97756
JOHNNIE MURRAY FAMILY TRUST
Assessor
Disclaimer
Tax Payment History
Sales History
Structures
Year Date Due Transaction Type Transaction Date As Of Date Amount Received Tax Due Discount Amount Interest Charged Refund Interest 2022 11-15-2022 PAYMENT 11-08-2022 11-08-2022 $5,887.02 ($6,069.09) $182.07 $0.00 $0.00 2022 11-15-2022 IMPOSED 10-12-2022 11-15-2022 $0.00 $6,069.09 $0.00 $0.00 $0.00 Total: $0.00 2021 11-15-2021 PAYMENT 11-04-2021 11-04-2021 $5,521.66 ($5,692.43) $170.77 $0.00 $0.00 2021 11-15-2021 IMPOSED 10-11-2021 11-15-2021 $0.00 $5,692.43 $0.00 $0.00 $0.00 Total: $0.00 2020 11-15-2020 PAYMENT 11-09-2020 11-09-2020 $0.00 $0.45 $0.00 $0.00 $0.00 2020 11-15-2020 PAYMENT 11-09-2020 11-09-2020 $5,272.61 ($5,435.67) $163.06 $0.00 $0.00 2020 11-15-2020 IMPOSED 10-09-2020 11-15-2020 $0.00 $5,435.22 $0.00 $0.00 $0.00 Total: $0.00
Sale Date Seller Buyer Sale Amount Sale Type Recording Instrument 10/05/2022 JOHNNIE MURRAY TRUST MURRAY, JOHNNIE M TRUSTEE 08-GRANTOR/GRANTEE ARE THE SAME 2023-4535 01/13/2004 DAVID,DONALD D & APRIL S MURRAY,JOHNNIE M TRUSTEE $0 09-TRADE OR EXCHANGE OF PROPERTIES 2004-2424 06/20/2001 VALUABLE LANDS INC DAVID,DONALD D $105,900 33-CONFIRMED SALE 2001-29706 11/22/2000 VALUABLE LANDS INC MADESH,GREGORY R $80,000 24-CONFIRMED SALE NOT USABLE IN RATIO STUDY 2000-47969 06/05/2000 STIREWALT,JAMES M II VALUABLE LANDS INC $140,000 33-CONFIRMED SALE 2000-22676 04/02/1993 SHEETS KIRBY L ETUX STIREWALT JIM $0 12-DEED RESULTING FROM CONTRACT BEING PAID 1993-2960707 03/31/1993 SHEETS KIRBY L ETUX STIREWALT,JAMES M II $0 06-GRANTEE IS RELATED/FRIENDS/BUSINES S ASSOCIATES 1993-2960712 07/26/1990 UNKNOWN $32,000 30-UNCONFIRMED SALE 1990-2142150
Stat Class/Description Improvement Description Code Area Year Built Total Sq Ft 131 - RESIDENCE: One story 2001 2001 2,058 Deschutes County Property Information Report, page 2 (For Report Disclaimer see page 1)
Related accounts apply to a property that may be on one map and tax lot but due to billing have more than one account. This occurs when a property is in multiple tax code areas. In other cases there may be business personal property or a manufactured home on this property that is not in the same ownership as the land.
Accounts found.
Service Providers Please contact districts to confirm.
Floor Description Comp % Sq Ft First Floor 100 2,058 Living Dining Kitchen Nook Great Family Bed Full Bath Half Bath Bonus Utility Den Other 1 1 1 0 0 0 4 2 0 0 1 0 0 Rooms Floor Description Comp % Sq Ft Garage-Attached-Finished 100 576 AUTOMATIC DOOR OPENER 1 BATHTUB W/FIBRGL SHWR 2 CARPET COMP - ROOF COVER 576 DISHWASHER 1 DRYWALL FOUNDATION - CONCRETE GARBAGE DISPOSAL 1 HEAT PUMP/MINI SPLIT 2,058 HOOD-FAN 1 KITCHEN SINK 1 LAUNDRY TUB 1 LAVATORY 3 MICROWAVE OVEN 1 RECESSED LIGHTING ROOF - GABLE ROOF CVR - COMP SIDING - T1-11/PLYWOOD TOILET 2 VAULTED CEILING VINYL FLOOR WATER HEATER 1 WINDOWS - DOUBLE/THERMAL PANE WINDOWS - METAL Improvement Inventory Accessory Description Sq Ft Quantity DECK-AVERAGE 742 DECK COVER - GOOD 30 Stat Class/Description Improvement Description Code Area Year Built Total Sq Ft 300 - FARM BLDG: GP Building GP Building - CLASS 5 2001 2000 1,080 Floor Description Comp % Sq Ft Building Structure 100 1,080 Land Characteristics Land Description Acres Land Classification Urban Tract 3.99 Ownership Name Type Name Ownership Type Ownership Percentage OWNER JOHNNIE MURRAY FAMILY TRUST, OWNER 100.00% REPRESENTATIVE MURRAY, JOHNNIEM OWNER AS TRUSTEE No Related
Related Accounts Category Name Phone Address COUNTY SERVICES DESCHUTES COUNTY (541) 388-6570 1300 NW WALL ST, BEND, OR 97703 FIRE DISTRICT REDMOND FIRE AND RESCUE (541) 504-5000 341 NW DOGWOOD AVE, REDMOND, OR 97756 SCHOOL DISTRICT REDMOND SCHOOL DISTRICT (541) 923-5437 145 SE SALMON AVE, REDMOND, OR 97756
Deschutes County Property Information Report, page 3 (For Report Disclaimer see page 1)
Development Summary
Permit Detail
ELEMENTARY SCHOOL ATTENDANCE AREA SAGE ELEMENTARY SCHOOL (541) 316-2830 2790 SW WICKIUP, REDMOND, OR 97756 MIDDLE SCHOOL ATTENDANCE AREA OBSIDIAN MIDDLE SCHOOL (541) 923-4900 1335 SW OBSIDIAN, REDMOND, OR 97756 HIGH SCHOOL ATTENDANCE AREA RIDGEVIEW HIGH SCHOOL (541) 504-3600 4555 SW ELKHORN AVE, REDMOND, OR 97756 EDUCATION SERVICE TAX DISTRICT HIGH DESERT EDUCATION SERVICE DISTRICT (541) 693-5600 145 SE SALMON AVE, REDMOND, OR 97756 COLLEGE TAX DISTRICT CENTRAL OREGON COMMUNITY COLLEGE (541) 383-7700 2600 NW COLLEGE WAY, BEND, OR 97703 PARK & RECREATION DISTRICT REDMOND AREA PARK & RECREATION DISTRICT (541) 548-7275 465 SW RIMROCK DR, REDMOND, OR 97756 LIBRARY DISTRICT DESCHUTES PUBLIC LIBRARY (541) 617-7050 601 NW WALL ST, BEND, OR 97703 WATER SERVICE PROVIDER REDMOND WATER DEPARTMENT (541) 504-2000 423 E ANTLER AVE #100, REDMOND, OR 97756 LIVESTOCK DISTRICT DESCHUTES COUNTY LIVESTOCK DISTRICT NUMBER 6 (541) 388-6623 1300 NW WALL ST, BEND, OR 97703 IRRIGATION DISTRICT CENTRAL OREGON IRRIGATION DISTRICT (541) 548-6047 1055 SW LAKE CT, REDMOND, OR 97756 GARBAGE & RECYCLING SERVICE HIGH COUNTRY DISPOSAL (541) 548-4984 1090 NE HEMLOCK AVE, REDMOND, OR 97756 Jurisdiction City Zoning Description Redmond R2 LIMITED RESIDENTIAL - REDMOND UGB Deschutes County Permits Permit ID Permit Type Applicant Application Date Status 247-B47908 Building DAVID,NICK AND APRIL 07/11/2001 Finaled 247-B48897 Building DAVID,DONALD D 03/22/2002 Finaled 247-E57144 Electrical VALUABLE LANDS INC 11/13/2000 Finaled 247-E59647 Electrical DAVID,NICK AND APRIL 07/11/2001 Finaled 247-E59648 Electrical DAVID,NICK AND APRIL 07/11/2001 Finaled 247-FS19766 Feasibility VALUABLE LANDS INC 07/12/2000 Finaled 247-LR9460-PL Land Use SHERI STIREWALT 11/08/1994 Finaled 247-M22151 Mechanical DAVID,NICK AND APRIL 07/11/2001 Finaled 247-P19393 Plumbing DAVID,NICK AND APRIL 07/11/2001 Finaled 247-S61992 Septic JOHNNIE MURRAY TRUST 12/07/2011 Finaled 247-S47549 Septic DAVID,DONALD & APRIL 07/06/2001 Finaled City of Redmond Permits Permit ID Permit Type Applicant Application Date Status 711-15-000630-SD Building JOHNNIE MURRAY TRUST 05/18/2015 App Submitted/Addl Info Needed 711-P37099 Plumbing JOHNNIE MURRAY TRUST, ;MURRAY,JOHNNIE M 12/07/2011 Finaled
Planning Jursidiction: Urban Reserve Area: Urban Growth Boundary: Redmond No Redmond 247-B48897 Permit Number: DAVID,DONALD D Permit Name: NORTHWEST POLE BUILDERS INC Contractor: 03/22/2002 Application Date: 03/27/2002 Issue Date: 04/05/2002 Final Date: Finaled Status: Building Permit Details Residential Building Class: New Construction Class of Work: BARN Building Use: 1080 Square Feet: 0 Bedrooms: 1 Stories: N On Sewer: $16,200 Permit Valuation: Inspections
Deschutes County Property Information Report, page 4 (For Report Disclaimer see page 1)
Date Init. Comments
04/05/2002 SFJ FRAME/FINAL APPROVED
04/01/2002 SFJ FOOTING APPROVED
03/26/2002 CEW GC - U-1, 1,080 SF X 15.00 = 16,200.00
03/22/2002 LJP NO SEPTIC ISSUED SYSTEM JUST INSTALLED/FINALED 11/01
03/22/2002 LJP OK TO TAKE IN PER WCS/PLANNING=UGB
03/22/2002 LJP THIS IS FOR A POLE BARN 36 X 30 = 1080 X 15 = 16200
Permit Number: DAVID,NICK AND APRIL Permit Name: JONES,BLAINE
247-B47908
09/14/2001 SFJ CORRECTION 1) BLOCK BETWEEN TRUSSES WHERE RAFTERS BEAR DOWN ON SHEATHING ONLY.
08/31/2001 SFJ INSPECTION NOTICE: 1. INSTALL APPROVED HEADERS OR SUBMIT PLAN FOR REVISION (PLAN LIST 6X8 HEADER 4X8 INSTALLED) AND GLUE LAM, NONE OF HEADERS ARE AS PER APPROVED PLANS. 2. ADD BLOCKING WHERE RAFTER BEAR ON SHEATHING. 3. PROVIDE A MIN 22"X30" ACCESS (CUT BACK SHEATHING)
08/27/2001 SFJ GC NOT READY
08/07/2001 SFJ CORRECTIONS 1) REMOVE ALL CONSTRUCTION DEBRIS BY FINAL 2) BACKFILL AND RESET VAPER BARRIER AT SEWER PENITRATION AND WATER SERVICE
Building Permit Details
711-15-000630-SD
Improvement plans for Subdivision
No inspection records found.
Electrical Permit Details
247-E59647
AND APRIL
GARAGE
Service Description: RESIDENTIAL - SINGLE OR MULTI-FAMILY PER DWELLING UNIT. SERVICE INCLUDED. 1,000 SQ FT OR LESS. (1) RES WIRING EACH ADD. 500 FT OR PORTION (4)
Contractor: 07/11/2001 Application Date: 07/24/2001 Issue Date: 11/15/2001 Final Date: Finaled Status: Building
Residential Building Class: New Construction Class of Work: RESIDENCE Building Use: 1991 Square Feet: 4 Bedrooms: 1 Stories: N On Sewer: $213,177 Permit Valuation:
Date Init. Comments 11/15/2001 DKP FINAL
Permit Details
Inspections
APPROVED
07/27/2001
07/19/2001 TTT GC R-3*1997 SF X $100.00=$199700.00/R-3N*19 SF X $22.50=$427.50/U-1*580 SF X $22.50=$13050.00/TOTAL=$213177.50.
SFJ FOOTINGS/UFER APPROVED
Permit Number: JOHNNIE
Permit Name: DEL BARBER EXCAVATION INC Contractor: 05/18/2015 Application Date: Issue Date: Final Date: App Submitted/Addl Info Needed Status:
MURRAY TRUST
Residential
New
Class
Public
Building
Square
Bedrooms: Stories: On Sewer: $0 Permit Valuation:
Building Class:
-
of Work:
Use:
Feet:
Inspections
Permit
Permit Name: CHETS
Contractor: 07/11/2001 Application Date: 07/24/2001 Issue Date: 11/15/2001 Final Date: Finaled Status: Residential
New
Class of Work: RES/ATTACHED
Building
Linked
Number: DAVID,NICK
ELECTRIC INC
Building Class:
Construction
Use: 47908
Permit:
Deschutes County Property Information Report, page 5 (For Report Disclaimer see page 1)
Inspections
LIMITED ELECTRICAL ENERGY - 1 & 2 FAMILY DWELLING (1)
LIMITED ELECTRICAL/HEATING, VENTILATION & AIR CONDITIONING SYSTEMS (1)
LIMITED ELECTRICAL/GARAGE DOOR OPENER (1)
2OO AMPS OR LESS/SERVICES/FEEDERS: INSTALLATION, ALTERATION OR RELOCATION (1) EACH BRANCH CIRCUIT WITH PURCHASE OF SERVICE OR FEEDER (2)
IS OWNED BY A CORPORATION WILL NEED LICENSED CONTRACTOR TO POST SIGNED PERMIT- OWNER WILL RESCHEDULE
Feasibility Permit Details
FLN Show test holes on plot plan. Do not flood irrigate drainfield areas. Show COI canal right of way easement on plot plan. Show initial drainfield closer to pits # 1 & 2.
THIS IS FOR A PARTION THIS IS PARCEL 1
Date Init. Comments 11/15/2001 RED *FINAL APPROVED
247-E59648 Permit Number: DAVID,NICK
Permit Name: OWNER Contractor: 07/11/2001 Application Date: 07/24/2001 Issue Date: 11/15/2001 Final Date: Finaled Status: Residential Building Class: New Construction Class of Work: LIMITED Building Use: 47908 Linked Permit: Electrical Permit Details Service Description:
08/31/2001 RED ROUGH & SERVICE APPROVED
AND APRIL
Inspections Date Init. Comments 11/15/2001 RED
08/31/2001
247-E57144 Permit Number: VALUABLE LANDS INC Permit Name: PRINEVILLE ELECTRIC INC Contractor: 11/13/2000 Application Date: 11/13/2000 Issue Date: 12/06/2000 Final Date: Finaled Status: Residential Building Class: New Construction Class of Work: WELL HOUSE Building Use: Linked Permit: Electrical Permit Details Service Description:
*FINAL APPROVED
RED ROUGH APPROVED
Inspections Date Init. Comments 11/01/2010 LEF Property ID/Situs Update
Property
12/06/2000 RED FINAL APPROVED 11/22/2000 RED
247-FS19766 Permit Number: VALUABLE LANDS
Permit Name: 07/12/2000 Application Date: 07/12/2000 Issue Date: 07/27/2000 Final Date: Finaled Status: Residential Building Class: RES Building Use: Site Evaluation Class of Work: Standard System Service Code: 450 Daily Flow Rate: 3 Bedrooms:
through
File Program
PROPERTY
INC
Standard System Approved System Type Code: Approved System Type: Inspections Date Init. Comments 11/01/2010 LEF Property ID/Situs
08/01/2000
07/12/2000
247-LR9460-PL Permit Number: 11/08/1994 Submit Date: Finaled Status: Land Use Permit Details Deschutes County Property Information Report, page 6 (For Report Disclaimer see page 1)
Update through Property File Program
EAM
LJP
SHERI STIREWALT
Application Complete Date: 11/16/1994
Owner:
Permit Name: STIREWALT,JAMES M II
Request: SINGLE LOT LR
Conservation Easement Required:
Conservation Easement Recording Number:
Conservation Easement Description: Conservation Easement Comments:
Mechanical Permit Details
247-M22151
Number: DAVID,NICK AND APRIL
Service Description: ISSUANCE FEE (1)
VENTILATION SYSTEM WHICH IS NOT A PORTION OF ANY HEATING OR AIR-CONDITIONING SYSTEM AUTHORIZED BY A PERMIT (4) INSTALLATION OF HOOD WHICH IS SERVICED BY MECHANICAL EXHAUST, INCLUDING DUCT FOR HOOD (1)
Inspections
No inspection records found.
Plumbing Permit Details
Number: DAVID,NICK AND APRIL
247-P19393
Service Description: ONE & TWO FAMILY/2 BATH (1) WATER SERVICE (EACH ADD'L 100FT OR FRACTION THEREOF) (2) Inspections
Plumbing Permit Details
711-P37099
Number: JOHNNIE MURRAY TRUST, ;MURRAY,JOHNNIE M
Residential Building Class: REMOVE FROM SEPTIC & ATTACH TO CITY SERVICES FOR SEWER (FAILING SEPTIC) - IVR NUMBER = 711100032633 ~ IVR PHONE = 1-888-299-2821
Service Description:
No
Permit Name:
Contractor: 07/11/2001 Application Date: 07/24/2001 Issue Date: 11/15/2001 Final Date: Finaled Status: Residential
New
Class
Building
Permit
CASCADE MECHANICAL SYSTEMS INC
Building Class:
Construction
of Work:
Use: Linked Permit:
Permit
Permit Name:
Contractor: 07/11/2001 Application Date: 07/24/2001 Issue Date: 11/15/2001 Final Date: Finaled Status: Residential Building Class: New Construction Class of Work: 47908 Linked
HAMLET,DANIEL
Permit:
Date Init. Comments 11/15/2001 DKP FINAL APPROVED 08/27/2001 SFJ CORRECTIONS:
NOT READY
Permit Name: Contractor: 12/07/2011 Application Date: 12/12/2011 Issue Date: 12/13/2011 Final Date: Finaled Status:
Linked
Permit
Class of Work:
Permit:
Deschutes County Property Information Report, page 7 (For Report Disclaimer see page 1)
Inspections
Date Init. Comments
12/13/2011 SEF 3200 Sanitary Sewer**JOHNNIE MURRAY CAME IN SENT HER TO FRONT DESK TO TALK W/MONA.
12/13/2011 SEF 3200 Sanitary Sewer**NOTARIZED JOHNNIE MURRAY'S WASTEWATER SDC CERTIFICATE OF CREDIT: $2,348.00. & FORWARDED ORIG. TO DAVID T. PILLING'S ATTENTION.
12/13/2011 SEF 3200 Sanitary Sewer**SCANNED PLUMBING PERMIT APPL'N W/COPY OF WASTEWATER SDC CERT. OF CRED. & FILED IN NON LINK 2011 M BK.
12/13/2011 SEF 3201 Sewer Connection**JOHNNIE MURRAY CAME IN SENT HER TO FRONT DESK TO TALK W/MONA.
12/13/2011 SEF 3201 Sewer Connection**NOTARIZED JOHNNIE MURRAY'S WASTEWATER SDC CERTIFICATE OF CREDIT: $2,348.00. & FORWARDED ORIG. TO DAVID T. PILLING'S ATTENTION.
12/13/2011 SEF 3201 Sewer Connection**SCANNED PLUMBING PERMIT APPL'N W/COPY OF WASTEWATER SDC CERT. OF CRED. & FILED IN NON LINK 2011 M BK.
12/12/2011 RFS CHRIS DOTY CALLED TO AUTHORIZE THE SDC FEE REDUCTION.
12/12/2011 RFS KATHY HARMS HAND DELIVERED JOHNNIE MURRAY'S WASTEWATER SDC CERTIFICATE OF CREDIT & I CONTACTED JOHNNIE ASKING HER TO STOP BY TOMORROW TO DATE, SIGN, BUT NEED TO BE NOTARIZED.
12/12/2011 RFS MONA HAS DOC'S @ FRONT DESK COUNTER. SORRY. WILL REROUTE BACK TO ENGINEERING TO PROCESS.
12/12/2011 RFS PER DAVID T PILLING: GO AHEAD & ISSUE PLUMBING PERMIT SO THAT CURTIS CAN CO-ORDINATE WITH BILL STRAIT @ PUBLIC WORKS, WASTEWATER DEPT.
12/12/2011 RFS SPK W/DAVID T PILLING: HE PREPARED THE CERTIFICATE OF CREDITS ON THE CAPITAL IMPROVEMENTS ONLY. CUSTOMER NEEDS TO PAY FOR TAPPING & REIMBURSEMENT FEES.
12/09/2011 PMT JOHNNIE CALLED SHE SAID SHE DID SPEAK WITH CHRIS DOTY TODAY AND CHRIS SAID HE WOULD LET HER KNOW ON MONDAY ABOUT THE CREDIT THEY MAY BE ABLE TO GET. SHE SAID SHE WOULD LIKE TO HAVE CURTIS DIG ON SITE IF AT ALL POSSIBLE TO BE READY FOR LAYING PIPE ON MONDAY IF EVERYTHING WORKS OUT. I ADV THEY CAN DIG THEY JUST CAN'T LAY ANY PIPE UNTIL THEY GET THE PLUMBING PERMIT. I ADV ALSO IT IS HARD TO CALL FOR INSPECTION FOR THE SAME DAY ALOT OF TIMES THE COUNTY INSPECTORS ARE NOT AVAILABLE. IF THEY ARE AVAILABLE WE MAY BE ABLE TO HAVE THE INSPECTION ON MONDAY BUT IF NOT THEY WOULD HAVE TO WAIT UNTIL TUESDAY FOR THE INSPECTION. I SENT EMAIL TO CHRIS ADV THAT THEY WOULD LIKE TO DO THE WORK ON MONDAY IF ALL IS APPROVED & HAVE IT TAPPED ON MONDAY BY CITY.
12/07/2011 PMT I CALLED JUDY HACKETT @ COUNTY TO CONFIRM THAT IT WOULD BE OK THAT THEY GOT SEPTIC ABANDONMENT PERMIT AFTER THEY GET PLUMBING PERMIT TO CONNECT SHE SAID THAT IS FINE SHE CAN EVEN DO THE PERMIT OVER THE PHONE & TAKE PAYMENT BY CC OVER THE PHONE JUST GIVE APPLICANT HER PH#541-385-1713.
12/07/2011 PMT I PLACED THE APPLICATION IN BIN#5.
12/07/2011 PMT
JOHNNIE MURRAY CALLED SAID THAT THEY HAVE PROBLEMS WITH SEPTIC TANK AT THIS RESIDENCE THEY HAVE A SUMP PUMP OUT ON SITE AND NEED TO CONNECT TO CITY SEWER ASAP. SHE SAID SHE EMAILED CHRIS DOTY YESTERDAY ABOUT WAIVING THE HOOKUP FEES FOR THIS (SDC FEES) BECAUSE THEY GAVE THE CITY AN EASEMENT AND THEY FEEL THE CITY SHOULD WAIVE SOME FEES. I ADV NOT SURE THE PROCEDURE BUT I THINK WAIVING OF FEES GOES TO COUNCIL BUT AS SOON AS I GOT APPLICATION I WOULD CONTACT CHRIS AND SEE HOW FAST WE CAN GET THIS TAKEN CARE OF. SHE SAID THIS HOUSE HAS HAD LOTS OF PROBLEMS THE COUNTY ALLOWED THE HOUSE TO BE PLACED IN THE MIDDLE OF AN ROAD EASEMENT.
12/07/2011 PMT REC EMAIL W/APPLICAITON SENT EMAIL TO CHRIS DOTY ASKING HIM FOR HIS ASSISTANCE ON THIS. I DID ADV JOHNNIE WE DON'T ISSUE PERMITS NORMALLY WITHOUT SDC PAID SO CHRIS WILL HAVE TO DEAL WITH THE SDC PART. I ALSO ADV SHE NEEDS TO LET US KNOW THE DISTANCE OF THE SEWER LINE IT WASN'T ON THE APPLICATION AND SHE NEEDS TO COMPLETE 2ND PAGE ON APPLICATION. I ALSO ADV SHE WILL NEED TO GET A ABANDONMENT PERMIT FROM COUNTY ON SEPTIC.
Septic Permit Details
Permit Number: JOHNNIE MURRAY TRUST
247-S61992
01/05/2012 UNK 7170 Septic Tank Abandonment -- Insp Cancelled : Information Only
01/04/2012 TAG RCVD TA, ROUTED FOR INSPECTION
12/14/2011 TAG EMAILED TA FORM TO OWNER 12/14/2011 TSC TANK FILLED WITH GRAVEL AT SITE. NEED TA FORMS AND PUMP RECEIPT FOR THE RECORD. NOTIFIED EXCAVATOR.
12/13/2011 UNK 7170 Septic Tank Abandonment -- Insp Cancelled : Information Only
12/07/2011 JKH HOOKING TO CITY SEWER. ABANDONING THE EXISTING SYSTEM.
Septic Permit Details
OWNER Contractor: 12/07/2011 Application Date: 12/07/2011 Issue Date: 01/05/2012 Final Date: Finaled Status: Residential
Tank
Class
RESIDENCE
Tank
DEQ
Tank
Maximum Trench
Trench
Permit Name:
Building Class:
Abandonment
of Work:
Building Use:
Material:
Approval Number:
Abandonment Service Code:
Depth:
Length:
Tank
Daily
System
Date
Capacity:
Flow Rate:
Type Linked Feasibility Permit: Inspections
Init. Comments
Deschutes County Property Information Report, page 8 (For Report Disclaimer see page 1)
Permit Number: DAVID,DONALD & APRIL
247-S47549
Inspections Date Init. Comments
11/14/2001 GDC SEPTIC PERMIT FINALED OFF
11/14/2001 JKH AS BUILT SUBMITTED
10/23/2001 GDC SEPTIC REINSPECTION APPROVED--STILL NEED AS-BUILT
09/25/2001 DWH 1-NEED COMPLETED AS-BUILT. 2-NEED 8" FALL FROM TANK TO PIPE IN DRAINFIELD - MIGHT HAVE 4". 3-LINES APPEAR TO BE ON DIFFERENT LEVELS. WOULD LIKE TO MEET ON-SITE WITH LASER.
07/10/2001 GDC AWAITING PLANNING DECISION SO THAT THE SEPTIC PERMIT MAY BE ISSUED.
07/06/2001 LJP THIS IS FOR A PROPOSED FOUR BEDROOM HOME, S.E. ATTACHED. OWNER STATES BLAIN JONES GENERAL CONTRACTOR WILL BE IN THIS AFTERNOON WITH HOUSE PLANS SO NO PLOT PLAN FEE CHARGED (WILL PUT ON BLDG PERMIT).
Assessor's Office Supplemental Information
Legal Description:
Property Class: Subdivision: PP2000-52 Lot: PARCEL 1 Block:
Study Area: Maintenance Area:
Neighborhood:
191 -- RESIDENTIAL
99 7
999
OWNER Contractor: 07/06/2001 Application Date: 07/13/2001 Issue Date: 11/14/2001 Final Date: Finaled Status: Residential Building Class: New System Class of Work: PROPOSED RES Building Use: CONCRETE Tank Material: DEQ Approval Number: Standard System Service Code: 30 Maximum Trench Depth: 300 Trench Length: 1000 Tank Capacity: 450 Daily Flow Rate: STANDARD SYSTEM System Type
Permit Name:
19766
Linked Feasibility Permit:
Deschutes County Property Information Report, page 9 (For Report Disclaimer see page 1)
STATEMENT OF TAX ACCOUNT
JOHNNIE MURRAY FAMILY TRUST MURRAY, JOHNNIE M
2022 ADVALOREM $0.00 $0.00 $0.00 $0.00 $6,069.09 Nov 15, 2022 2021 ADVALOREM $0.00 $0.00 $0.00 $0.00 $5,692.43 Nov 15, 2021 2020 ADVALOREM $0.00 $0.00 $0.00 $0.00 $5,435.22 Nov 15, 2020 2019 ADVALOREM $0.00 $0.00 $0.00 $0.00 $5,197.80 Nov 15, 2019 2018 ADVALOREM $0.00 $0.00 $0.00 $0.00 $5,068.43 Nov 15, 2018 2017 ADVALOREM $0.00 $0.00 $0.00 $0.00 $4,948.01 Nov 15, 2017 2016 ADVALOREM $0.00 $0.00 $0.00 $0.00 $4,879.62 Nov 15, 2016 2015 ADVALOREM $0.00 $0.00 $0.00 $0.00 $4,730.62 Nov 15, 2015 2014 ADVALOREM $0.00 $0.00 $0.00 $0.00 $4,605.96 Nov 15, 2014 2013 ADVALOREM $0.00 $0.00 $0.00 $0.00 $4,381.91 Nov 15, 2013 2012 ADVALOREM $0.00 $0.00 $0.00 $0.00 $3,556.97 Nov 15, 2012 2011 ADVALOREM $0.00 $0.00 $0.00 $0.00 $3,892.95 Nov 15, 2011 2010 ADVALOREM $0.00 $0.00 $0.00 $0.00 $4,329.98 Nov 15, 2010 2009 ADVALOREM $0.00 $0.00 $0.00 $0.00 $4,263.04 Nov 15, 2009 2008 ADVALOREM $0.00 $0.00 $0.00 $0.00 $3,804.08 Nov 15, 2008 2007 ADVALOREM $0.00 $0.00 $0.00 $0.00 $3,668.94 Nov 15, 2007 2006 ADVALOREM $0.00 $0.00 $0.00 $0.00 $3,629.51 Nov 15, 2006 2005 ADVALOREM $0.00 $0.00 $0.00 $0.00 $3,629.15 Nov 15, 2005 2004 ADVALOREM $0.00 $0.00 $0.00 $0.00 $2,726.36 Nov 15, 2004 2003 ADVALOREM $0.00 $0.00 $0.00 $0.00 $2,542.97 Nov 15, 2003 2002 ADVALOREM $0.00 $0.00 $0.00 $0.00 $2,445.90 Nov 15, 2002 2001 ADVALOREM $0.00 $0.00 $0.00 $0.00 $973.38 Nov 15, 2001 2000 ADVALOREM $0.00 $0.00 $0.00 $0.00 $4,346.46 Nov 15, 2000 1999 ADVALOREM $0.00 $0.00 $0.00 $0.00 $1,024.18 Nov 15, 1999 1998 ADVALOREM $0.00 $0.00 $0.00 $0.00 $987.43 Nov 15, 1998 1997 ADVALOREM $0.00 $0.00 $0.00 $0.00 $988.93 Dec 15, 1997 1996 ADVALOREM $0.00 $0.00 $0.00 $0.00 $1,316.41 Nov 15, 1996 1995 ADVALOREM $0.00 $0.00 $0.00 $0.00 $952.42 Nov 15, 1995 1995 FEE $0.00 $0.00 $0.00 $0.00 $283.69 Nov 15, 1995 1994 ADVALOREM $0.00 $0.00 $0.00 $0.00 $1,012.02 Nov 15, 1994 1994 FEE $0.00 $0.00 $0.00 $0.00 $286.32 Nov 15, 1994 1993 ADVALOREM $0.00 $0.00 $0.00 $0.00 $38.05 Nov 15, 1993
DESCHUTES COUNTY TAX COLLECTOR DESCHUTES SERVICES BUILDING BEND OR 97703 (541) 388-6540
SW ZENITH
REDMOND
97756 26-Sep-2023 130245 Tax Account # Account Status Roll Type Situs Address A Real 4807 SW XERO AVE REDMOND 97756 Tax Summary Tax Year Tax Type Total Due Current Due Interest Due Discount Available Original Due Due Date 2001 Sep 26, 2023 Lender Name Loan Number Property ID Interest To $0.00 $0.00 $0.00 $0.00 Total Deschutes County Property Information Report, page 10 (For Report Disclaimer see page 1)
TRUSTEE 3632
PL
OR
REAL PROPERTY TAX STATEMENT
JULY 1, 2022 TO JUNE 30, 2023
DESCHUTES COUNTY, OREGON - 1300 NW WALL ST STE 203, BEND, OR 97703
TAX BY DISTRICT
TAX ACCOUNT: 130245
JOHNNIE MURRAY TRUST
MURRAY,JOHNNIE M TRUSTEE
62685 LARKVIEW RD BEND OR 97701
PROPERTY DESCRIPTION
CODE: 2001
SITUS ADDRESS: MAP: 191 CLASS: 151330-00-00905
LEGAL:
4807 SW XERO AVE REDMOND
PP2000-52 PARCEL 1
Full Payment with 3% Discount
Discount is lost after due date and interest may apply PAYMENT OPTIONS:
* Online
* By Mail to Deschutes County Tax, PO Box 7559 Bend OR 97708-7559
* Drop Box located at 1300 NW Wall Street, Bend or 411 SW 9th Street, Redmond
* In Person 1300 NW Wall Street, Ste 203, Bend (2nd Floor) For Property Information: dial.deschutes.org
Please include this coupon with payment. Please do not staple, paper clip or tape your payment.
Please select payment option
Full Payment (3% Discount)
Two-Thirds Payment (2% Discount)
Next Payment Due
One-Third Payment (No Discount)
Next Payment Due
Payment Due November 15, 2022
JOHNNIE MURRAY TRUST
TAX ACCOUNT: 130245
MURRAY,JOHNNIE M TRUSTEE 62685
(Mailing address change form on reverse)
Please make checks payable to Deschutes County Tax Collector
STRUCTURES TOTAL
TOTAL
VETERAN'S EXEMPTION NET TAXABLE: TOTAL PROPERTY TAX: LAST YEAR THIS YEAR 656,000 239,390 895,390 766,000 169,390 935,390 307,570 0 307,570 5,692.43 316,790 0 316,790 6,069.09 TAX QUESTIONS ASSESSMENT QUESTIONS (541) 388-6540 (541) 388-6508 $5,887.02 No
Due 05/15/23 02/15/23 $2,023.03 $3,965.14 $5,887.02
VALUES: REAL MARKET (RMV) LAND
RMV
ASSESSED VALUE
Additional Payment
Change my Mailing Address
Deschutes County Tax Collector PO Box
Bend
09100001302450000202303000039651400005887020 316,790 307,570 MAXIMUM ASSESSED VALUE
LARKVIEW RD BEND OR 97701
7559
OR 97708-7559
AMOUNT ENCLOSED $
www.deschutes.org/tax SCHOOL DISTRICT #2J 1,476.05 C O C C 182.25 HIGH DESERT ESD 28.35 EDUCATION TOTAL: 1,686.65 DESCHUTES COUNTY 357.88 COUNTY LIBRARY 161.59 COUNTYWIDE LAW ENFORCEMENT 308.46 COUNTY EXTENSION/4H 6.62 9-1-1 106.28 CITY OF REDMOND 1,295.39 REDMOND DWNTWN URBAN RENEWAL 303.77 REDMOND SOUTH 97 URBAN RENEWAL 52.90 REDMOND FIRE & RESCUE 515.29 REDMOND FIRE & RESCUE LOCAL OPTION 85.53 REDMOND AREA PARK & REC DISTRICT 109.20 GENERAL GOVT TOTAL: 3,302.91 COUNTY LIBRARY BOND 106.88 CITY OF REDMOND BOND 2022 229.10 SCHOOL #2J BOND 2004 237.66 SCHOOL #2J BOND 2008 407.71 SCHOOL #2J BOND 2021 73.88 C O C C BOND 24.30 BONDS - OTHER TOTAL: 1,079.53 Deschutes County Property Information Report, page 11 (For Report Disclaimer see page 1)
Deschutes County Property Information Report, page 12 (For Report Disclaimer see page 1)

De sc h u te s C o u n ty GIS De sc hu t es Cou nt y P rop er t y I nf orm at i on - Di al Roa d Map Map and Ta x l ot: 151 33 00000905 Deschutes County Property Information Report, page 13 (For Report Disclaimer see page 1)
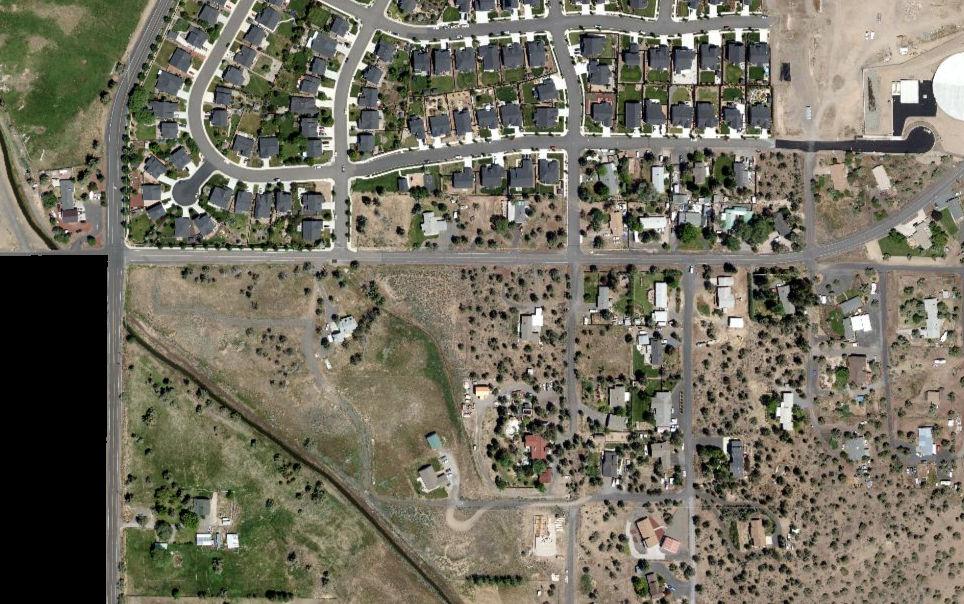
AerialMap
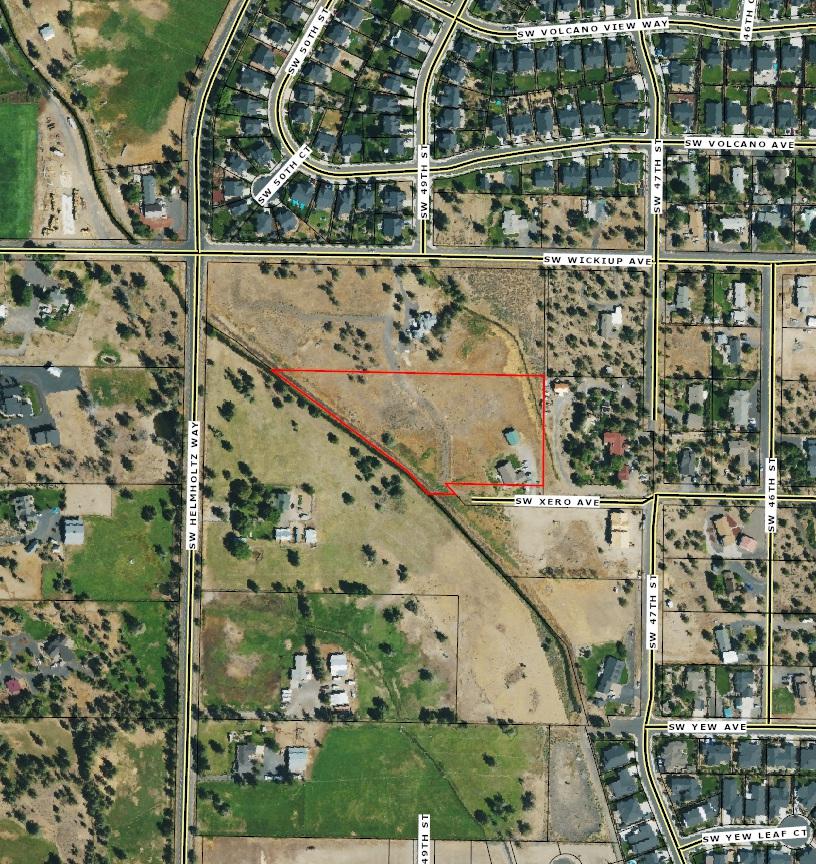
ParcelID:130245
TaxAccount#:1513300000905
4807SWXeroAve, RedmondOR97756
Thismap/platisbeingfurnishedasanaidinlocatingtheherein describedlandinrelationtoadjoiningstreets,naturalboundariesand otherland,andisnotasurveyofthelanddepictedExcepttotheextent apolicyoftitleinsuranceisexpresslymodifiedbyendorsement,ifany, thecompanydoesnotinsuredimensions,distances,locationof easements,acreageorothermattersshownthereon
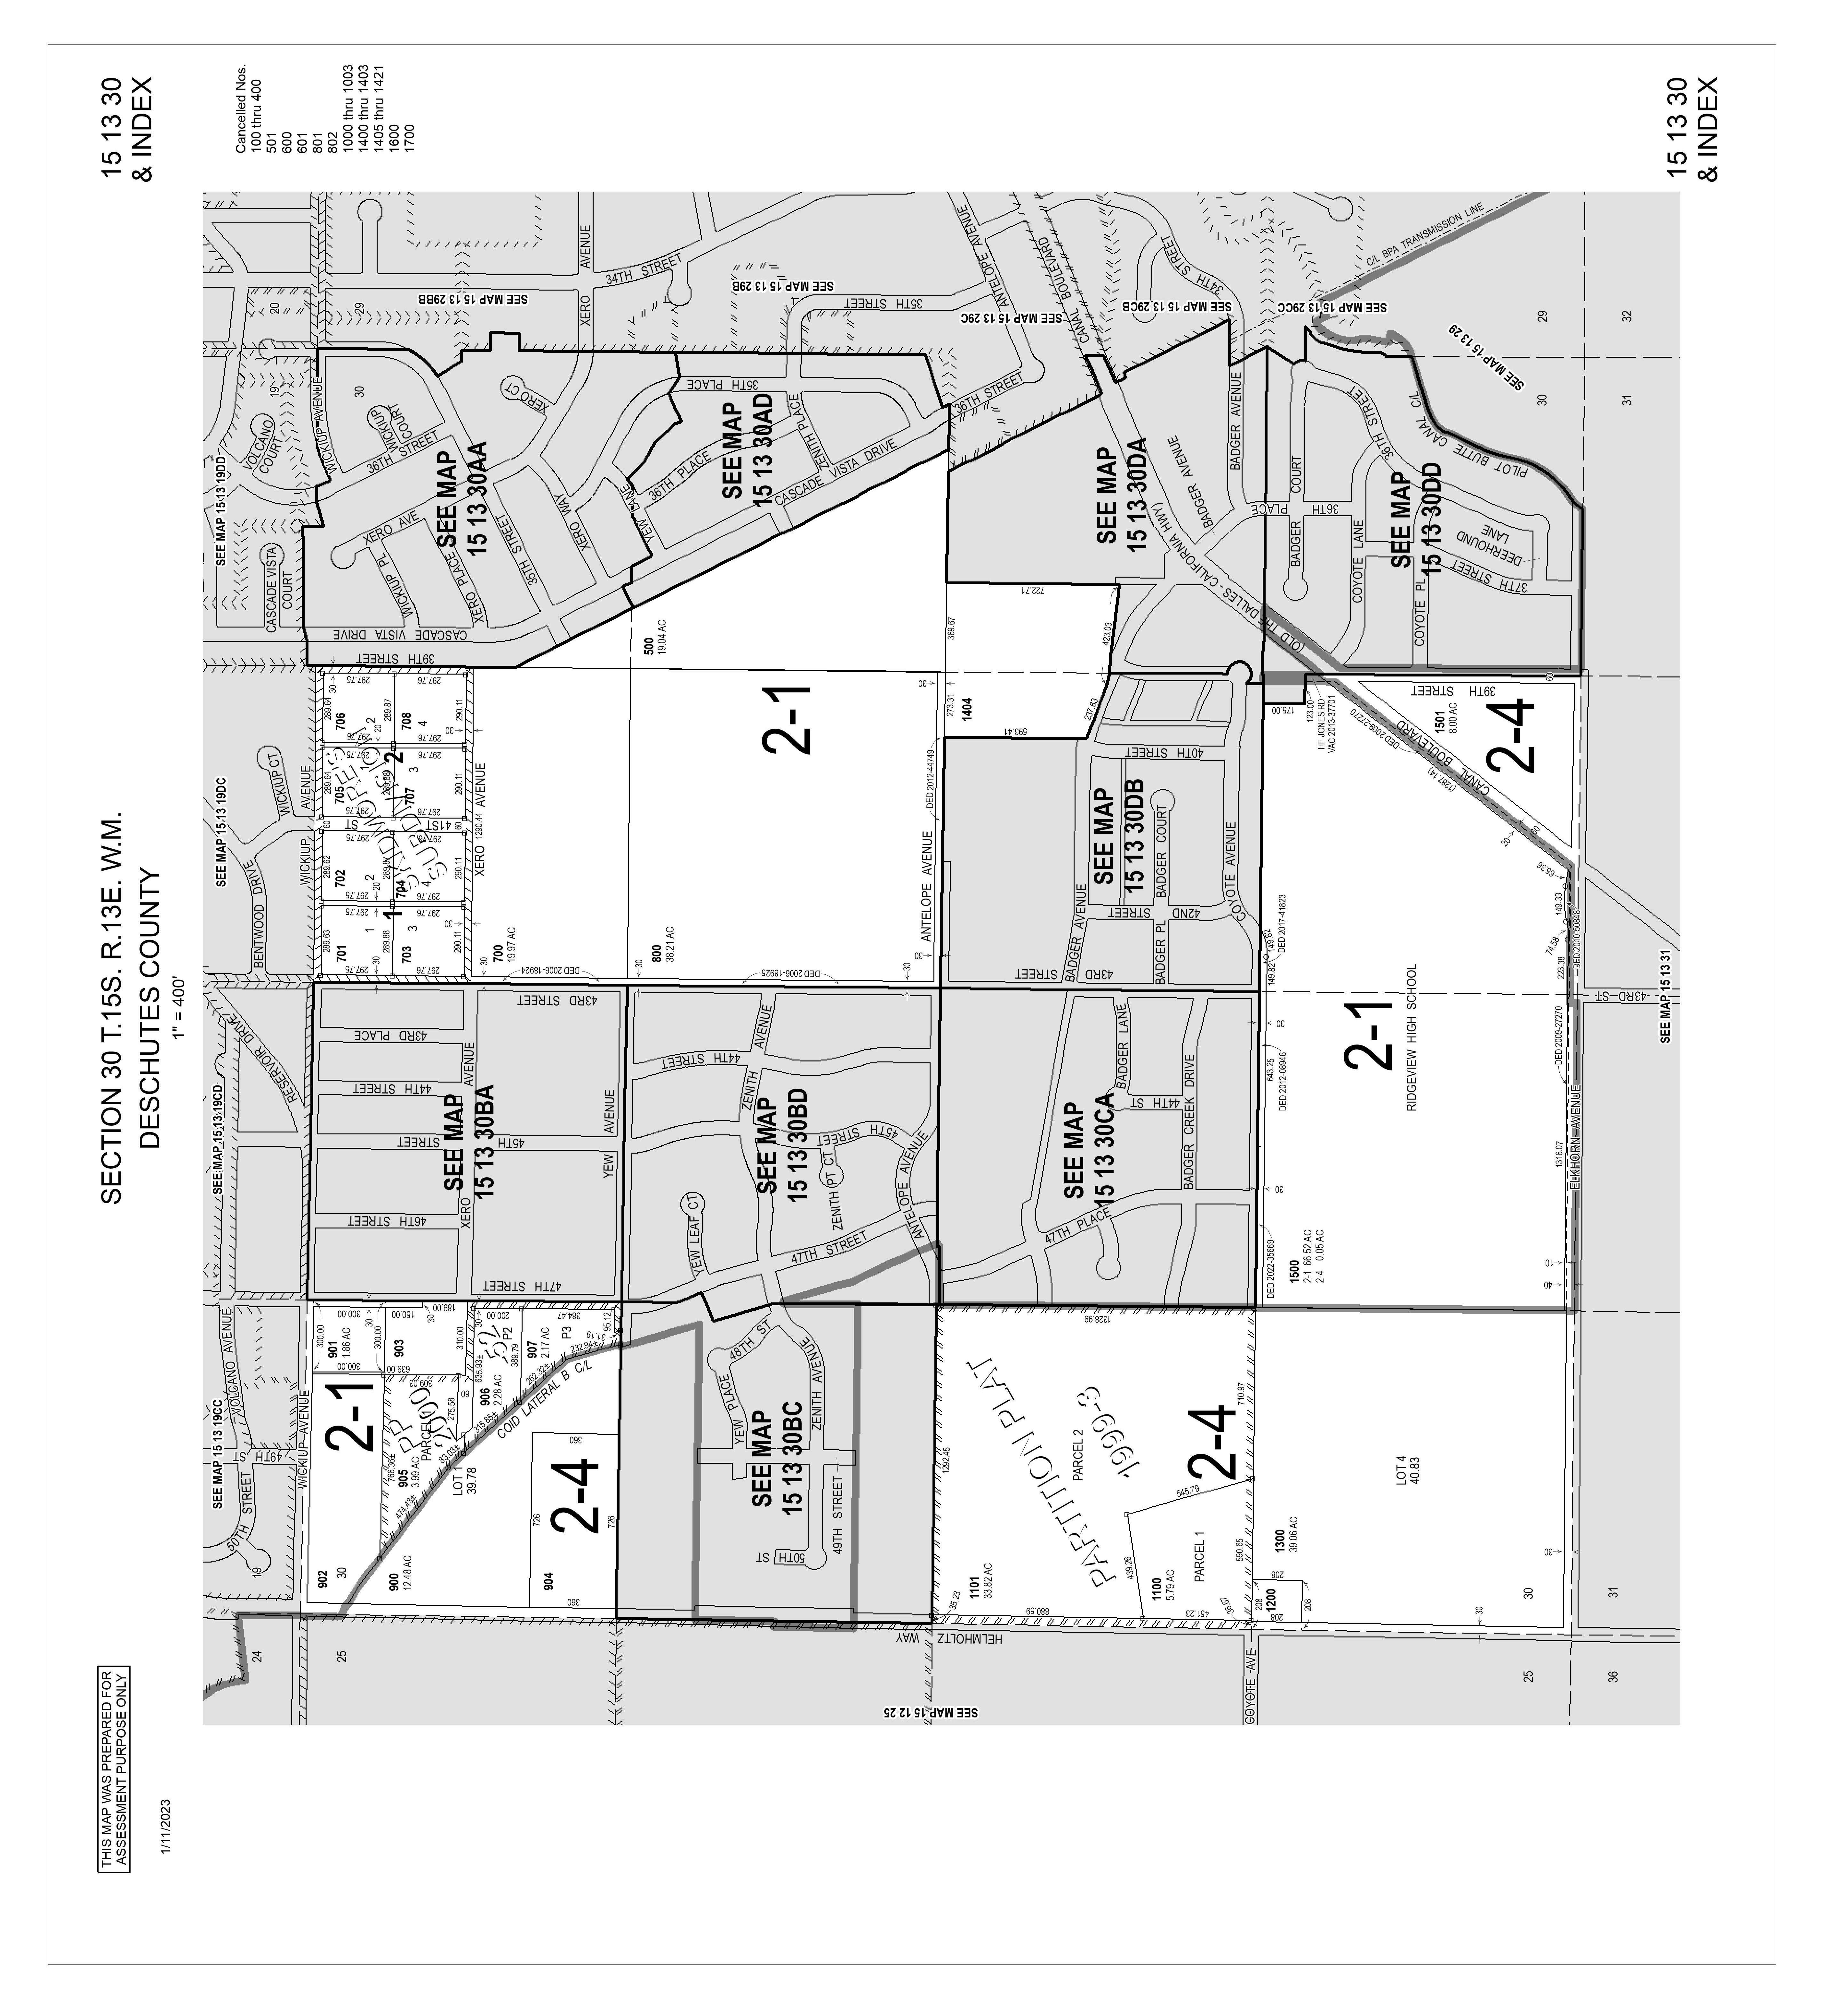
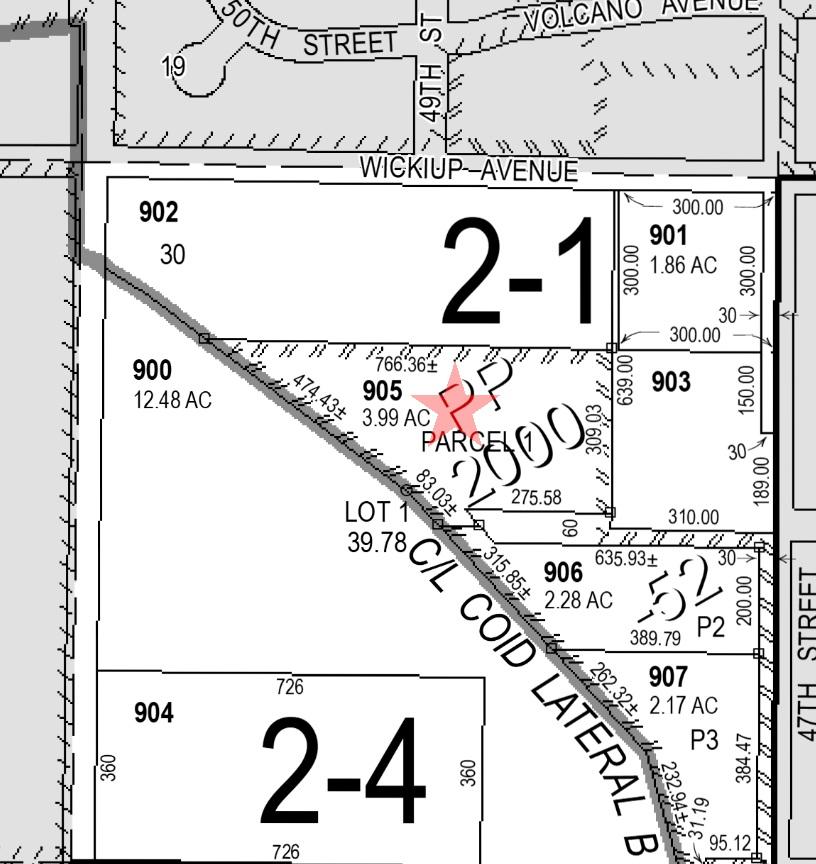
AssessorMap
ParcelID:130245
TaxAccount#:1513300000905
4807SWXeroAve, RedmondOR97756
Thismap/platisbeingfurnishedasanaidinlocatingtheherein describedlandinrelationtoadjoiningstreets,naturalboundariesand otherland,andisnotasurveyofthelanddepictedExcepttotheextent apolicyoftitleinsuranceisexpresslymodifiedbyendorsement,ifany, thecompanydoesnotinsuredimensions,distances,locationof easements,acreageorothermattersshownthereon


FloodMap
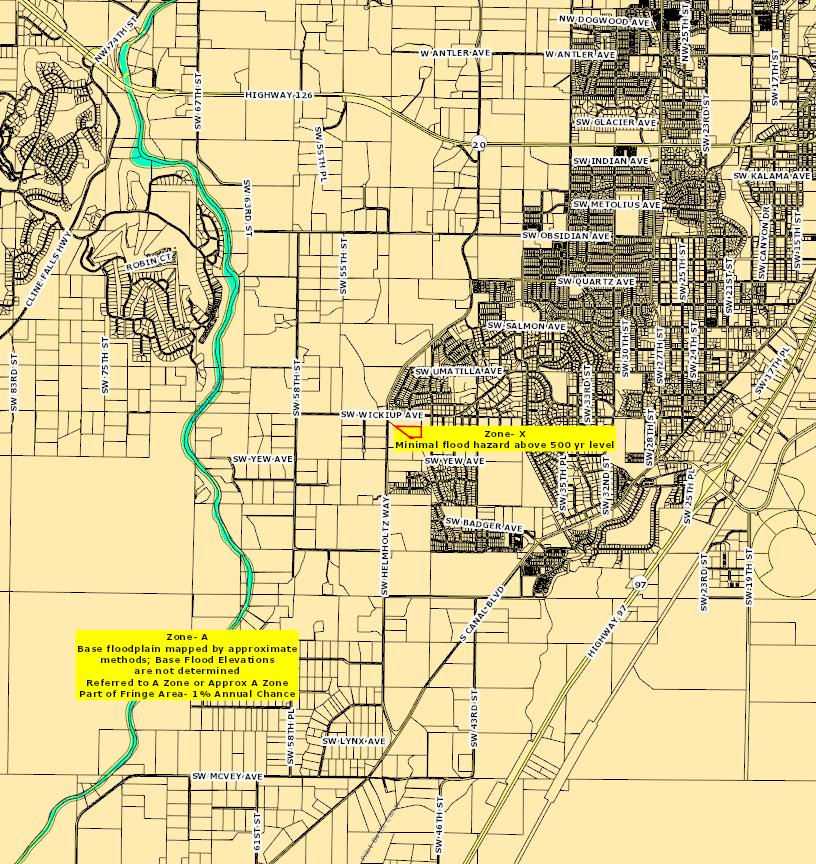
ParcelID:130245
TaxAccount#:1513300000905
4807SWXeroAve, RedmondOR97756
Thismap/platisbeingfurnishedasanaidinlocatingtheherein describedlandinrelationtoadjoiningstreets,naturalboundariesand otherland,andisnotasurveyofthelanddepictedExcepttotheextent apolicyoftitleinsuranceisexpresslymodifiedbyendorsement,ifany, thecompanydoesnotinsuredimensions,distances,locationof easements,acreageorothermattersshownthereon
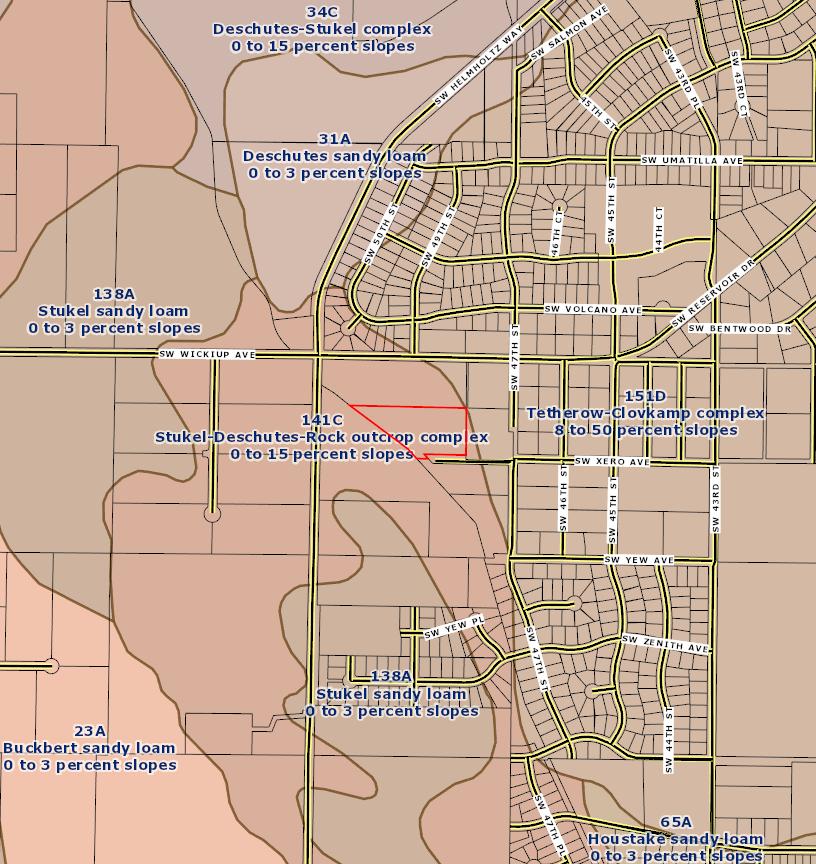
SoilMap
ParcelID:130245
TaxAccount#:1513300000905
4807SWXeroAve, RedmondOR97756
Thismap/platisbeingfurnishedasanaidinlocatingtheherein describedlandinrelationtoadjoiningstreets,naturalboundariesand otherland,andisnotasurveyofthelanddepictedExcepttotheextent apolicyoftitleinsuranceisexpresslymodifiedbyendorsement,ifany, thecompanydoesnotinsuredimensions,distances,locationof easements,acreageorothermattersshownthereon
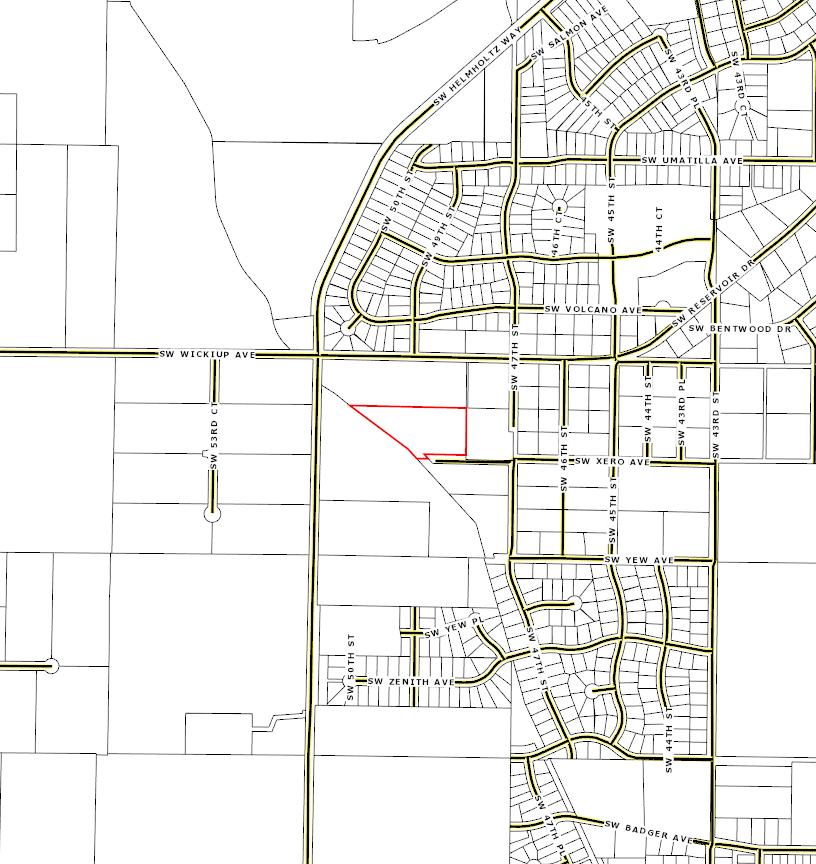
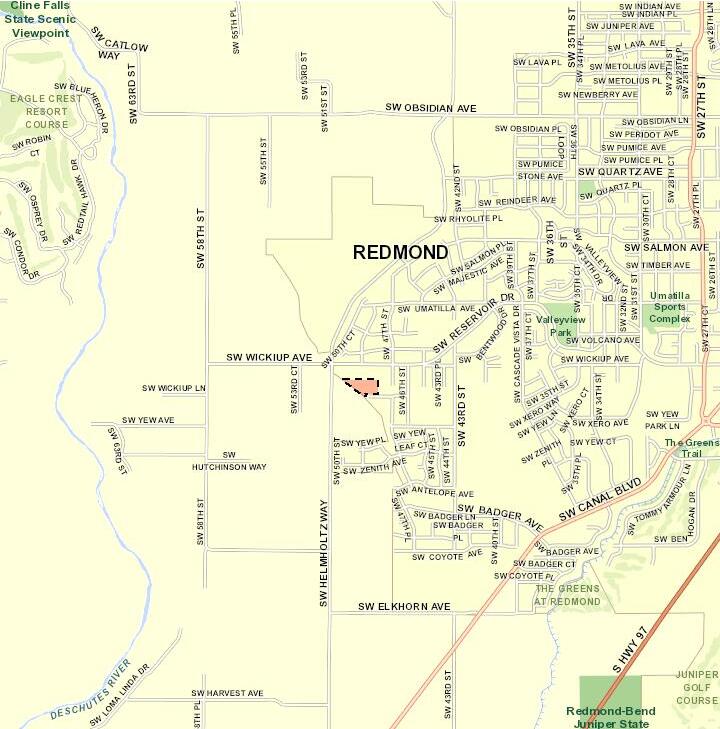
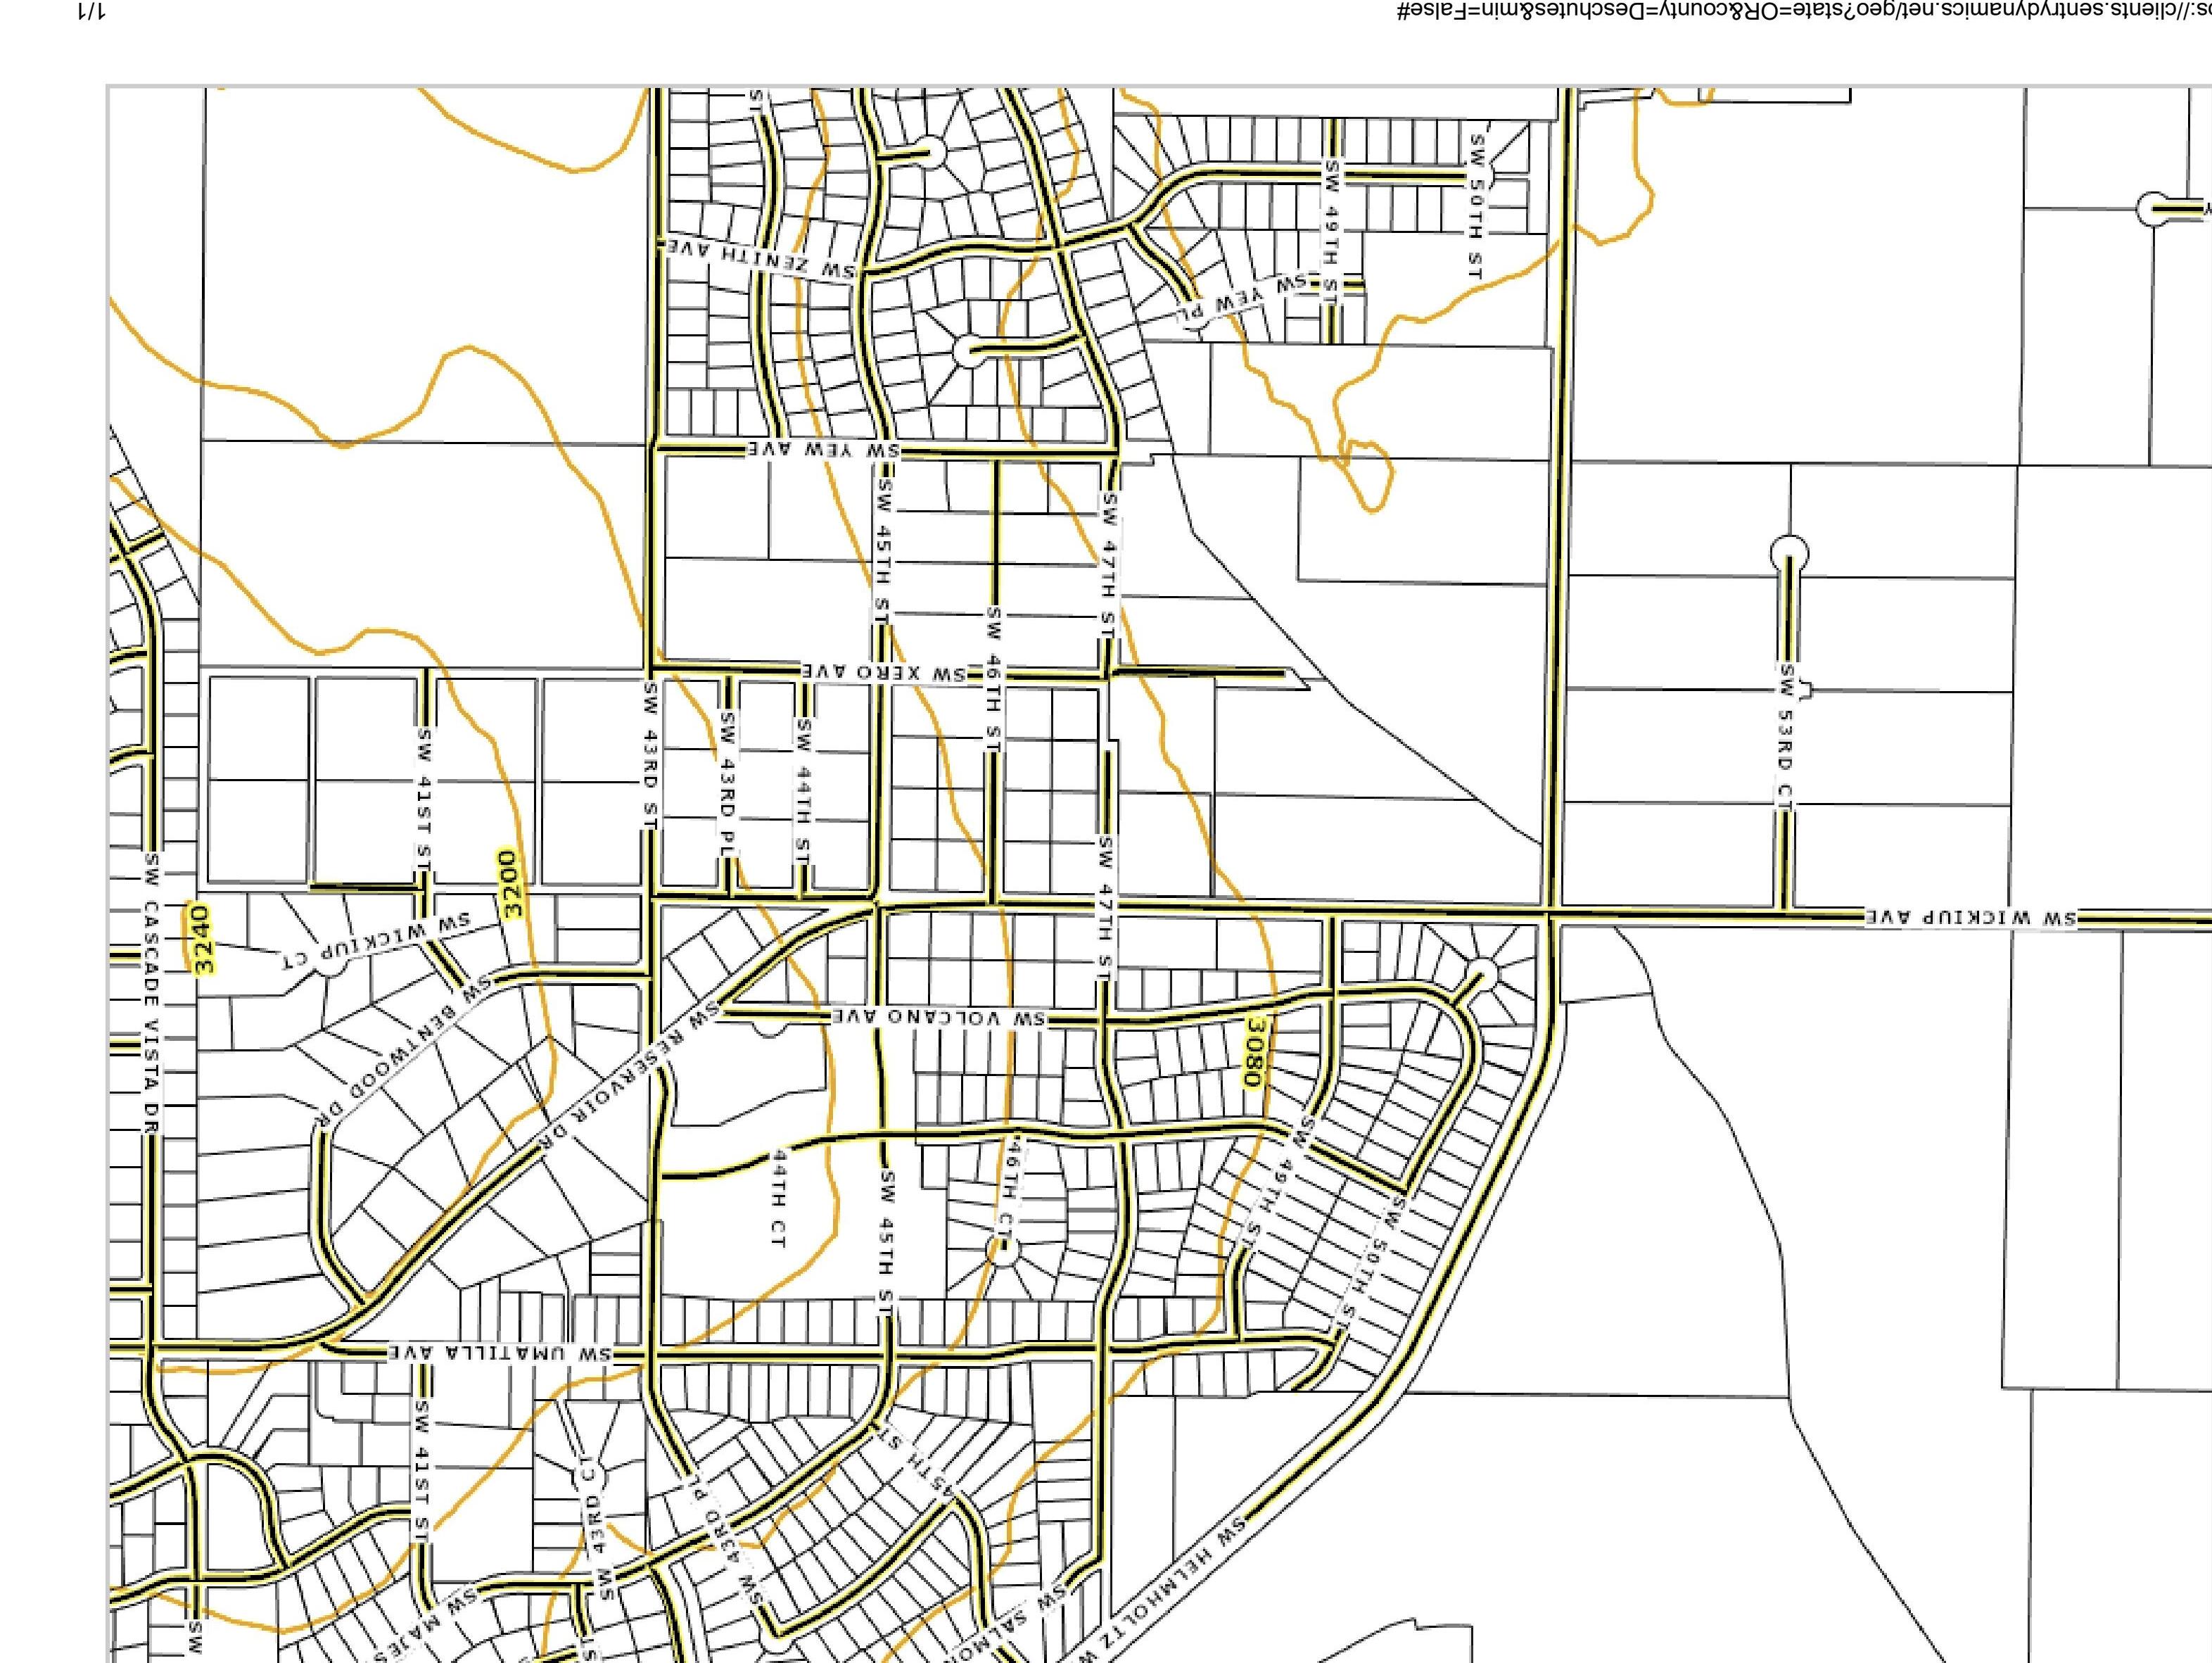
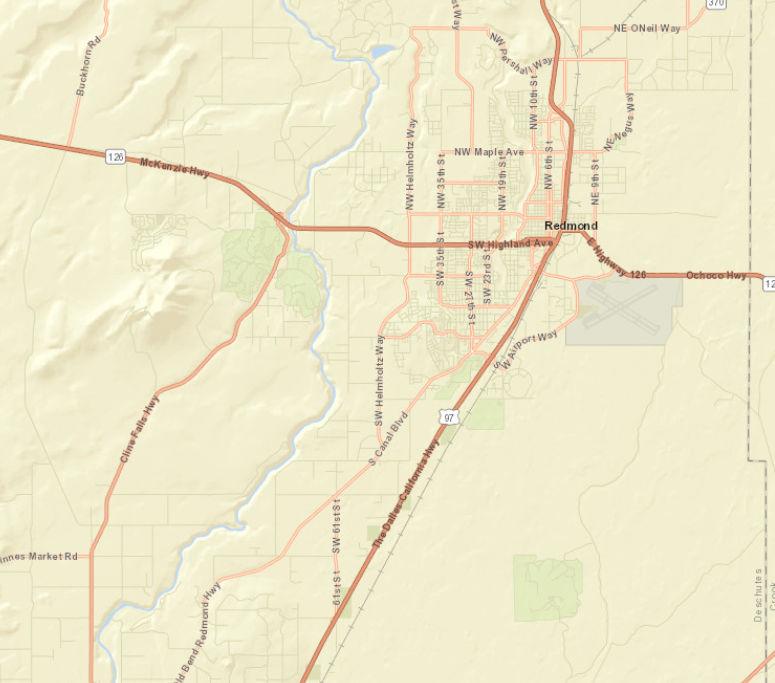
StreetMap
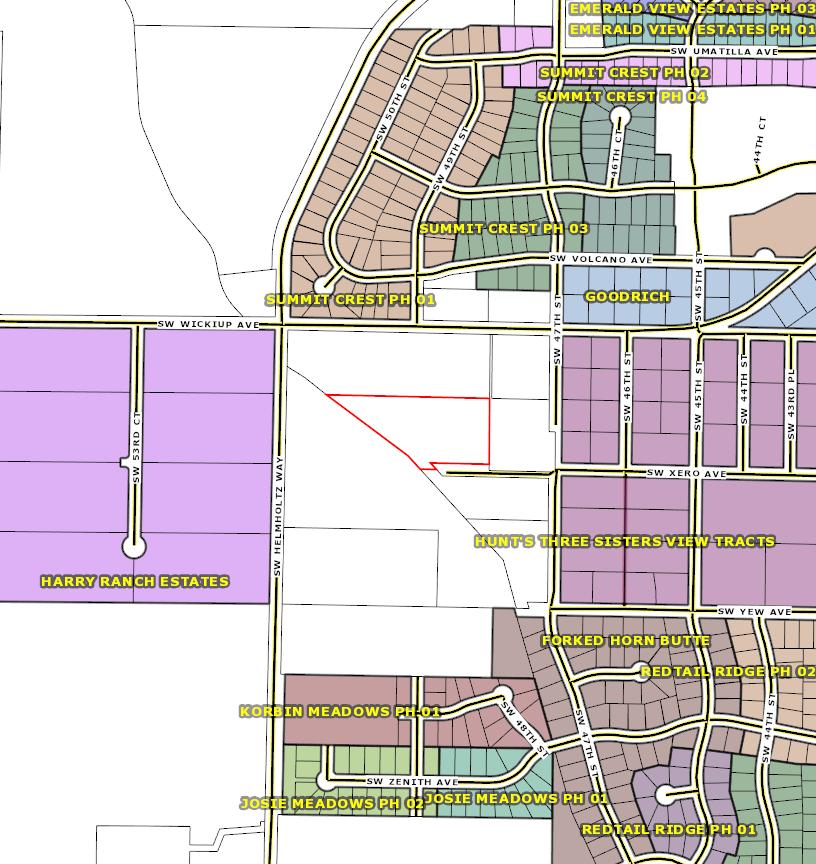
SubdivisionMap
ParcelID:130245
TaxAccount#:1513300000905
4807SWXeroAve, RedmondOR97756
Thismap/platisbeingfurnishedasanaidinlocatingtheherein describedlandinrelationtoadjoiningstreets,naturalboundariesand otherland,andisnotasurveyofthelanddepictedExcepttotheextent apolicyoftitleinsuranceisexpresslymodifiedbyendorsement,ifany, thecompanydoesnotinsuredimensions,distances,locationof easements,acreageorothermattersshownthereon


ZoningMap
ParcelID:130245
TaxAccount#:1513300000905
4807SWXeroAve, RedmondOR97756
Thismap/platisbeingfurnishedasanaidinlocatingtheherein describedlandinrelationtoadjoiningstreets,naturalboundariesand otherland,andisnotasurveyofthelanddepictedExcepttotheextent apolicyoftitleinsuranceisexpresslymodifiedbyendorsement,ifany, thecompanydoesnotinsuredimensions,distances,locationof easements,acreageorothermattersshownthereon
CHAPTER 8
REDMOND CODE
The contents of Chapter Development Regulations can be found here: https://www.redmondoregon.gov/home/showpublisheddocument/3426/638091 082331730000
DEVELOPMENT REGULATIONS

S W 4 6 t h C t S W 4 7 t h S t Way Ave S W 4 3 r d P l eservoirDr Acct # 130245 Water Distribution System Aerial Esri Community Maps Contributors, Oregon State Parks, State of Oregon GEO, © OpenStreetMap, Microsoft, Esri, HERE, Garmin, SafeGraph, REDMOND TAXLOTS WATER LATERAL Commercial Domestic Fire HydrantLaterals Industrial Irrigation System Commercial/Fire GRAVITY MAIN SYSTEM VALVE FITTINGS Bend Cap Coupling Cross ExpansionJoint 9/26/2023, 3:18:20 PM 0 0.06 0.11 0.03 mi 0 0.09 0.17 0.04 km 1:4,514 Web AppBuilder for ArcGIS Esri Community Maps Contributors, Oregon State Parks, State of Oregon GEO, © OpenStreetMap, Microsoft, Esri, HERE, Garmin, SafeGraph, GeoTechnologies, Inc, METI/NASA, USGS, Bureau of Land Management, EPA, NPS, US Census Bureau, USDA | Esri
SW S W d S W 4 7 t h S t WVolcano Volcano Av Acct # 130245 Water Distribution System No Aerial Esri Community Maps Contributors, Oregon State Parks, State of Oregon GEO, © OpenStreetMap, Microsoft, Esri, HERE, Garmin, SafeGraph, REDMOND TAXLOTS WATER LATERAL Commercial Domestic Fire HydrantLaterals Industrial Irrigation System Commercial/Fire GRAVITY MAIN SYSTEM VALVE FITTINGS Bend Cap Coupling Cross ExpansionJoint 9/26/2023, 4:48:55 PM 0 0.06 0.11 0.03 mi 0 0.09 0.17 0.04 km 1:4,514 Web AppBuilder for ArcGIS Esri Community Maps Contributors, Oregon State Parks, State of Oregon GEO, © OpenStreetMap, Microsoft, Esri, HERE, Garmin, SafeGraph, GeoTechnologies, Inc, METI/NASA, USGS, Bureau of Land Management, EPA, NPS, US Census Bureau, USDA | Esri
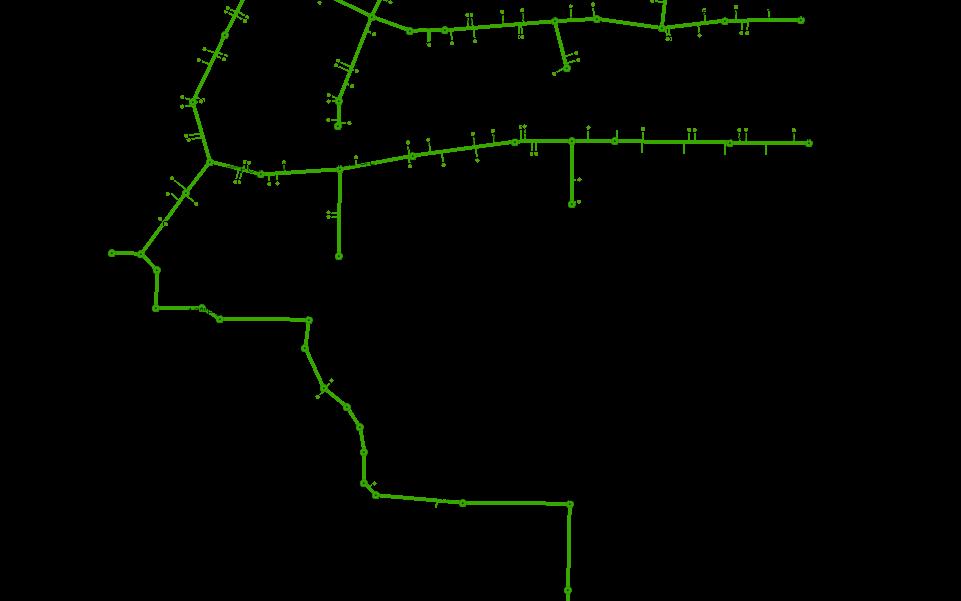
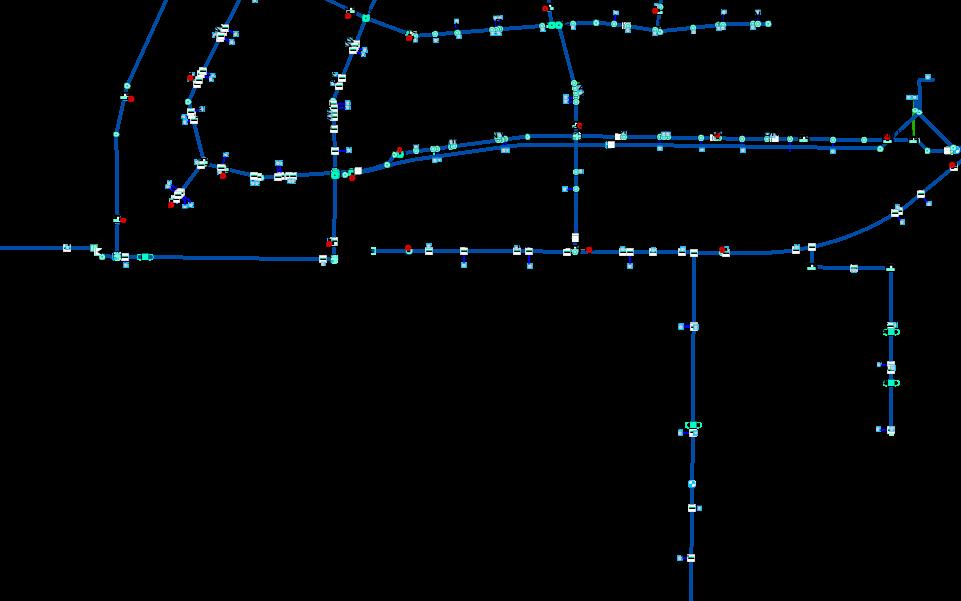
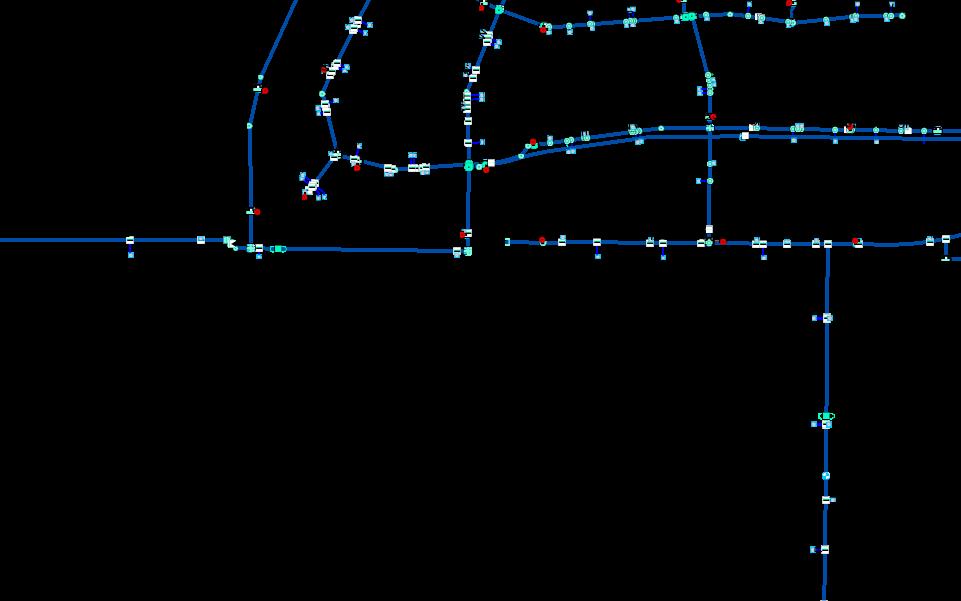
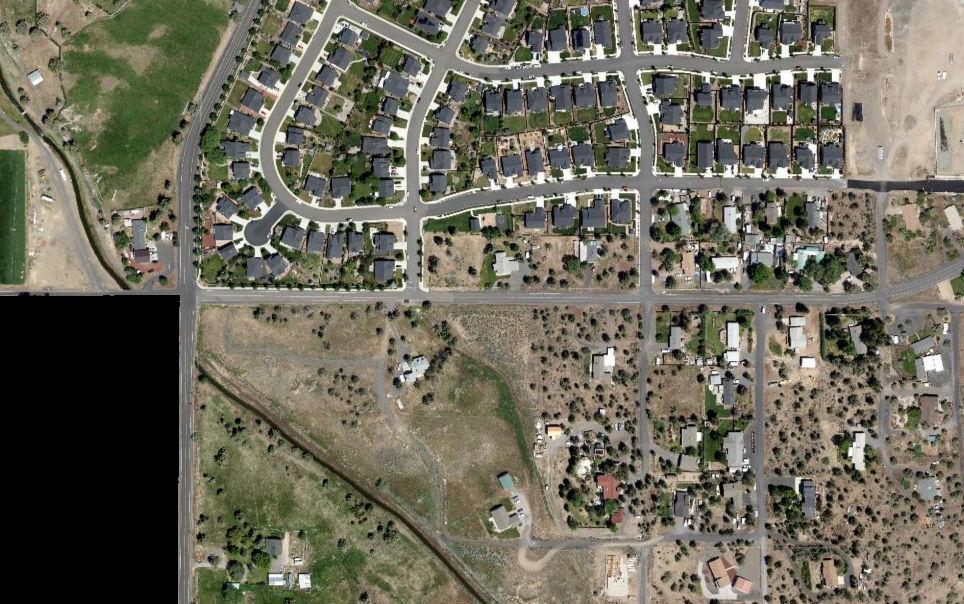
S W 4 6 t h C t S W 4 7 t h S t Way Ave S W 4 3 r d P l eservoirDr Acct # 130245 Waste Water Collection System Aerial Esri Community Maps Contributors, Oregon State Parks, State of Oregon GEO, © OpenStreetMap, Microsoft, Esri, HERE, Garmin, SafeGraph, COLLECTION MAIN SERVICE LATERAL CLEAN OUT MANHOLE PRESSURE MAIN PUMP STATION REDMOND TAXLOTS 9/26/2023, 3:20:32 PM 0 0.06 0.11 0.03 mi 0 0.09 0.17 0.04 km 1:4,514 Web AppBuilder for ArcGIS Esri Community Maps Contributors, Oregon State Parks, State of Oregon GEO, © OpenStreetMap, Microsoft, Esri, HERE, Garmin, SafeGraph, GeoTechnologies, Inc, METI/NASA, USGS, Bureau of Land Management, EPA, NPS, US Census Bureau, USDA | Esri
S W 4 6 t h C t S W 4 7 t h S t wWay Ave S W 4 3 r d P l eservoirDr Acct # 130245 Waste Water Collection System No Aerial Esri Community Maps Contributors, Oregon State Parks, State of Oregon GEO, © OpenStreetMap, Microsoft, Esri, HERE, Garmin, SafeGraph, COLLECTION MAIN SERVICE LATERAL CLEAN OUT MANHOLE PRESSURE MAIN PUMP STATION REDMOND TAXLOTS 9/26/2023, 3:25:25 PM 0 0.06 0.11 0.03 mi 0 0.09 0.17 0.04 km 1:4,514 Web AppBuilder for ArcGIS Esri Community Maps Contributors, Oregon State Parks, State of Oregon GEO, © OpenStreetMap, Microsoft, Esri, HERE, Garmin, SafeGraph, GeoTechnologies, Inc, METI/NASA, USGS, Bureau of Land Management, EPA, NPS, US Census Bureau, USDA | Esri
ickiup Av SW 49th St t h C t ewWay SW Wick ve S W 4 4 t h S t Acct # 130245 Stormwater Aerial Esri Community Maps Contributors, Oregon State Parks, State of Oregon GEO, © OpenStreetMap, Microsoft, Esri, HERE, Garmin, SafeGraph, DETENTION BASINS INFILTRATION BASIN POND SWALE STORM PIPE ACCESS POINTS CLEANOUT MANHOLE OTHER SEDIMENTATION MANHOLE VAULT STORM UIC FACILITIES DRILL HOLE DRYWELL FRENCH DRAIN 9/26/2023, 3:26:40 PM 0 0.06 0.11 0.03 mi 0 0.09 0.17 0.04 km 1:4,514 Web AppBuilder for ArcGIS Esri Community Maps Contributors, Oregon State Parks, State of Oregon GEO, © OpenStreetMap, Microsoft, Esri, HERE, Garmin, SafeGraph, GeoTechnologies, Inc, METI/NASA, USGS, Bureau of Land Management, EPA, NPS, US Census Bureau, USDA | Esri
SW S W d S W 4 7 t h S t WVolcano Volcano Av Acct # 130245 Stormwater No Aerial Esri Community Maps Contributors, Oregon State Parks, State of Oregon GEO, © OpenStreetMap, Microsoft, Esri, HERE, Garmin, SafeGraph, DETENTION BASINS INFILTRATION BASIN POND SWALE STORM PIPE ACCESS POINTS CLEANOUT MANHOLE OTHER SEDIMENTATION MANHOLE VAULT STORM UIC FACILITIES DRILL HOLE DRYWELL FRENCH DRAIN 9/26/2023, 4:50:44 PM 0 0.06 0.11 0.03 mi 0 0.09 0.17 0.04 km 1:4,514 Web AppBuilder for ArcGIS Esri Community Maps Contributors, Oregon State Parks, State of Oregon GEO, © OpenStreetMap, Microsoft, Esri, HERE, Garmin, SafeGraph, GeoTechnologies, Inc, METI/NASA, USGS, Bureau of Land Management, EPA, NPS, US Census Bureau, USDA | Esri
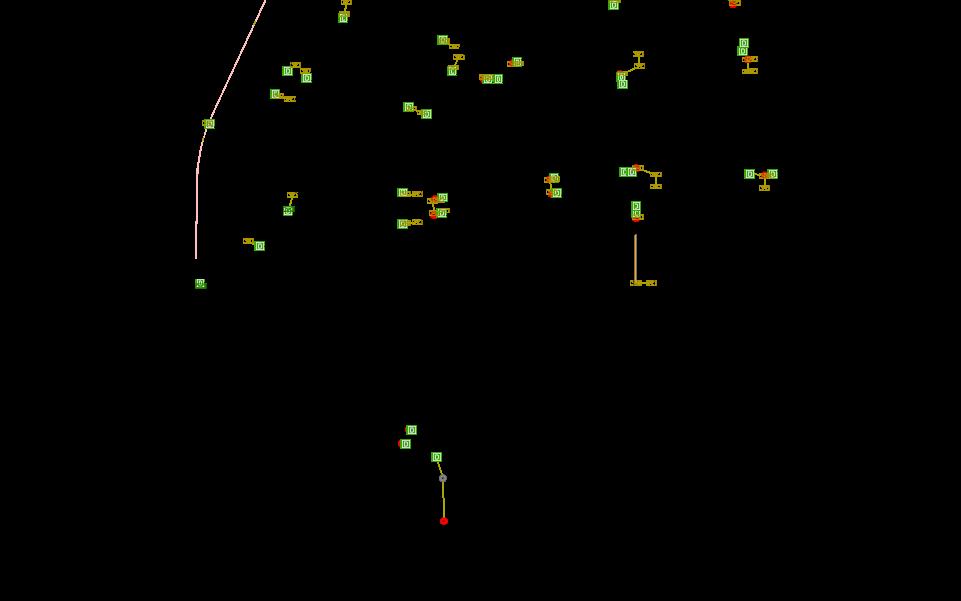
ickiup Av SW 49th St t h C t ewWay SW Wick ve S W 4 4 t h S t Acct # 130245 Natural Gas Aerial Esri Community Maps Contributors, Oregon State Parks, State of Oregon GEO, © OpenStreetMap, Microsoft, Esri, HERE, Garmin, SafeGraph, NATURAL GAS REDMOND TAXLOTS 9/26/2023, 3:28:52 PM 0 0.06 0.11 0.03 mi 0 0.09 0.17 0.04 km 1:4,514 Web AppBuilder for ArcGIS Esri Community Maps Contributors, Oregon State Parks, State of Oregon GEO, © OpenStreetMap, Microsoft, Esri, HERE, Garmin, SafeGraph, GeoTechnologies, Inc, METI/NASA, USGS, Bureau of Land Management, EPA, NPS, US Census Bureau, USDA | Esri
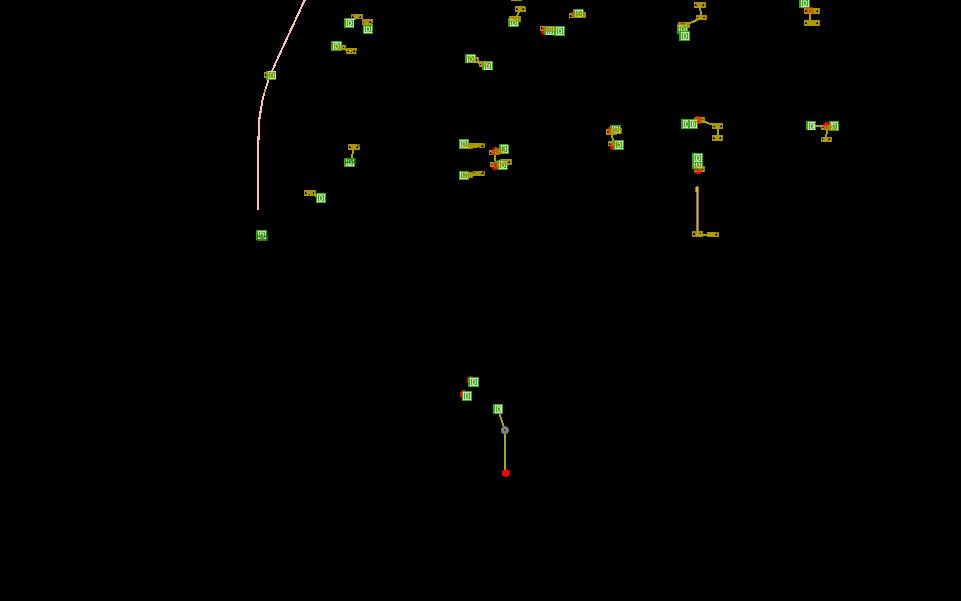
ickiup Ave SW 49th St 6 t h C t ewWay SW Wick Ave S W 4 4 t h S t Acct # 130245 Natural Gas No Aerial Esri Community Maps Contributors, Oregon State Parks, State of Oregon GEO, © OpenStreetMap, Microsoft, Esri, HERE, Garmin, SafeGraph, NATURAL GAS REDMOND TAXLOTS 9/26/2023, 3:29:21 PM 0 0.06 0.11 0.03 mi 0 0.09 0.17 0.04 km 1:4,514 Web AppBuilder for ArcGIS Esri Community Maps Contributors, Oregon State Parks, State of Oregon GEO, © OpenStreetMap, Microsoft, Esri, HERE, Garmin, SafeGraph, GeoTechnologies, Inc, METI/NASA, USGS, Bureau of Land Management, EPA, NPS, US Census Bureau, USDA | Esri
Site Details Map
City: Redmond County: Deschutes County
State: Oregon
ZIP Code: 97756
Census Tract: 41017001005
Census Block Group: 410170010051
CBSA: Bend, OR Metropolitan Statistical Area

Bureau of Land Management, State of Oregon GEO, State of Oregon, Esri, HERE, Garmin, INCREMENT P, NGA, USGS, U.S. Forest Service 0 0.8 1.6 mi
4807 SW Xero Ave, Redmond, Oregon, 97756 Prepared by Esri Ring bands: 0-1, 1-3, 3-5 mile radii Latitude: 44.24624 Longitude: -121.22678
This site is located in:
September 26, 2023 ©2023 Esri Page 1 of 1
ACS Population Summary

4807 SW Xero Ave, Redmond, Oregon, 97756 Prepared by Esri Ring band: 0 - 1 mile radius Latitude: 44.24624 Longitude: -121.22678 2017-2021 ACS Estimate Percent MOE(±) Reliability TOTALS Total Population 3,122 377 Total Households 1,268 216 Total Housing Units 1,288 218 POPULATION AGE 3+ YEARS BY SCHOOL ENROLLMENT Total 3,054 100.0% 375 Enrolled in school 529 17 3% 167 Enrolled in nursery school, preschool 31 1.0% 95 Public school 18 0.6% 65 Private school 14 0.5% 67 Enrolled in kindergarten 6 0.2% 29 Public school 6 0.2% 29 Private school 0 0.0% 0 Enrolled in grade 1 to grade 4 88 2.9% 59 Public school 81 2.7% 56 Private school 7 0 2% 33 Enrolled in grade 5 to grade 8 207 6.8% 116 Public school 207 6 8% 116 Private school 0 0.0% 0 Enrolled in grade 9 to grade 12 103 3 4% 189 Public school 103 3.4% 189 Private school 0 0 0% 0 Enrolled in college undergraduate years 86 2.8% 81 Public school 86 2.8% 81 Private school 0 0.0% 0 Enrolled in graduate or professional school 8 0 3% 23 Public school 0 0.0% 0 Private school 8 0 3% 23 Not enrolled in school 2,525 82.7% 297 POPULATION AGE 65+ BY RELATIONSHIP AND HOUSEHOLD TYPE Total 834 100.0% 354 Living in Households 803 96 3% 346 Living in Family Households 598 71.7% 222 Householder 345 41 4% 140 Spouse 214 25 7% 114 Parent 0 0.0% 0 Parent-in-law 0 0 0% 0 Other Relative 29 3.5% 40 Nonrelative 11 1.3% 57 Living in Nonfamily Households 205 24 6% 304 Householder 199 23.9% 302 Nonrelative 6 0.7% 18 Living in Group Quarters 31 3 7% 68 Source: U.S. Census Bureau, 2017-2021 American Community Survey Reliability: high medium low September 26, 2023 ©2023 Esri Page 1 of 24
ACS Population Summary
4807 SW Xero Ave, Redmond, Oregon, 97756 Prepared by Esri Ring band: 0 - 1 mile radius Latitude: 44.24624 Longitude: -121.22678 2017-2021 ACS Estimate Percent MOE(±) Reliability HOUSEHOLDS BY TYPE AND SIZE Family Households 878 69 2% 137 2-Person 471 37.1% 131 3-Person 308 24 3% 137 4-Person 58 4.6% 49 5-Person 19 1.5% 64 6-Person 8 0.6% 41 7+ Person 14 1.1% 52 Nonfamily Households 390 30 8% 295 1-Person 295 23 3% 328 2-Person 80 6.3% 79 3-Person 15 1.2% 74 4-Person 0 0.0% 0 5-Person 0 0.0% 0 6-Person 0 0.0% 0 7+ Person 0 0.0% 0 HOUSEHOLDS BY PRESENCE OF PEOPLE UNDER 18 YEARS BY HOUSEHOLD TYPE Households with one or more people under 18 years 332 26.2% 101 Family households 332 26.2% 101 Married-couple family 205 16.2% 93 Male householder, no wife present 105 8.3% 85 Female householder, no husband present 23 1.8% 56 Nonfamily households 0 0.0% 0 Households with no people under 18 years 936 73.8% 251 Married-couple family 444 35.0% 121 Other family 102 8.0% 116 Nonfamily households 390 30.8% 295 HOUSEHOLDS BY PRESENCE OF PEOPLE 65 YEARS AND OVER, HOUSEHOLD SIZE AND HOUSEHOLD TYPE Households with Pop 65+ 490 38.6% 295 1-Person 170 13.4% 302 2+ Person Family 317 25.0% 133 2+ Person Nonfamily 3 0.2% 8 Households with No Pop 65+ 778 61.4% 156 1-Person 125 9.9% 166 2+ Person Family 562 44.3% 161 2+ Person Nonfamily 92 7.3% 93 HOUSEHOLD TYPE BY RELATIVES AND NONRELATIVES FOR POPULATION IN HOUSEHOLDS POPULATION IN HOUSEHOLDS Total 3,076 100.0% 374 In Family Households 2,526 82 1% 364 In Married-Couple Family 1,900 61 8% 338 Relatives 1,840 59 8% 346 Nonrelatives 60 2.0% 237 In Male Householder-No Spouse Present-Family 316 10 3% 204 Relatives 281 9 1% 214 Nonrelatives 36 1.2% 117 In Female Householder-No Spouse Present-Family 309 10 0% 259 Relatives 309 10.0% 259 Nonrelatives 0 0.0% 0 In Nonfamily Households 551 17 9% 313 Source: U.S. Census Bureau, 2017-2021 American Community Survey Reliability: high medium low September 26, 2023 ©2023 Esri Page 2 of 24
ACS Population Summary
4807 SW Xero Ave, Redmond, Oregon, 97756 Prepared by Esri Ring band: 0 - 1 mile radius Latitude: 44.24624 Longitude: -121.22678 2017-2021 ACS Estimate Percent MOE(±) Reliability POPULATION AGE 5+ YEARS BY LANGUAGE SPOKEN AT HOME AND ABILITY TO SPEAK ENGLISH Total 3,033 100.0% 370 5 to 17 years Speak only English 431 14 2% 109 Speak Spanish 10 0.3% 47 Speak English "very well" or "well" 10 0.3% 47 Speak English "not well" 0 0.0% 0 Speak English "not at all" 0 0 0% 0 Speak other Indo-European languages 0 0.0% 0 Speak English "very well" or "well" 0 0.0% 0 Speak English "not well" 0 0.0% 0 Speak English "not at all" 0 0 0% 0 Speak Asian and Pacific Island languages 0 0.0% 0 Speak English "very well" or "well" 0 0.0% 0 Speak English "not well" 0 0.0% 0 Speak English "not at all" 0 0 0% 0 Speak other languages 0 0.0% 0 Speak English "very well" or "well" 0 0.0% 0 Speak English "not well" 0 0.0% 0 Speak English "not at all" 0 0 0% 0 18 to 64 years Speak only English 1,699 56.0% 329 Speak Spanish 59 1.9% 88 Speak English "very well" or "well" 27 0.9% 134 Speak English "not well" 32 1.1% 112 Speak English "not at all" 0 0 0% 0 Speak other Indo-European languages 0 0.0% 0 Speak English "very well" or "well" 0 0.0% 0 Speak English "not well" 0 0.0% 0 Speak English "not at all" 0 0 0% 0 Speak Asian and Pacific Island languages 0 0.0% 0 Speak English "very well" or "well" 0 0.0% 0 Speak English "not well" 0 0.0% 0 Speak English "not at all" 0 0 0% 0 Speak other languages 0 0.0% 0 Speak English "very well" or "well" 0 0.0% 0 Speak English "not well" 0 0.0% 0 Speak English "not at all" 0 0 0% 0 65 years and over Speak only English 750 24 7% 358 Speak Spanish 46 1.5% 113 Speak English "very well" or "well" 46 1.5% 113 Speak English "not well" 0 0.0% 0 Speak English "not at all" 0 0 0% 0 Speak other Indo-European languages 0 0.0% 0 Speak English "very well" or "well" 0 0.0% 0 Speak English "not well" 0 0.0% 0 Speak English "not at all" 0 0 0% 0 Speak Asian and Pacific Island languages 38 1.3% 55 Speak English "very well" or "well" 28 0.9% 75 Speak English "not well" 11 0.4% 37 Speak English "not at all" 0 0 0% 0 Speak other languages 0 0.0% 0 Speak English "very well" or "well" 0 0.0% 0 Speak English "not well" 0 0.0% 0 Speak English "not at all" 0 0 0% 0 Source: U.S. Census Bureau, 2017-2021 American Community Survey Reliability: high medium low September 26, 2023 ©2023 Esri Page 3 of 24
4807 SW Xero Ave, Redmond, Oregon, 97756 Prepared by Esri Ring band: 0 - 1 mile radius Latitude: 44.24624 Longitude: -121.22678 2017-2021 ACS Estimate Percent MOE(±) Reliability WORKERS AGE 16+ YEARS BY PLACE OF WORK Total 1,493 100.0% 287 Worked in state and in county of residence 1,371 91.8% 280 Worked in state and outside county of residence 77 5 2% 78 Worked outside state of residence 44 2.9% 49 SEX BY CLASS OF WORKER FOR THE CIVILIAN EMPLOYED POPULATION 16 YEARS AND OVER Total: 1,512 100.0% 287 Male: 792 52 4% 141 Employee of private company workers 553 36 6% 125 Self-employed in own incorporated business workers 137 9.1% 123 Private not-for-profit wage and salary workers 36 2.4% 100 Local government workers 5 0.3% 12 State government workers 19 1.3% 57 Federal government workers 0 0.0% 0 Self-employed in own not incorporated business workers 42 2.8% 179 Unpaid family workers 0 0.0% 0 Female: 720 47 6% 217 Employee of private company workers 488 32 3% 219 Self-employed in own incorporated business workers 23 1.5% 63 Private not-for-profit wage and salary workers 35 2.3% 26 Local government workers 123 8.1% 103 State government workers 0 0.0% 0 Federal government workers 0 0.0% 0 Self-employed in own not incorporated business workers 52 3.4% 78 Unpaid family workers 0 0 0% 0 POPULATION IN HOUSEHOLDS AND PRESENCE OF A COMPUTER Total 3,076 100.0% 374 Population <18 in Households 530 17 2% 123 Have a Computer 530 17 2% 143 Have NO Computer 0 0.0% 0 Population 18-64 in Households 1,743 56 7% 333 Have a Computer 1,709 55 6% 338 Have NO Computer 35 1 1% 92 Population 65+ in Households 803 26 1% 346 Have a Computer 636 20.7% 221 Have NO Computer 167 5 4% 323 HOUSEHOLDS AND INTERNET SUBSCRIPTIONS Total 1,268 100.0% 216 With an Internet Subscription 1,114 87.9% 144 Dial-Up Alone 3 0 2% 8 Broadband 998 78 7% 150 Satellite Service 59 4 7% 46 Other Service 0 0 0% 0 Internet Access with no Subscription 23 1.8% 51 With No Internet Access 131 10 3% 269 Source: U.S. Census Bureau, 2017-2021 American Community Survey Reliability: high medium low September 26, 2023 ©2023 Esri Page 4 of 24
ACS Population Summary
ACS Population Summary
4807 SW Xero Ave, Redmond, Oregon, 97756 Prepared by Esri Ring band: 0 - 1 mile radius Latitude: 44.24624 Longitude: -121.22678 2017-2021 ACS Estimate Percent MOE(±) Reliability WORKERS AGE 16+ YEARS BY MEANS OF TRANSPORTATION TO WORK Total 1,493 100.0% 287 Drove alone 1,074 71 9% 257 Carpooled 63 4.2% 82 Public transportation (excluding taxicab) 16 1.1% 76 Bus or trolley bus 16 1.1% 76 Light rail, streetcar or trolley 0 0.0% 0 Subway or elevated 0 0.0% 0 Long-distance/Commuter Train 0 0.0% 0 Ferryboat 0 0.0% 0 Taxicab 12 0.8% 72 Motorcycle 47 3.1% 119 Bicycle 69 4.6% 164 Walked 26 1.7% 91 Other means 4 0.3% 13 Worked at home 182 12 2% 117
BY TRAVEL TIME TO WORK Total 1,311 100.0% 249 Less than 5 minutes 157 12 0% 142 5 to 9 minutes 191 14.6% 117 10 to 14 minutes 270 20 6% 113 15 to 19 minutes 81 6 2% 65 20 to 24 minutes 271 20 7% 150 25 to 29 minutes 210 16 0% 109 30 to 34 minutes 43 3.3% 39 35 to 39 minutes 11 0 8% 28 40 to 44 minutes 41 3.1% 57 45 to 59 minutes 15 1 1% 42 60 to 89 minutes 10 0.8% 49 90 or more minutes 11 0 8% 56 Average Travel Time to Work (in minutes) N/A N/A
AGE 20-64 YEARS BY AGE OF OWN CHILDREN AND EMPLOYMENT STATUS Total 790 100.0% 263 Own children under 6 years only 74 9.4% 78 In labor force 74 9.4% 78 Not in labor force 0 0.0% 0 Own children under 6 years and 6 to 17 years 58 7 3% 169 In labor force 44 5.6% 161 Not in labor force 14 1.8% 50 Own children 6 to 17 years only 133 16.8% 68 In labor force 102 12 9% 77 Not in labor force 32 4.1% 80 No own children under 18 years 525 66 5% 261 In labor force 409 51.8% 250 Not in labor force 115 14 6% 90 Source: U.S. Census Bureau, 2017-2021 American Community Survey Reliability: high medium low September 26, 2023 ©2023 Esri Page 5 of 24
WORKERS AGE 16+ YEARS (WHO DID NOT WORK FROM HOME)
FEMALES
4807 SW Xero Ave, Redmond, Oregon, 97756 Prepared by Esri Ring band: 0 - 1 mile radius Latitude: 44.24624 Longitude: -121.22678 2017-2021 ACS Estimate Percent MOE(±) Reliability CIVILIAN NONINSTITUTIONALIZED POPULATION BY AGE & TYPES OHEALINSURANCE COVERAGE OF HEALTH INSURANCE COVERAGE Total 3,122 100.0% 377 Under 19 years: 641 20 5% 158 One Type of Health Insurance: 504 16 1% 139 Employer-Based Health Ins Only 279 8.9% 184 Direct-Purchase Health Ins Only 80 2 6% 84 Medicare Coverage Only 0 0.0% 0 Medicaid Coverage Only 145 4 6% 148 TRICARE/Military Hlth Cov Only 0 0.0% 0 VA Health Care Only 0 0.0% 0 2+ Types of Health Insurance 123 3.9% 106 No Health Insurance Coverage 14 0.4% 55 19 to 34 years: 431 13.8% 231 One Type of Health Insurance: 387 12.4% 211 Employer-Based Health Ins Only 287 9.2% 163 Direct-Purchase Health Ins Only 29 0.9% 58 Medicare Coverage Only 0 0.0% 0 Medicaid Coverage Only 59 1 9% 216 TRICARE/Military Hlth Cov Only 11 0.4% 46 VA Health Care Only 0 0 0% 0 2+ Types of Health Insurance 43 1.4% 57 No Health Insurance Coverage 0 0 0% 0 35 to 64 years: 1,215 38 9% 252 One Type of Health Insurance: 898 28 8% 184 Employer-Based Health Ins Only 676 21 7% 183 Direct-Purchase Health Ins Only 98 3.1% 93 Medicare Coverage Only 0 0.0% 0 Medicaid Coverage Only 117 3 7% 106 TRICARE/Military Hlth Cov Only 8 0.3% 45 VA Health Care Only 0 0 0% 0 2+ Types of Health Insurance 197 6.3% 141 No Health Insurance Coverage 120 3.8% 122 65+ years: 834 26.7% 354 One Type of Health Insurance: 481 15.4% 347 Employer-Based Health Ins Only 14 0.4% 38 Direct-Purchase Health Ins Only 0 0.0% 0 Medicare Coverage Only 467 15 0% 345 TRICARE/Military Hlth Cov Only 0 0 0% 0 VA Health Care Only 0 0.0% 0 2+ Types of Health Insurance: 353 11 3% 148 Employer-Based & Direct-Purchase Health Insurance 0 0.0% 0 Employer-Based Health & Medicare Insurance 63 2.0% 123 Direct-Purchase Health & Medicare Insurance 105 3.4% 96 Medicare & Medicaid Coverage 30 1.0% 36 Other Private Health Insurance Combos 0 0.0% 0 Other Public Health Insurance Combos 17 0.5% 40 Other Health Insurance Combinations 139 4.5% 101 No Health Insurance Coverage 0 0.0% 0 Source: U.S. Census Bureau, 2017-2021 American Community Survey Reliability: high medium low September 26, 2023 ©2023 Esri Page 6 of 24
ACS Population Summary
ACS Population Summary
4807 SW Xero Ave, Redmond, Oregon, 97756 Prepared by Esri Ring band: 0 - 1 mile radius
44.24624 Longitude: -121.22678 2017-2021
BY RATIO OF INCOME TO POVERTY LEVEL
CIVILIAN POPULATION AGE 18 OR OLDER BY VETERAN STATUS
CIVILIAN VETERANS AGE 18 OR OLDER BY PERIOD OF MILITARY SERVICE
ACS Estimate Percent MOE(±) Reliability POPULATION
Total 3,070 100.0% 380 Under 50 71 2.3% 49 50 to 99 192 6 3% 219 1 00 to 1 24 197 6.4% 275 1 25 to 1 49 106 3 5% 283 1 50 to 1 84 71 2.3% 99 1 85 to 1 99 8 0 3% 41 2 00 and over 2,425 79 0% 378
Latitude:
Total 2,592 100.0% 347 Veteran 261 10.1% 124 Nonveteran 2,331 89.9% 336 Male 1,188 45 8% 137 Veteran 244 9 4% 129 Nonveteran 944 36 4% 138 Female 1,404 54 2% 279 Veteran 17 0.7% 83 Nonveteran 1,387 53 5% 278
Total 261 100.0% 124 Gulf War (9/01 or later), no Gulf War (8/90 to 8/01), no Vietnam Era 50 19 2% 61 Gulf War (9/01 or later) and Gulf War (8/90 to 8/01), no Vietnam Era 0 0.0% 0 Gulf War (9/01 or later), and Gulf War (8/90 to 8/01), and Vietnam Era 0 0.0% 0 Gulf War (8/90 to 8/01), no Vietnam Era 0 0.0% 0 Gulf War (8/90 to 8/01) and Vietnam Era 0 0.0% 0 Vietnam Era, no Korean War, no World War II 152 58 2% 102 Vietnam Era and Korean War, no World War II 0 0.0% 0 Vietnam Era and Korean War and World War II 0 0.0% 0 Korean War, no Vietnam Era, no World War II 14 5.4% 37 Korean War and World War II, no Vietnam Era 0 0 0% 0 World War II, no Korean War, no Vietnam Era 11 4.2% 56 Between Gulf War and Vietnam Era only 5 1.9% 8 Between Vietnam Era and Korean War only 29 11 1% 56 Between Korean War and World War II only 0 0.0% 0 Pre-World War II only 0 0.0% 0 HOUSEHOLDS BY POVERTY STATUS Total 1,268 100.0% 216 Income in the past 12 months below poverty level 69 5.4% 58 Married-couple family 12 0.9% 40 Other family - male householder (no wife present) 39 3.1% 93 Other family - female householder (no husband present) 7 0 6% 23 Nonfamily household - male householder 0 0.0% 0 Nonfamily household - female householder 11 0.9% 33 Income in the past 12 months at or above poverty level 1,199 94 6% 224 Married-couple family 636 50 2% 123 Other family - male householder (no wife present) 77 6.1% 84 Other family - female householder (no husband present) 107 8.4% 110 Nonfamily household - male householder 151 11.9% 130 Nonfamily household - female householder 228 18 0% 275 Poverty Index 44 Source: U.S. Census Bureau, 2017-2021 American Community Survey Reliability: high medium low September 26, 2023 ©2023 Esri Page 7 of 24
ACS Population Summary
Data Note: N/A means not available Population by Ratio of Income to Poverty Level represents persons for whom poverty status is determined. Household income represents income in 2021, adjusted for inflation
2017-2021 ACS Estimate: The American Community Survey (ACS) replaces census sample data. Esri is releasing the 2017-2021 ACS estimates, five-year period data collected monthly from January 1, 2017 through December 31, 2021. Although the ACS includes many of the subjects previously covered by the decennial census sample, there are significant differences between the two surveys including fundamental differences in survey design and residency rules
Margin of error (MOE): The MOE is a measure of the variability of the estimate due to sampling error. MOEs enable the data user to measure the range of uncertainty for each estimate with 90 percent confidence. The range of uncertainty is called the confidence interval, and it is calculated by taking the estimate +/- the MOE. For example, if the ACS reports an estimate of 100 with an MOE of +/- 20, then you can be 90 percent certain the value for the whole population falls between 80 and 120.
Reliability: These symbols represent threshold values that Esri has established from the Coefficients of Variation (CV) to designate the usability of the estimates. The CV measures the amount of sampling error relative to the size of the estimate, expressed as a percentage
High Reliability: Small CVs (less than or equal to 12 percent) are flagged green to indicate that the sampling error is small relative to the estimate and the estimate is reasonably reliable.
Medium Reliability: Estimates with CVs between 12 and 40 are flagged yellow-use with caution.
Low Reliability: Large CVs (over 40 percent) are flagged red to indicate that the sampling error is large relative to the estimate. The estimate is considered very unreliable.
Source: U.S. Census Bureau, 2017-2021 American Community Survey Reliability: high medium low
4807 SW Xero Ave, Redmond, Oregon, 97756 Prepared by Esri Ring band: 0 - 1 mile radius Latitude: 44.24624 Longitude: -121.22678 2017-2021 ACS Estimate Percent MOE(±) Reliability HOUSEHOLDS BY OTHER INCOME Social Security Income 557 43 9% 269 No Social Security Income 711 56.1% 137 Retirement Income 253 20 0% 126 No Retirement Income 1,015 80 0% 209 GROSS RENT AS A PERCENTAGE OF HOUSEHOLD INCOME IN THE PAST 12 MONTHS <10% of Income 0 0.0% 0 10-14 9% of Income 41 10 8% 182 15-19 9% of Income 10 2 6% 51 20-24 9% of Income 37 9.8% 99 25-29.9% of Income 22 5.8% 108 30-34 9% of Income 0 0.0% 0 35-39 9% of Income 14 3 7% 52 40-49 9% of Income 87 23 0% 90 50+% of Income 159 42 1% 312 Gross Rent % Inc Not Computed 7 1.9% 23 HOUSEHOLDS BY PUBLIC ASSISTANCE INCOME IN THE PAST 12 MONTHS Total 1,268 100.0% 216 With public assistance income 16 1.3% 49 No public assistance income 1,252 98.7% 211 HOUSEHOLDS BY FOOD STAMPS/SNAP STATUS Total 1,268 100.0% 216 With Food Stamps/SNAP 132 10.4% 71 With No Food Stamps/SNAP 1,137 89.7% 230 HOUSEHOLDS BY DISABILITY STATUS Total 1,268 100.0% 216 With 1+ Persons w/Disability 473 37.3% 231 With No Person w/Disability 795 62.7% 156
September 26, 2023 ©2023 Esri Page 8 of 24
ACS Population Summary
4807 SW Xero Ave, Redmond, Oregon, 97756 Prepared by Esri Ring band: 1 - 3 mile radius Latitude: 44.24624 Longitude: -121.22678 2017-2021 ACS Estimate Percent MOE(±) Reliability TOTALS Total Population 22,526 1,430 Total Households 8,713 485 Total Housing Units 9,035 485 POPULATION AGE 3+ YEARS BY SCHOOL ENROLLMENT Total 21,603 100.0% 1,416 Enrolled in school 4,714 21 8% 618 Enrolled in nursery school, preschool 302 1 4% 190 Public school 177 0.8% 151 Private school 125 0 6% 114 Enrolled in kindergarten 243 1.1% 175 Public school 219 1 0% 175 Private school 24 0.1% 23 Enrolled in grade 1 to grade 4 1,249 5.8% 328 Public school 845 3.9% 304 Private school 405 1 9% 206 Enrolled in grade 5 to grade 8 1,258 5.8% 293 Public school 1,165 5 4% 274 Private school 94 0.4% 98 Enrolled in grade 9 to grade 12 1,100 5 1% 286 Public school 1,035 4.8% 277 Private school 65 0.3% 71 Enrolled in college undergraduate years 497 2.3% 133 Public school 428 2.0% 112 Private school 69 0.3% 73 Enrolled in graduate or professional school 64 0 3% 56 Public school 14 0.1% 22 Private school 50 0.2% 51 Not enrolled in school 16,889 78.2% 778 POPULATION AGE 65+ BY RELATIONSHIP AND HOUSEHOLD TYPE Total 3,204 100.0% 278 Living in Households 3,127 97 6% 276 Living in Family Households 2,088 65 2% 247 Householder 1,141 35 6% 145 Spouse 818 25 5% 129 Parent 10 0.3% 13 Parent-in-law 17 0.5% 35 Other Relative 61 1.9% 49 Nonrelative 40 1.2% 44 Living in Nonfamily Households 1,039 32 4% 147 Householder 975 30.4% 143 Nonrelative 64 2.0% 45 Living in Group Quarters 77 2 4% 39 Source: U.S. Census Bureau, 2017-2021 American Community Survey Reliability: high medium low September 26, 2023 ©2023 Esri Page 9 of 24
ACS Population Summary
HOUSEHOLDS BY PRESENCE OF PEOPLE 65 YEARS AND OVER,
4807 SW Xero Ave, Redmond, Oregon, 97756 Prepared by Esri Ring band: 1 - 3 mile radius Latitude: 44.24624 Longitude: -121.22678 2017-2021 ACS Estimate Percent MOE(±) Reliability HOUSEHOLDS BY TYPE AND SIZE Family Households 5,546 63 7% 427 2-Person 2,157 24.8% 242 3-Person 1,528 17 5% 226 4-Person 1,020 11 7% 341 5-Person 419 4 8% 142 6-Person 332 3.8% 120 7+ Person 91 1.0% 53 Nonfamily Households 3,167 36 3% 364 1-Person 2,157 24 8% 280 2-Person 771 8.8% 273 3-Person 173 2 0% 83 4-Person 65 0.7% 50 5-Person 0 0.0% 0 6-Person 0 0.0% 0 7+ Person 0 0.0% 0 HOUSEHOLDS BY PRESENCE OF PEOPLE UNDER 18 YEARS BY HOUSEHOLD TYPE Households with one or more people under 18 years 2,991 34.3% 388 Family households 2,946 33.8% 388 Married-couple family 2,000 23.0% 360 Male householder, no wife present 335 3.8% 101 Female householder, no husband present 611 7.0% 233 Nonfamily households 45 0.5% 51 Households with no people under 18 years 5,722 65.7% 375 Married-couple family 2,110 24.2% 178 Other family 490 5.6% 138 Nonfamily households 3,122 35.8% 364
SIZE AND HOUSEHOLD TYPE Households with Pop 65+ 2,433 27.9% 198 1-Person 910 10.4% 145 2+ Person Family 1,411 16.2% 153 2+ Person Nonfamily 112 1.3% 47 Households with No Pop 65+ 6,280 72.1% 492 1-Person 1,247 14.3% 258 2+ Person Family 4,136 47.5% 416 2+ Person Nonfamily 897 10.3% 281 HOUSEHOLD TYPE BY RELATIVES AND NONRELATIVES FOR POPULATION IN HOUSEHOLDS POPULATION IN HOUSEHOLDS Total 22,408 100.0% 1,430 In Family Households 17,873 79 8% 1,399 In Married-Couple Family 13,613 60 8% 1,387 Relatives 13,421 59 9% 1,375 Nonrelatives 192 0.9% 112 In Male Householder-No Spouse Present-Family 1,527 6.8% 459 Relatives 1,036 4 6% 289 Nonrelatives 491 2.2% 220 In Female Householder-No Spouse Present-Family 2,733 12 2% 622 Relatives 2,414 10.8% 574 Nonrelatives 319 1 4% 212 In Nonfamily Households 4,535 20 2% 648 Source: U.S. Census Bureau, 2017-2021 American Community Survey Reliability: high medium low September 26, 2023 ©2023 Esri Page 10 of 24
HOUSEHOLD
ACS Population Summary
4807 SW Xero Ave, Redmond, Oregon, 97756 Prepared by Esri Ring band: 1 - 3 mile radius Latitude: 44.24624 Longitude: -121.22678 2017-2021 ACS Estimate Percent MOE(±) Reliability POPULATION AGE 5+ YEARS BY LANGUAGE SPOKEN AT HOME AND ABILITY TO SPEAK ENGLISH Total 21,215 100.0% 1,417 5 to 17 years Speak only English 3,363 15 9% 572 Speak Spanish 743 3.5% 385 Speak English "very well" or "well" 704 3.3% 385 Speak English "not well" 39 0.2% 48 Speak English "not at all" 0 0 0% 0 Speak other Indo-European languages 3 0.0% 9 Speak English "very well" or "well" 3 0.0% 9 Speak English "not well" 0 0.0% 0 Speak English "not at all" 0 0 0% 0 Speak Asian and Pacific Island languages 19 0.1% 35 Speak English "very well" or "well" 0 0.0% 0 Speak English "not well" 19 0.1% 35 Speak English "not at all" 0 0 0% 0 Speak other languages 0 0.0% 0 Speak English "very well" or "well" 0 0.0% 0 Speak English "not well" 0 0.0% 0 Speak English "not at all" 0 0 0% 0 18 to 64 years Speak only English 12,108 57.1% 911 Speak Spanish 1,528 7.2% 405 Speak English "very well" or "well" 1,026 4 8% 384 Speak English "not well" 410 1.9% 248 Speak English "not at all" 93 0 4% 121 Speak other Indo-European languages 153 0.7% 138 Speak English "very well" or "well" 153 0 7% 137 Speak English "not well" 0 0.0% 0 Speak English "not at all" 0 0 0% 0 Speak Asian and Pacific Island languages 96 0.5% 69 Speak English "very well" or "well" 80 0.4% 60 Speak English "not well" 16 0.1% 26 Speak English "not at all" 0 0 0% 0 Speak other languages 0 0.0% 0 Speak English "very well" or "well" 0 0.0% 0 Speak English "not well" 0 0.0% 0 Speak English "not at all" 0 0 0% 0 65 years and over Speak only English 2,950 13 9% 275 Speak Spanish 46 0.2% 76 Speak English "very well" or "well" 33 0.2% 106 Speak English "not well" 5 0.0% 17 Speak English "not at all" 8 0 0% 72 Speak other Indo-European languages 169 0.8% 203 Speak English "very well" or "well" 169 0 8% 209 Speak English "not well" 0 0.0% 0 Speak English "not at all" 0 0 0% 0 Speak Asian and Pacific Island languages 39 0.2% 40 Speak English "very well" or "well" 25 0.1% 55 Speak English "not well" 13 0.1% 36 Speak English "not at all" 0 0 0% 0 Speak other languages 0 0.0% 0 Speak English "very well" or "well" 0 0.0% 0 Speak English "not well" 0 0.0% 0 Speak English "not at all" 0 0 0% 0 Source: U.S. Census Bureau, 2017-2021 American Community Survey Reliability: high medium low September 26, 2023 ©2023 Esri Page 11 of 24
4807 SW Xero Ave, Redmond, Oregon, 97756 Prepared by Esri Ring band: 1 - 3 mile radius Latitude: 44.24624 Longitude: -121.22678 2017-2021 ACS Estimate Percent MOE(±) Reliability WORKERS AGE 16+ YEARS BY PLACE OF WORK Total 11,139 100.0% 948 Worked in state and in county of residence 10,195 91.5% 941 Worked in state and outside county of residence 847 7 6% 200 Worked outside state of residence 98 0.9% 51 SEX BY CLASS OF WORKER FOR THE CIVILIAN EMPLOYED POPULATION 16 YEARS AND OVER Total: 11,358 100.0% 939 Male: 5,943 52 3% 565 Employee of private company workers 4,231 37 3% 533 Self-employed in own incorporated business workers 361 3.2% 121 Private not-for-profit wage and salary workers 217 1.9% 102 Local government workers 89 0.8% 60 State government workers 151 1 3% 94 Federal government workers 156 1.4% 68 Self-employed in own not incorporated business workers 738 6 5% 197 Unpaid family workers 0 0.0% 0 Female: 5,415 47 7% 499 Employee of private company workers 3,456 30 4% 459 Self-employed in own incorporated business workers 290 2 6% 56 Private not-for-profit wage and salary workers 620 5.5% 216 Local government workers 554 4.9% 151 State government workers 88 0.8% 101 Federal government workers 55 0.5% 69 Self-employed in own not incorporated business workers 349 3.1% 85 Unpaid family workers 2 0 0% 18 POPULATION IN HOUSEHOLDS AND PRESENCE OF A COMPUTER Total 22,408 100.0% 1,430 Population <18 in Households 5,437 24 3% 623 Have a Computer 5,324 23 8% 621 Have NO Computer 113 0.5% 147 Population 18-64 in Households 13,844 61 8% 972 Have a Computer 13,629 60 8% 983 Have NO Computer 214 1.0% 140 Population 65+ in Households 3,127 14 0% 276 Have a Computer 2,871 12.8% 262 Have NO Computer 256 1 1% 167 HOUSEHOLDS AND INTERNET SUBSCRIPTIONS Total 8,713 100.0% 485 With an Internet Subscription 8,121 93.2% 494 Dial-Up Alone 59 0 7% 44 Broadband 6,535 75 0% 477 Satellite Service 954 10 9% 179 Other Service 48 0 6% 31 Internet Access with no Subscription 48 0.6% 31 With No Internet Access 544 6 2% 140 Source: U.S. Census Bureau, 2017-2021 American Community Survey Reliability: high medium low September 26, 2023 ©2023 Esri Page 12 of 24
ACS Population Summary
ACS Population Summary
WORKERS AGE 16+ YEARS (WHO DID NOT WORK FROM HOME)
FEMALES
4807 SW Xero Ave, Redmond, Oregon, 97756 Prepared by Esri Ring band: 1 - 3 mile radius Latitude: 44.24624 Longitude: -121.22678 2017-2021 ACS Estimate Percent MOE(±) Reliability
AGE 16+ YEARS
MEANS OF TRANSPORTATION TO WORK Total 11,139 100.0% 948 Drove alone 8,921 80 1% 931 Carpooled 819 7 4% 177 Public transportation (excluding taxicab) 53 0.5% 59 Bus or trolley bus 53 0.5% 59 Light rail, streetcar or trolley 0 0.0% 0 Subway or elevated 0 0.0% 0 Long-distance/Commuter Train 0 0.0% 0 Ferryboat 0 0.0% 0 Taxicab 27 0.2% 74 Motorcycle 34 0.3% 108 Bicycle 60 0.5% 127 Walked 156 1 4% 63 Other means 187 1.7% 164 Worked at home 882 7 9% 133
BY TRAVEL TIME TO WORK Total 10,257 100.0% 957 Less than 5 minutes 541 5.3% 117 5 to 9 minutes 1,669 16.3% 234 10 to 14 minutes 1,649 16 1% 434 15 to 19 minutes 782 7 6% 188 20 to 24 minutes 1,590 15 5% 371 25 to 29 minutes 1,595 15 6% 412 30 to 34 minutes 1,597 15.6% 319 35 to 39 minutes 259 2 5% 96 40 to 44 minutes 206 2.0% 91 45 to 59 minutes 207 2 0% 63 60 to 89 minutes 39 0.4% 41 90 or more minutes 125 1 2% 93 Average Travel Time to Work (in minutes) N/A N/A
WORKERS
BY
Total 6,975 100.0% 518 Own children under 6 years only 818 11.7% 238 In labor force 686 9 8% 210 Not in labor force 132 1.9% 123 Own children under 6 years and 6 to 17 years 460 6 6% 151 In labor force 281 4.0% 136 Not in labor force 180 2 6% 139 Own children 6 to 17 years only 1,446 20.7% 376 In labor force 1,188 17 0% 358 Not in labor force 259 3.7% 111 No own children under 18 years 4,251 60 9% 394 In labor force 3,369 48.3% 376 Not in labor force 882 12 6% 155 Source: U.S. Census Bureau, 2017-2021 American Community Survey Reliability: high medium low September 26, 2023 ©2023 Esri Page 13 of 24
AGE 20-64 YEARS BY AGE OF OWN CHILDREN AND EMPLOYMENT STATUS
4807 SW Xero Ave, Redmond, Oregon, 97756 Prepared by Esri Ring band: 1 - 3 mile radius Latitude: 44.24624 Longitude: -121.22678 2017-2021 ACS Estimate Percent MOE(±) Reliability CIVILIAN NONINSTITUTIONALIZED POPULATION BY AGE & TYPES OHEALINSURANCE COVERAGE OF HEALTH INSURANCE COVERAGE Total 22,485 100.0% 1,430 Under 19 years: 5,725 25 5% 657 One Type of Health Insurance: 5,322 23 7% 614 Employer-Based Health Ins Only 1,278 5.7% 283 Direct-Purchase Health Ins Only 546 2 4% 382 Medicare Coverage Only 0 0.0% 0 Medicaid Coverage Only 3,497 15 6% 506 TRICARE/Military Hlth Cov Only 2 0.0% 6 VA Health Care Only 0 0.0% 0 2+ Types of Health Insurance 349 1.6% 194 No Health Insurance Coverage 53 0.2% 45 19 to 34 years: 4,769 21.2% 616 One Type of Health Insurance: 3,683 16.4% 394 Employer-Based Health Ins Only 2,205 9.8% 310 Direct-Purchase Health Ins Only 428 1 9% 213 Medicare Coverage Only 0 0.0% 0 Medicaid Coverage Only 1,017 4 5% 178 TRICARE/Military Hlth Cov Only 25 0.1% 47 VA Health Care Only 9 0 0% 15 2+ Types of Health Insurance 461 2.1% 234 No Health Insurance Coverage 626 2 8% 297 35 to 64 years: 8,818 39 2% 821 One Type of Health Insurance: 6,274 27 9% 790 Employer-Based Health Ins Only 3,886 17 3% 680 Direct-Purchase Health Ins Only 1,051 4 7% 348 Medicare Coverage Only 157 0.7% 85 Medicaid Coverage Only 1,041 4 6% 247 TRICARE/Military Hlth Cov Only 55 0.2% 35 VA Health Care Only 83 0 4% 38 2+ Types of Health Insurance 1,415 6.3% 316 No Health Insurance Coverage 1,130 5.0% 301 65+ years: 3,172 14.1% 277 One Type of Health Insurance: 1,156 5.1% 233 Employer-Based Health Ins Only 62 0.3% 50 Direct-Purchase Health Ins Only 0 0.0% 3 Medicare Coverage Only 1,093 4.9% 232 TRICARE/Military Hlth Cov Only 0 0 0% 0 VA Health Care Only 0 0.0% 0 2+ Types of Health Insurance: 2,010 8 9% 188 Employer-Based & Direct-Purchase Health Insurance 0 0.0% 0 Employer-Based Health & Medicare Insurance 304 1 4% 77 Direct-Purchase Health & Medicare Insurance 906 4.0% 179 Medicare & Medicaid Coverage 112 0 5% 41 Other Private Health Insurance Combos 0 0.0% 0 Other Public Health Insurance Combos 35 0.2% 25 Other Health Insurance Combinations 654 2.9% 99 No Health Insurance Coverage 7 0.0% 13 Source: U.S. Census Bureau, 2017-2021 American Community Survey Reliability: high medium low September 26, 2023 ©2023 Esri Page 14 of 24
ACS Population Summary
ACS Population Summary
4807 SW Xero Ave, Redmond, Oregon, 97756 Prepared by Esri Ring band: 1 - 3 mile radius
BY RATIO OF INCOME TO POVERTY LEVEL
CIVILIAN POPULATION AGE 18 OR OLDER BY VETERAN STATUS
CIVILIAN VETERANS AGE 18 OR OLDER BY PERIOD OF MILITARY SERVICE
Latitude:
ACS Estimate Percent MOE(±) Reliability
Total 22,323 100.0% 1,429 Under 50 768 3.4% 244 50 to 99 1,090 4 9% 343 1 00 to 1 24 825 3.7% 297 1 25 to 1 49 1,451 6 5% 586 1 50 to 1 84 2,200 9.9% 637 1 85 to 1 99 551 2 5% 510 2 00 and over 15,438 69 2% 1,335
44.24624 Longitude: -121.22678 2017-2021
POPULATION
Total 17,083 100.0% 980 Veteran 1,260 7.4% 154 Nonveteran 15,823 92.6% 964 Male 7,990 46 8% 578 Veteran 1,143 6 7% 130 Nonveteran 6,847 40 1% 583 Female 9,093 53 2% 555 Veteran 117 0.7% 89 Nonveteran 8,976 52 5% 554
Total 1,260 100.0% 154 Gulf War (9/01 or later), no Gulf War (8/90 to 8/01), no Vietnam Era 214 17 0% 93 Gulf War (9/01 or later) and Gulf War (8/90 to 8/01), no Vietnam Era 59 4.7% 33 Gulf War (9/01 or later), and Gulf War (8/90 to 8/01), and Vietnam Era 0 0.0% 0 Gulf War (8/90 to 8/01), no Vietnam Era 161 12.8% 99 Gulf War (8/90 to 8/01) and Vietnam Era 6 0.5% 19 Vietnam Era, no Korean War, no World War II 489 38 8% 65 Vietnam Era and Korean War, no World War II 0 0.0% 0 Vietnam Era and Korean War and World War II 0 0.0% 0 Korean War, no Vietnam Era, no World War II 32 2.5% 16 Korean War and World War II, no Vietnam Era 0 0 0% 0 World War II, no Korean War, no Vietnam Era 24 1.9% 60 Between Gulf War and Vietnam Era only 219 17 4% 92 Between Vietnam Era and Korean War only 55 4.4% 32 Between Korean War and World War II only 0 0.0% 0 Pre-World War II only 0 0.0% 0 HOUSEHOLDS BY POVERTY STATUS Total 8,713 100.0% 485 Income in the past 12 months below poverty level 701 8.0% 180 Married-couple family 117 1 3% 50 Other family - male householder (no wife present) 98 1.1% 90 Other family - female householder (no husband present) 132 1 5% 56 Nonfamily household - male householder 87 1.0% 75 Nonfamily household - female householder 266 3.1% 125 Income in the past 12 months at or above poverty level 8,013 92 0% 485 Married-couple family 3,993 45 8% 390 Other family - male householder (no wife present) 315 3.6% 84 Other family - female householder (no husband present) 890 10.2% 245 Nonfamily household - male householder 965 11.1% 203 Nonfamily household - female householder 1,849 21 2% 304 Poverty Index 65 Source: U.S. Census Bureau, 2017-2021 American Community Survey Reliability: high medium low September 26, 2023 ©2023 Esri Page 15 of 24
ACS Population Summary
Data Note: N/A means not available Population by Ratio of Income to Poverty Level represents persons for whom poverty status is determined. Household income represents income in 2021, adjusted for inflation
2017-2021 ACS Estimate: The American Community Survey (ACS) replaces census sample data. Esri is releasing the 2017-2021 ACS estimates, five-year period data collected monthly from January 1, 2017 through December 31, 2021. Although the ACS includes many of the subjects previously covered by the decennial census sample, there are significant differences between the two surveys including fundamental differences in survey design and residency rules
Margin of error (MOE): The MOE is a measure of the variability of the estimate due to sampling error. MOEs enable the data user to measure the range of uncertainty for each estimate with 90 percent confidence. The range of uncertainty is called the confidence interval, and it is calculated by taking the estimate +/- the MOE. For example, if the ACS reports an estimate of 100 with an MOE of +/- 20, then you can be 90 percent certain the value for the whole population falls between 80 and 120.
Reliability: These symbols represent threshold values that Esri has established from the Coefficients of Variation (CV) to designate the usability of the estimates. The CV measures the amount of sampling error relative to the size of the estimate, expressed as a percentage
High Reliability: Small CVs (less than or equal to 12 percent) are flagged green to indicate that the sampling error is small relative to the estimate and the estimate is reasonably reliable.
Medium Reliability: Estimates with CVs between 12 and 40 are flagged yellow-use with caution.
Low Reliability: Large CVs (over 40 percent) are flagged red to indicate that the sampling error is large relative to the estimate. The estimate is considered very unreliable.
Source: U.S. Census Bureau, 2017-2021 American Community Survey
Reliability: high medium low
4807 SW Xero Ave, Redmond, Oregon, 97756 Prepared by Esri Ring band: 1 - 3 mile radius Latitude: 44.24624 Longitude: -121.22678 2017-2021 ACS Estimate Percent MOE(±) Reliability HOUSEHOLDS BY OTHER INCOME Social Security Income 2,831 32 5% 242 No Social Security Income 5,882 67.5% 478 Retirement Income 1,585 18 2% 182 No Retirement Income 7,129 81 8% 496 GROSS RENT AS A PERCENTAGE OF HOUSEHOLD INCOME IN THE PAST 12 MONTHS <10% of Income 96 3.1% 106 10-14 9% of Income 285 9.3% 81 15-19 9% of Income 528 17 3% 210 20-24 9% of Income 360 11 8% 149 25-29.9% of Income 356 11.6% 119 30-34 9% of Income 179 5.9% 88 35-39 9% of Income 403 13 2% 270 40-49 9% of Income 266 8.7% 61 50+% of Income 478 15 6% 138 Gross Rent % Inc Not Computed 107 3.5% 50 HOUSEHOLDS BY PUBLIC ASSISTANCE INCOME IN THE PAST 12 MONTHS Total 8,713 100.0% 485 With public assistance income 269 3.1% 108 No public assistance income 8,444 96.9% 489 HOUSEHOLDS BY FOOD STAMPS/SNAP STATUS Total 8,713 100.0% 485 With Food Stamps/SNAP 1,381 15.8% 240 With No Food Stamps/SNAP 7,332 84.2% 481 HOUSEHOLDS BY DISABILITY STATUS Total 8,713 100.0% 485 With 1+ Persons w/Disability 2,171 24.9% 237 With No Person w/Disability 6,542 75.1% 516
September 26, 2023 ©2023 Esri Page 16 of 24
ACS Population Summary
4807 SW Xero Ave, Redmond, Oregon, 97756 Prepared by Esri Ring band: 3 - 5 mile radius Latitude: 44.24624 Longitude: -121.22678 2017-2021 ACS Estimate Percent MOE(±) Reliability TOTALS Total Population 14,682 1,120 Total Households 5,908 325 Total Housing Units 6,466 352 POPULATION AGE 3+ YEARS BY SCHOOL ENROLLMENT Total 14,368 100.0% 1,046 Enrolled in school 2,723 19 0% 406 Enrolled in nursery school, preschool 223 1 6% 98 Public school 155 1.1% 96 Private school 68 0.5% 41 Enrolled in kindergarten 31 0.2% 18 Public school 10 0.1% 16 Private school 21 0.1% 26 Enrolled in grade 1 to grade 4 616 4.3% 185 Public school 574 4.0% 183 Private school 42 0.3% 105 Enrolled in grade 5 to grade 8 692 4.8% 161 Public school 561 3 9% 158 Private school 131 0.9% 52 Enrolled in grade 9 to grade 12 629 4 4% 225 Public school 551 3.8% 222 Private school 77 0.5% 47 Enrolled in college undergraduate years 462 3.2% 112 Public school 411 2.9% 115 Private school 51 0.4% 55 Enrolled in graduate or professional school 70 0 5% 56 Public school 41 0.3% 45 Private school 29 0.2% 33 Not enrolled in school 11,644 81.0% 646 POPULATION AGE 65+ BY RELATIONSHIP AND HOUSEHOLD TYPE Total 3,337 100.0% 190 Living in Households 3,321 99 5% 188 Living in Family Households 2,437 73 0% 181 Householder 1,180 35 4% 110 Spouse 1,022 30 6% 90 Parent 39 1.2% 39 Parent-in-law 108 3 2% 114 Other Relative 53 1.6% 44 Nonrelative 34 1.0% 42 Living in Nonfamily Households 884 26 5% 105 Householder 827 24.8% 102 Nonrelative 57 1.7% 30 Living in Group Quarters 16 0 5% 28 Source: U.S. Census Bureau, 2017-2021 American Community Survey Reliability: high medium low September 26, 2023 ©2023 Esri Page 17 of 24
ACS Population Summary
BY PRESENCE OF PEOPLE 65 YEARS AND OVER,
4807 SW Xero Ave, Redmond, Oregon, 97756 Prepared by Esri Ring band: 3 - 5 mile radius Latitude: 44.24624 Longitude: -121.22678 2017-2021 ACS Estimate Percent MOE(±) Reliability HOUSEHOLDS BY TYPE AND SIZE Family Households 3,991 67 6% 311 2-Person 2,110 35.7% 189 3-Person 803 13 6% 206 4-Person 571 9.7% 153 5-Person 409 6 9% 157 6-Person 57 1.0% 49 7+ Person 39 0.7% 44 Nonfamily Households 1,918 32 5% 198 1-Person 1,480 25 1% 180 2-Person 337 5.7% 78 3-Person 77 1.3% 91 4-Person 25 0.4% 77 5-Person 0 0.0% 0 6-Person 0 0.0% 0 7+ Person 0 0.0% 0 HOUSEHOLDS BY PRESENCE OF PEOPLE UNDER 18 YEARS BY HOUSEHOLD TYPE Households with one or more people under 18 years 1,284 21.7% 206 Family households 1,252 21.2% 206 Married-couple family 961 16.3% 188 Male householder, no wife present 128 2.2% 80 Female householder, no husband present 163 2.8% 54 Nonfamily households 32 0.5% 58 Households with no people under 18 years 4,624 78.3% 282 Married-couple family 2,298 38.9% 243 Other family 440 7.4% 146 Nonfamily households 1,886 31.9% 198 HOUSEHOLDS
AND HOUSEHOLD TYPE Households with Pop 65+ 2,304 39.0% 143 1-Person 711 12.0% 101 2+ Person Family 1,476 25.0% 124 2+ Person Nonfamily 118 2.0% 32 Households with No Pop 65+ 3,604 61.0% 341 1-Person 769 13.0% 162 2+ Person Family 2,515 42.6% 312 2+ Person Nonfamily 320 5.4% 79 HOUSEHOLD
HOUSEHOLDS
IN HOUSEHOLDS Total 14,620 100.0% 1,115 In Family Households 12,100 82 8% 1,143 In Married-Couple Family 9,473 64 8% 957 Relatives 9,340 63 9% 937 Nonrelatives 132 0.9% 78 In Male Householder-No Spouse Present-Family 652 4.5% 349 Relatives 529 3 6% 246 Nonrelatives 123 0.8% 111 In Female Householder-No Spouse Present-Family 1,975 13 5% 715 Relatives 1,852 12.7% 703 Nonrelatives 124 0 8% 71 In Nonfamily Households 2,520 17 2% 253 Source: U.S. Census Bureau, 2017-2021 American Community Survey Reliability: high medium low September 26, 2023 ©2023 Esri Page 18 of 24
HOUSEHOLD SIZE
TYPE BY RELATIVES AND NONRELATIVES FOR POPULATION IN
POPULATION
ACS Population Summary
4807 SW Xero Ave, Redmond, Oregon, 97756 Prepared by Esri Ring band: 3 - 5 mile radius Latitude: 44.24624 Longitude: -121.22678 2017-2021 ACS Estimate Percent MOE(±) Reliability POPULATION AGE 5+ YEARS BY LANGUAGE SPOKEN AT HOME AND ABILITY TO SPEAK ENGLISH Total 14,063 100.0% 994 5 to 17 years Speak only English 1,794 12 8% 377 Speak Spanish 205 1.5% 109 Speak English "very well" or "well" 132 0.9% 75 Speak English "not well" 73 0.5% 71 Speak English "not at all" 0 0 0% 0 Speak other Indo-European languages 7 0.0% 10 Speak English "very well" or "well" 7 0.0% 10 Speak English "not well" 0 0.0% 0 Speak English "not at all" 0 0 0% 0 Speak Asian and Pacific Island languages 0 0.0% 0 Speak English "very well" or "well" 0 0.0% 0 Speak English "not well" 0 0.0% 0 Speak English "not at all" 0 0 0% 0 Speak other languages 0 0.0% 0 Speak English "very well" or "well" 0 0.0% 0 Speak English "not well" 0 0.0% 0 Speak English "not at all" 0 0 0% 0 18 to 64 years Speak only English 7,861 55.9% 789 Speak Spanish 611 4.3% 289 Speak English "very well" or "well" 488 3 5% 296 Speak English "not well" 118 0.8% 77 Speak English "not at all" 5 0 0% 121 Speak other Indo-European languages 230 1.6% 111 Speak English "very well" or "well" 230 1 6% 111 Speak English "not well" 0 0.0% 0 Speak English "not at all" 0 0 0% 0 Speak Asian and Pacific Island languages 18 0.1% 19 Speak English "very well" or "well" 17 0.1% 16 Speak English "not well" 1 0.0% 23 Speak English "not at all" 0 0 0% 0 Speak other languages 0 0.0% 0 Speak English "very well" or "well" 0 0.0% 0 Speak English "not well" 0 0.0% 0 Speak English "not at all" 0 0 0% 0 65 years and over Speak only English 3,204 22 8% 189 Speak Spanish 111 0.8% 38 Speak English "very well" or "well" 33 0.2% 60 Speak English "not well" 34 0.2% 41 Speak English "not at all" 44 0 3% 77 Speak other Indo-European languages 22 0.2% 59 Speak English "very well" or "well" 21 0.1% 63 Speak English "not well" 1 0.0% 4 Speak English "not at all" 0 0 0% 0 Speak Asian and Pacific Island languages 0 0.0% 0 Speak English "very well" or "well" 0 0.0% 0 Speak English "not well" 0 0.0% 0 Speak English "not at all" 0 0 0% 0 Speak other languages 0 0.0% 0 Speak English "very well" or "well" 0 0.0% 0 Speak English "not well" 0 0.0% 0 Speak English "not at all" 0 0 0% 0 Source: U.S. Census Bureau, 2017-2021 American Community Survey Reliability: high medium low September 26, 2023 ©2023 Esri Page 19 of 24
4807 SW Xero Ave, Redmond, Oregon, 97756 Prepared by Esri Ring band: 3 - 5 mile radius Latitude: 44.24624 Longitude: -121.22678 2017-2021 ACS Estimate Percent MOE(±) Reliability WORKERS AGE 16+ YEARS BY PLACE OF WORK Total 6,693 100.0% 607 Worked in state and in county of residence 6,318 94.4% 605 Worked in state and outside county of residence 309 4 6% 76 Worked outside state of residence 66 1.0% 29 SEX BY CLASS OF WORKER FOR THE CIVILIAN EMPLOYED POPULATION 16 YEARS AND OVER Total: 6,863 100.0% 651 Male: 3,422 49 9% 418 Employee of private company workers 2,222 32 4% 343 Self-employed in own incorporated business workers 489 7.1% 174 Private not-for-profit wage and salary workers 127 1.9% 51 Local government workers 211 3.1% 118 State government workers 82 1.2% 37 Federal government workers 102 1.5% 56 Self-employed in own not incorporated business workers 185 2 7% 65 Unpaid family workers 4 0.1% 22 Female: 3,441 50 1% 388 Employee of private company workers 1,944 28 3% 369 Self-employed in own incorporated business workers 335 4 9% 114 Private not-for-profit wage and salary workers 583 8.5% 129 Local government workers 239 3.5% 92 State government workers 106 1.5% 40 Federal government workers 46 0.7% 42 Self-employed in own not incorporated business workers 175 2.5% 40 Unpaid family workers 14 0 2% 20 POPULATION IN HOUSEHOLDS AND PRESENCE OF A COMPUTER Total 14,620 100.0% 1,115 Population <18 in Households 2,625 18 0% 475 Have a Computer 2,624 17 9% 475 Have NO Computer 1 0.0% 16 Population 18-64 in Households 8,674 59 3% 837 Have a Computer 8,597 58 8% 837 Have NO Computer 77 0 5% 88 Population 65+ in Households 3,321 22 7% 188 Have a Computer 3,250 22.2% 187 Have NO Computer 70 0 5% 39 HOUSEHOLDS AND INTERNET SUBSCRIPTIONS Total 5,908 100.0% 325 With an Internet Subscription 5,391 91.2% 325 Dial-Up Alone 23 0 4% 30 Broadband 4,267 72 2% 321 Satellite Service 529 9.0% 95 Other Service 33 0 6% 28 Internet Access with no Subscription 115 1.9% 60 With No Internet Access 402 6 8% 131 Source: U.S. Census Bureau, 2017-2021 American Community Survey Reliability: high medium low September 26, 2023 ©2023 Esri Page 20 of 24
ACS Population Summary
ACS Population Summary
FEMALES AGE 20-64 YEARS BY AGE OF OWN CHILDREN AND EMPLOYMENT STATUS
4807 SW Xero Ave, Redmond, Oregon, 97756 Prepared by Esri Ring band: 3 - 5 mile radius Latitude: 44.24624 Longitude: -121.22678 2017-2021 ACS Estimate Percent MOE(±) Reliability WORKERS AGE 16+ YEARS BY MEANS OF TRANSPORTATION TO WORK Total 6,693 100.0% 607 Drove alone 4,521 67 5% 453 Carpooled 875 13 1% 175 Public transportation (excluding taxicab) 65 1.0% 100 Bus or trolley bus 65 1.0% 100 Light rail, streetcar or trolley 0 0.0% 0 Subway or elevated 0 0.0% 0 Long-distance/Commuter Train 0 0.0% 0 Ferryboat 0 0.0% 0 Taxicab 18 0.3% 30 Motorcycle 18 0.3% 20 Bicycle 15 0.2% 24 Walked 147 2 2% 91 Other means 43 0.6% 34 Worked at home 989 14 8% 248
BY TRAVEL TIME TO WORK Total 5,703 100.0% 530 Less than 5 minutes 229 4.0% 88 5 to 9 minutes 873 15.3% 320 10 to 14 minutes 1,016 17 8% 202 15 to 19 minutes 727 12 7% 123 20 to 24 minutes 557 9.8% 108 25 to 29 minutes 387 6 8% 169 30 to 34 minutes 1,128 19.8% 172 35 to 39 minutes 159 2 8% 100 40 to 44 minutes 224 3.9% 71 45 to 59 minutes 186 3 3% 50 60 to 89 minutes 159 2.8% 116 90 or more minutes 57 1 0% 48 Average Travel Time to Work (in minutes) N/A N/A
WORKERS AGE 16+ YEARS (WHO DID NOT WORK FROM HOME)
Total 4,546 100.0% 463 Own children under 6 years only 305 6.7% 197 In labor force 232 5 1% 181 Not in labor force 73 1.6% 79 Own children under 6 years and 6 to 17 years 191 4 2% 90 In labor force 125 2.7% 79 Not in labor force 65 1.4% 48 Own children 6 to 17 years only 736 16.2% 182 In labor force 614 13 5% 173 Not in labor force 122 2.7% 61 No own children under 18 years 3,314 72 9% 405 In labor force 2,428 53.4% 364 Not in labor force 886 19 5% 177 Source: U.S. Census Bureau, 2017-2021 American Community Survey Reliability: high medium low September 26, 2023 ©2023 Esri Page 21 of 24
4807 SW Xero Ave, Redmond, Oregon, 97756 Prepared by Esri Ring band: 3 - 5 mile radius Latitude: 44.24624 Longitude: -121.22678 2017-2021 ACS Estimate Percent MOE(±) Reliability CIVILIAN NONINSTITUTIONALIZED POPULATION BY AGE & TYPES OHEALINSURANCE COVERAGE OF HEALTH INSURANCE COVERAGE Total 14,672 100.0% 1,119 Under 19 years: 2,835 19 3% 493 One Type of Health Insurance: 2,643 18 0% 495 Employer-Based Health Ins Only 1,415 9.6% 416 Direct-Purchase Health Ins Only 68 0 5% 50 Medicare Coverage Only 0 0.0% 0 Medicaid Coverage Only 991 6 8% 307 TRICARE/Military Hlth Cov Only 170 1.2% 155 VA Health Care Only 0 0.0% 0 2+ Types of Health Insurance 114 0.8% 67 No Health Insurance Coverage 78 0.5% 77 19 to 34 years: 2,531 17.3% 540 One Type of Health Insurance: 2,079 14.2% 402 Employer-Based Health Ins Only 1,564 10 7% 352 Direct-Purchase Health Ins Only 94 0.6% 43 Medicare Coverage Only 0 0.0% 0 Medicaid Coverage Only 364 2 5% 190 TRICARE/Military Hlth Cov Only 51 0.3% 50 VA Health Care Only 6 0 0% 28 2+ Types of Health Insurance 289 2.0% 227 No Health Insurance Coverage 163 1 1% 50 35 to 64 years: 5,974 40 7% 530 One Type of Health Insurance: 4,452 30 3% 489 Employer-Based Health Ins Only 3,047 20 8% 476 Direct-Purchase Health Ins Only 641 4 4% 151 Medicare Coverage Only 63 0.4% 41 Medicaid Coverage Only 648 4 4% 137 TRICARE/Military Hlth Cov Only 43 0.3% 40 VA Health Care Only 10 0 1% 19 2+ Types of Health Insurance 886 6.0% 170 No Health Insurance Coverage 635 4.3% 178 65+ years: 3,332 22.7% 188 One Type of Health Insurance: 1,034 7.0% 139 Employer-Based Health Ins Only 33 0.2% 31 Direct-Purchase Health Ins Only 4 0.0% 18 Medicare Coverage Only 996 6.8% 136 TRICARE/Military Hlth Cov Only 0 0 0% 0 VA Health Care Only 0 0.0% 0 2+ Types of Health Insurance: 2,299 15 7% 153 Employer-Based & Direct-Purchase Health Insurance 0 0.0% 0 Employer-Based Health & Medicare Insurance 456 3 1% 109 Direct-Purchase Health & Medicare Insurance 1,024 7.0% 117 Medicare & Medicaid Coverage 179 1 2% 73 Other Private Health Insurance Combos 0 0.0% 0 Other Public Health Insurance Combos 42 0.3% 26 Other Health Insurance Combinations 598 4.1% 79 No Health Insurance Coverage 0 0.0% 0 Source: U.S. Census Bureau, 2017-2021 American Community Survey Reliability: high medium low September 26, 2023 ©2023 Esri Page 22 of 24
ACS Population Summary
ACS Population Summary
4807 SW Xero Ave, Redmond, Oregon, 97756
Prepared by Esri Ring band: 3 - 5 mile radius Latitude: 44.24624 Longitude: -121.22678
BY RATIO OF INCOME TO POVERTY LEVEL
CIVILIAN POPULATION AGE 18 OR OLDER BY VETERAN STATUS
2017-2021
CIVILIAN VETERANS AGE 18 OR OLDER BY PERIOD OF MILITARY SERVICE
ACS Estimate Percent MOE(±) Reliability POPULATION
Total 14,599 100.0% 1,115 Under 50 718 4.9% 220 50 to 99 620 4 2% 201 1 00 to 1 24 519 3.6% 149 1 25 to 1 49 1,429 9 8% 828 1 50 to 1 84 399 2.7% 161 1 85 to 1 99 237 1 6% 58 2 00 and over 10,677 73 1% 834
Total 12,054 100.0% 814 Veteran 1,344 11.1% 250 Nonveteran 10,710 88.9% 715 Male 5,530 45 9% 448 Veteran 1,255 10 4% 245 Nonveteran 4,275 35 5% 364 Female 6,524 54 1% 487 Veteran 89 0.7% 103 Nonveteran 6,435 53 4% 487
Total 1,344 100.0% 250 Gulf War (9/01 or later), no Gulf War (8/90 to 8/01), no Vietnam Era 243 18 1% 226 Gulf War (9/01 or later) and Gulf War (8/90 to 8/01), no Vietnam Era 13 1.0% 13 Gulf War (9/01 or later), and Gulf War (8/90 to 8/01), and Vietnam Era 0 0.0% 0 Gulf War (8/90 to 8/01), no Vietnam Era 100 7.4% 80 Gulf War (8/90 to 8/01) and Vietnam Era 6 0.4% 20 Vietnam Era, no Korean War, no World War II 404 30 1% 78 Vietnam Era and Korean War, no World War II 4 0.3% 19 Vietnam Era and Korean War and World War II 0 0.0% 0 Korean War, no Vietnam Era, no World War II 76 5.7% 30 Korean War and World War II, no Vietnam Era 0 0 0% 0 World War II, no Korean War, no Vietnam Era 0 0.0% 0 Between Gulf War and Vietnam Era only 365 27 2% 85 Between Vietnam Era and Korean War only 134 10 0% 43 Between Korean War and World War II only 0 0.0% 0 Pre-World War II only 0 0.0% 0 HOUSEHOLDS BY POVERTY STATUS Total 5,908 100.0% 325 Income in the past 12 months below poverty level 637 10.8% 132 Married-couple family 115 1 9% 61 Other family - male householder (no wife present) 0 0.0% 0 Other family - female householder (no husband present) 83 1.4% 50 Nonfamily household - male householder 194 3.3% 119 Nonfamily household - female householder 245 4.1% 75 Income in the past 12 months at or above poverty level 5,271 89 2% 314 Married-couple family 3,145 53 2% 303 Other family - male householder (no wife present) 196 3.3% 86 Other family - female householder (no husband present) 451 7.6% 142 Nonfamily household - male householder 606 10.3% 113 Nonfamily household - female householder 872 14 8% 133 Poverty Index 87 Source: U.S. Census Bureau, 2017-2021 American Community Survey Reliability: high medium low September 26, 2023 ©2023 Esri Page 23 of 24
ACS Population Summary
Data Note: N/A means not available Population by Ratio of Income to Poverty Level represents persons for whom poverty status is determined. Household income represents income in 2021, adjusted for inflation
2017-2021 ACS Estimate: The American Community Survey (ACS) replaces census sample data. Esri is releasing the 2017-2021 ACS estimates, five-year period data collected monthly from January 1, 2017 through December 31, 2021. Although the ACS includes many of the subjects previously covered by the decennial census sample, there are significant differences between the two surveys including fundamental differences in survey design and residency rules
Margin of error (MOE): The MOE is a measure of the variability of the estimate due to sampling error. MOEs enable the data user to measure the range of uncertainty for each estimate with 90 percent confidence. The range of uncertainty is called the confidence interval, and it is calculated by taking the estimate +/- the MOE. For example, if the ACS reports an estimate of 100 with an MOE of +/- 20, then you can be 90 percent certain the value for the whole population falls between 80 and 120.
Reliability: These symbols represent threshold values that Esri has established from the Coefficients of Variation (CV) to designate the usability of the estimates. The CV measures the amount of sampling error relative to the size of the estimate, expressed as a percentage
High Reliability: Small CVs (less than or equal to 12 percent) are flagged green to indicate that the sampling error is small relative to the estimate and the estimate is reasonably reliable.
Medium Reliability: Estimates with CVs between 12 and 40 are flagged yellow-use with caution.
Low Reliability: Large CVs (over 40 percent) are flagged red to indicate that the sampling error is large relative to the estimate. The estimate is considered very unreliable.
Source: U.S. Census Bureau, 2017-2021 American Community Survey
Reliability: high medium low September
4807 SW Xero Ave, Redmond, Oregon, 97756 Prepared by Esri Ring band: 3 - 5 mile radius Latitude: 44.24624 Longitude: -121.22678 2017-2021 ACS Estimate Percent MOE(±) Reliability HOUSEHOLDS BY OTHER INCOME Social Security Income 2,491 42 2% 202 No Social Security Income 3,418 57.9% 330 Retirement Income 1,773 30 0% 156 No Retirement Income 4,136 70 0% 324 GROSS RENT AS A PERCENTAGE OF HOUSEHOLD INCOME IN THE PAST 12 MONTHS <10% of Income 67 4.5% 67 10-14 9% of Income 137 9.3% 92 15-19 9% of Income 123 8 3% 43 20-24 9% of Income 101 6.8% 79 25-29.9% of Income 135 9.1% 60 30-34 9% of Income 147 10 0% 80 35-39 9% of Income 55 3 7% 44 40-49 9% of Income 152 10 3% 141 50+% of Income 512 34 7% 105 Gross Rent % Inc Not Computed 48 3.2% 69 HOUSEHOLDS BY PUBLIC ASSISTANCE INCOME IN THE PAST 12 MONTHS Total 5,908 100.0% 325 With public assistance income 206 3.5% 107 No public assistance income 5,703 96.5% 325 HOUSEHOLDS BY FOOD STAMPS/SNAP STATUS Total 5,908 100.0% 325 With Food Stamps/SNAP 699 11.8% 131 With No Food Stamps/SNAP 5,209 88.2% 324 HOUSEHOLDS BY DISABILITY STATUS Total 5,908 100.0% 325 With 1+ Persons w/Disability 1,838 31.1% 217 With No Person w/Disability 4,071 68.9% 348
26, 2023 ©2023 Esri Page 24 of 24
Market Profile
Data Note: Household population includes persons not residing in group quarters. Average Household Size is the household population divided by total households. Persons in families include the householder and persons related to the householder by birth, marriage, or adoption. Per Capita Income represents the income received by all persons aged 15 years and over divided by the total population
and
decennial Census data converted by Esri into 2020 geography.
4807 SW Xero Ave, Redmond, Oregon, 97756 Prepared by Esri Ring bands: 0-1, 1-3, 3-5 mile radii Latitude: 44.24624 Longitude: -121.22678 0 - 1 mile 1 - 3 mile 3 - 5 mile Population Summary 2010 Total Population 2,303 16,766 12,745 2020 Total Population 3,356 21,275 15,617 2020 Group Quarters 11 43 102 2023 Total Population 3,432 23,464 17,045 2023 Group Quarters 10 44 102 2028 Total Population 3,584 24,514 17,934 2023-2028 Annual Rate 0.87% 0.88% 1.02% 2023 Total Daytime Population 2,206 20,415 17,712 Workers 262 8,368 8,466 Residents 1,944 12,047 9,246 Household Summary 2010 Households 857 6,549 4,949 2010 Average Household Size 2.62 2.53 2.56 2020 Total Households 1,210 8,410 6,029 2020 Average Household Size 2.76 2.52 2.57 2023 Households 1,261 9,293 6,569 2023 Average Household Size 2.71 2.52 2.58 2028 Households 1,322 9,790 6,953 2028 Average Household Size 2.70 2.50 2.56 2023-2028 Annual Rate 0.95% 1.05% 1.14% 2010 Families 594 4,475 3,547 2010 Average Family Size 3.08 2.97 2.96 2023 Families 836 6,198 4,583 2023 Average Family Size 3.27 2.99 3.02 2028 Families 873 6,489 4,834 2028 Average Family Size 3.25 2.97 3.00 2023-2028 Annual Rate 0.87% 0.92% 1.07% Housing Unit Summary 2000 Housing Units 655 4,481 3,439 Owner Occupied Housing Units 72.4% 59.3% 68.7% Renter Occupied Housing Units 18.6% 33.7% 23.1% Vacant Housing Units 9.0% 7.0% 8.2% 2010 Housing Units 961 7,673 5,905 Owner Occupied Housing Units 66.8% 46.8% 57.1% Renter Occupied Housing Units 22.4% 38.6% 26.7% Vacant Housing Units 10.8% 14.6% 16.2% 2020 Housing Units 1,327 9,240 6,706 Vacant Housing Units 8.8% 9.0% 10.1% 2023 Housing Units 1,361 10,245 7,200 Owner Occupied Housing Units 81.0% 55.7% 70.8% Renter Occupied Housing Units 11.6% 35.0% 20.4% Vacant Housing Units 7.3% 9.3% 8.8% 2028 Housing Units 1,415 10,704 7,558 Owner Occupied Housing Units 82.3% 56.4% 72.2% Renter Occupied Housing Units 11.2% 35.0% 19.8% Vacant Housing Units 6.6% 8.5% 8.0% Median Household Income 2023 $76,739 $76,081 $78,106 2028 $87,388 $82,912 $91,276 Median Home Value 2023 $517,170 $467,956 $519,994 2028 $582,638 $546,657 $593,309 Per Capita Income 2023 $35,108 $35,718 $38,767 2028 $41,245 $41,386 $45,901 Median Age 2010 45.6 34.4 39.5 2023 47.8 37.1 41.4 2028 47.9 37.5 41.5
Source: Esri
for 2023 and 2028 U.S. Census
2010
September
2023 ©2023 Esri Page 1 of 7
forecasts
Bureau 2000
26,
Market Profile
Data Note: Income represents the preceding year, expressed in current dollars. Household income includes wage and salary earnings, interest dividends, net rents, pensions, SSI and welfare payments, child support, and alimony.
Source: Esri forecasts for 2023 and 2028 U.S. Census Bureau 2000 and 2010 decennial Census data converted by Esri into 2020 geography. September 26, 2023
4807 SW Xero Ave, Redmond, Oregon, 97756 Prepared by Esri Ring bands: 0-1, 1-3, 3-5 mile radii Latitude: 44.24624 Longitude: -121.22678 0 - 1 mile 1 - 3 mile 3 - 5 mile 2023 Households by Income Household Income Base 1,261 9,293 6,569 <$15,000 9.8% 6.0% 7.2% $15,000 - $24,999 9.1% 6.1% 4.0% $25,000 - $34,999 3.6% 4.8% 5.6% $35,000 - $49,999 10.1% 13.1% 14.1% $50,000 - $74,999 15.9% 18.7% 16.6% $75,000 - $99,999 16.0% 20.1% 15.7% $100,000 - $149,999 26.0% 20.6% 22.6% $150,000 - $199,999 5.9% 6.5% 7.5% $200,000+ 3.6% 4.0% 6.8% Average Household Income $88,174 $91,549 $100,803 2028 Households by Income Household Income Base 1,322 9,790 6,953 <$15,000 8.4% 5.2% 6.2% $15,000 - $24,999 5.7% 4.4% 2.9% $25,000 - $34,999 3.0% 3.6% 4.0% $35,000 - $49,999 8.9% 11.4% 10.8% $50,000 - $74,999 15.1% 17.1% 14.6% $75,000 - $99,999 15.4% 20.6% 16.0% $100,000 - $149,999 30.1% 23.3% 26.3% $150,000 - $199,999 8.5% 9.2% 10.3% $200,000+ 4.7% 5.1% 8.7% Average Household Income $103,146 $105,243 $118,632 2023 Owner Occupied Housing Units by Value Total 1,103 5,706 5,097 <$50,000 0.9% 2.4% 2.4% $50,000 - $99,999 0.0% 5.2% 0.5% $100,000 - $149,999 0.2% 1.8% 0.5% $150,000 - $199,999 0.5% 4.4% 1.4% $200,000 - $249,999 0.9% 4.0% 1.3% $250,000 - $299,999 2.4% 5.6% 3.1% $300,000 - $399,999 7.1% 14.5% 8.8% $400,000 - $499,999 34.6% 17.7% 29.2% $500,000 - $749,999 49.5% 36.1% 35.6% $750,000 - $999,999 3.5% 4.2% 11.5% $1,000,000 - $1,499,999 0.4% 2.9% 4.5% $1,500,000 - $1,999,999 0.1% 0.8% 1.0% $2,000,000 + 0.0% 0.2% 0.3% Average Home Value $536,244 $488,083 $580,502 2028 Owner Occupied Housing Units by Value Total 1,165 6,041 5,459 <$50,000 0.0% 0.1% 0.3% $50,000 - $99,999 0.0% 1.3% 0.0% $100,000 - $149,999 0.0% 0.0% 0.0% $150,000 - $199,999 0.0% 0.2% 0.0% $200,000 - $249,999 0.0% 0.4% 0.0% $250,000 - $299,999 0.0% 0.4% 0.0% $300,000 - $399,999 0.4% 16.0% 3.1% $400,000 - $499,999 27.5% 23.1% 29.7% $500,000 - $749,999 66.9% 45.1% 45.4% $750,000 - $999,999 4.3% 6.2% 12.5% $1,000,000 - $1,499,999 0.6% 4.9% 6.9% $1,500,000 - $1,999,999 0.3% 2.0% 1.9% $2,000,000 + 0.0% 0.2% 0.2% Average Home Value $594,099 $600,770 $662,248
©2023 Esri Page 2 of 7
Market Profile
4807 SW Xero Ave, Redmond, Oregon, 97756 Prepared by Esri Ring bands: 0-1, 1-3, 3-5 mile radii Latitude: 44.24624 Longitude: -121.22678 0 - 1 mile 1 - 3 mile 3 - 5 mile 2010 Population by Age Total 2,305 16,762 12,744 0 - 4 5.2% 7.9% 6.4% 5 - 9 5.2% 7.4% 7.3% 10 - 14 6.4% 7.1% 7.5% 15 - 24 9.8% 13.6% 10.6% 25 - 34 9.6% 14.8% 12.0% 35 - 44 12.9% 13.4% 13.3% 45 - 54 13.5% 12.0% 13.9% 55 - 64 15.0% 10.8% 13.4% 65 - 74 11.8% 6.8% 9.3% 75 - 84 6.9% 4.1% 4.7% 85 + 3.5% 2.1% 1.6% 18 + 79.2% 73.4% 74.4% 2023 Population by Age Total 3,431 23,463 17,046 0 - 4 4.6% 6.8% 5.8% 5 - 9 5.2% 6.9% 6.2% 10 - 14 5.3% 6.8% 6.6% 15 - 24 10.0% 12.4% 11.6% 25 - 34 10.6% 14.2% 11.6% 35 - 44 11.0% 13.4% 13.0% 45 - 54 12.4% 11.3% 12.4% 55 - 64 13.6% 11.5% 13.2% 65 - 74 14.6% 10.3% 12.2% 75 - 84 9.5% 4.9% 5.6% 85 + 3.2% 1.6% 1.8% 18 + 81.8% 75.8% 77.2% 2028 Population by Age Total 3,581 24,514 17,935 0 - 4 4.7% 6.9% 5.9% 5 - 9 5.1% 6.8% 6.2% 10 - 14 5.6% 7.0% 6.7% 15 - 24 9.0% 12.2% 10.8% 25 - 34 11.0% 13.6% 12.4% 35 - 44 11.3% 13.8% 12.4% 45 - 54 11.6% 11.1% 12.4% 55 - 64 12.7% 10.8% 12.1% 65 - 74 14.3% 10.3% 12.3% 75 - 84 10.7% 5.7% 6.8% 85 + 4.1% 1.8% 2.0% 18 + 81.4% 75.6% 77.2% 2010 Population by Sex Males 1,134 8,100 6,260 Females 1,169 8,666 6,485 2023 Population by Sex Males 1,680 11,479 8,407 Females 1,752 11,985 8,638 2028 Population by Sex Males 1,744 11,986 8,813 Females 1,839 12,527 9,122 Source: Esri forecasts for 2023 and 2028 U.S. Census Bureau 2000 and 2010 decennial Census data converted by Esri into 2020 geography. September 26, 2023 ©2023 Esri Page 3 of 7
Market Profile
Data Note: Persons of Hispanic Origin may be of any race The Diversity Index measures the probability that two people from the same area will be from different race/ ethnic groups Source: Esri forecasts for 2023 and 2028 U.S. Census Bureau 2000 and 2010 decennial Census data converted by Esri into 2020 geography.
26, 2023
4807 SW Xero Ave, Redmond, Oregon, 97756 Prepared by Esri Ring bands: 0-1, 1-3, 3-5 mile radii Latitude: 44.24624 Longitude: -121.22678 0 - 1 mile 1 - 3 mile 3 - 5 mile 2010 Population by Race/Ethnicity Total 2,302 16,766 12,744 White Alone 93.8% 88.6% 91.9% Black Alone 0.3% 0.4% 0.4% American Indian Alone 0.9% 1.3% 1.0% Asian Alone 0.7% 0.7% 0.8% Pacific Islander Alone 0.1% 0.2% 0.2% Some Other Race Alone 2.0% 5.9% 3.4% Two or More Races 2.3% 3.0% 2.4% Hispanic Origin 5.6% 12.7% 9.0% Diversity Index 21.4 38.6 29.3 2020 Population by Race/Ethnicity Total 3,356 21,275 15,617 White Alone 87.3% 81.7% 83.5% Black Alone 0.3% 0.6% 0.4% American Indian Alone 0.7% 1.1% 1.0% Asian Alone 1.0% 1.2% 0.9% Pacific Islander Alone 0.1% 0.2% 0.1% Some Other Race Alone 2.6% 5.5% 4.8% Two or More Races 8.0% 9.7% 9.2% Hispanic Origin 8.8% 13.4% 11.6% Diversity Index 35.4 47.8 43.6 2023 Population by Race/Ethnicity Total 3,431 23,464 17,044 White Alone 86.7% 80.8% 82.8% Black Alone 0.3% 0.6% 0.4% American Indian Alone 0.8% 1.2% 1.1% Asian Alone 1.0% 1.3% 1.0% Pacific Islander Alone 0.1% 0.2% 0.1% Some Other Race Alone 2.7% 5.8% 5.2% Two or More Races 8.5% 10.1% 9.6% Hispanic Origin 9.4% 14.3% 12.3% Diversity Index 37.0 49.6 45.4 2028 Population by Race/Ethnicity Total 3,582 24,514 17,934 White Alone 85.7% 79.6% 81.6% Black Alone 0.3% 0.6% 0.3% American Indian Alone 0.8% 1.2% 1.1% Asian Alone 1.1% 1.4% 1.0% Pacific Islander Alone 0.1% 0.2% 0.2% Some Other Race Alone 2.9% 6.3% 5.6% Two or More Races 9.1% 10.8% 10.2% Hispanic Origin 10.0% 15.2% 13.2% Diversity Index 39.0 51.9 47.6 2010 Population by Relationship and Household Type Total 2,303 16,766 12,745 In Households 97.4% 98.8% 99.6% In Family Households 81.9% 82.8% 85.3% Householder 28.0% 26.3% 27.8% Spouse 23.5% 18.7% 21.9% Child 25.7% 31.0% 29.8% Other relative 2.2% 3.2% 2.9% Nonrelative 2.5% 3.7% 3.0% In Nonfamily Households 15.5% 15.9% 14.3% In Group Quarters 2.6% 1.2% 0.4% Institutionalized Population 1.8% 0.8% 0.0% Noninstitutionalized Population 0.8% 0.4% 0.4%
September
©2023 Esri Page 4 of 7
Market Profile
4807 SW Xero Ave, Redmond, Oregon, 97756 Prepared by Esri Ring bands: 0-1, 1-3, 3-5 mile radii Latitude: 44.24624 Longitude: -121.22678 0 - 1 mile 1 - 3 mile 3 - 5 mile 2023 Population 25+ by Educational Attainment Total 2,572 15,766 11,904 Less than 9th Grade 2.4% 3.6% 1.9% 9th - 12th Grade, No Diploma 6.1% 5.8% 4.0% High School Graduate 33.5% 20.9% 22.0% GED/Alternative Credential 1.3% 4.0% 3.7% Some College, No Degree 24.5% 23.7% 28.1% Associate Degree 7.9% 12.8% 10.0% Bachelor's Degree 18.0% 19.7% 22.3% Graduate/Professional Degree 6.3% 9.5% 7.9% 2023 Population 15+ by Marital Status Total 2,914 18,673 13,875 Never Married 19.3% 31.3% 20.8% Married 57.9% 49.6% 56.7% Widowed 11.4% 5.0% 6.0% Divorced 11.5% 14.2% 16.5% 2023 Civilian Population 16+ in Labor Force Civilian Population 16+ 1,591 12,447 8,247 Population 16+ Employed 94.9% 93.5% 95.9% Population 16+ Unemployment rate 5.2% 6.5% 4.1% Population 16-24 Employed 10.9% 12.8% 12.2% Population 16-24 Unemployment rate 7.3% 20.9% 20.1% Population 25-54 Employed 68.9% 66.9% 65.5% Population 25-54 Unemployment rate 0.3% 3.9% 0.9% Population 55-64 Employed 15.0% 14.9% 16.1% Population 55-64 Unemployment rate 22.3% 5.8% 3.2% Population 65+ Employed 5.3% 5.4% 6.3% Population 65+ Unemployment rate 0.0% 0.0% 1.2% 2023 Employed Population 16+ by Industry Total 1,510 11,632 7,911 Agriculture/Mining 1.1% 1.3% 1.7% Construction 12.8% 15.0% 9.5% Manufacturing 6.0% 6.4% 5.0% Wholesale Trade 4.6% 1.8% 1.4% Retail Trade 20.0% 13.5% 14.5% Transportation/Utilities 0.5% 5.6% 7.2% Information 0.0% 0.8% 1.4% Finance/Insurance/Real Estate 0.0% 2.8% 5.2% Services 53.2% 49.8% 51.2% Public Administration 1.5% 3.1% 3.0% 2023 Employed Population 16+ by Occupation Total 1,509 11,634 7,910 White Collar 55.8% 56.5% 61.3% Management/Business/Financial 18.0% 16.0% 16.3% Professional 19.3% 19.2% 20.5% Sales 12.6% 9.2% 10.8% Administrative Support 6.0% 12.1% 13.6% Services 22.5% 18.5% 17.0% Blue Collar 21.7% 25.1% 21.7% Farming/Forestry/Fishing 0.0% 0.3% 0.1% Construction/Extraction 4.4% 9.1% 5.9% Installation/Maintenance/Repair 3.2% 2.1% 3.6% Production 0.8% 3.7% 4.7% Transportation/Material Moving 13.3% 9.8% 7.5% Source: Esri forecasts for 2023 and 2028 U.S. Census Bureau 2000 and 2010 decennial Census data converted by Esri into 2020 geography. September 26, 2023 ©2023 Esri Page 5 of 7
Market Profile
Data Note: Households with children include any households with people under age 18, related or not. Multigenerational households are families with 3 or more parentchild relationships. Unmarried partner households are usually classified as nonfamily households unless there is another member of the household related to the householder. Multigenerational and unmarried partner households are reported only to the tract level. Esri estimated block group data, which is used to estimate polygons or non-standard geography.
Esri forecasts for 2023 and 2028 U.S. Census Bureau 2000 and 2010 decennial Census data converted by Esri into 2020 geography.
26, 2023
4807 SW Xero Ave, Redmond, Oregon, 97756 Prepared by Esri Ring bands: 0-1, 1-3, 3-5 mile radii Latitude: 44.24624 Longitude: -121.22678 0 - 1 mile 1 - 3 mile 3 - 5 mile 2010 Households by Type Total 858 6,549 4,949 Households with 1 Person 25.3% 23.9% 21.6% Households with 2+ People 74.7% 76.1% 78.4% Family Households 69.2% 68.3% 71.7% Husband-wife Families 58.0% 48.8% 56.4% With Related Children 19.8% 21.3% 22.8% Other Family (No Spouse Present) 11.2% 19.6% 15.3% Other Family with Male Householder 4.0% 5.5% 4.7% With Related Children 2.6% 4.1% 3.3% Other Family with Female Householder 7.2% 14.0% 10.6% With Related Children 4.7% 10.7% 7.6% Nonfamily Households 5.5% 7.7% 6.7% All Households with Children 27.5% 36.8% 34.4% Multigenerational Households 2.3% 3.6% 3.1% Unmarried Partner Households 5.8% 9.1% 8.1% Male-female 5.4% 8.5% 7.5% Same-sex 0.5% 0.6% 0.6% 2010 Households by Size Total 858 6,548 4,949 1 Person Household 25.3% 23.9% 21.6% 2 Person Household 40.2% 36.3% 39.0% 3 Person Household 14.3% 16.2% 16.0% 4 Person Household 11.9% 13.0% 13.1% 5 Person Household 5.1% 6.7% 6.7% 6 Person Household 2.1% 2.6% 2.6% 7 + Person Household 1.0% 1.3% 1.1% 2010 Households by Tenure and Mortgage Status Total 857 6,549 4,949 Owner Occupied 74.9% 54.8% 68.1% Owned with a Mortgage/Loan 52.5% 42.7% 51.6% Owned Free and Clear 22.4% 12.2% 16.5% Renter Occupied 25.1% 45.2% 31.9% 2023 Affordability, Mortgage and Wealth Housing Affordability Index 61 67 62 Percent of Income for Mortgage 40.5% 37.0% 40.0% Wealth Index 75 72 95 2010 Housing Units By Urban/ Rural Status Total Housing Units 961 7,673 5,905 Housing Units Inside Urbanized Area 0.0% 0.0% 0.0% Housing Units Inside Urbanized Cluster 77.7% 80.8% 65.3% Rural Housing Units 22.3% 19.2% 34.8% 2010 Population By Urban/ Rural Status Total Population 2,303 16,766 12,745 Population Inside Urbanized Area 0.0% 0.0% 0.0% Population Inside Urbanized Cluster 80.0% 87.8% 72.6% Rural Population 20.0% 12.2% 27.4%
Source:
©2023 Esri Page 6 of 7
September
Market Profile
Data Note: Consumer spending shows the amount spent on a variety of goods and services by households that reside in the area Expenditures are shown by broad budget categories that are not mutually exclusive. Consumer spending does not equal business revenue. Total and Average Amount Spent Per Household represent annual figures The Spending Potential Index represents the amount spent in the area relative to a national average of 100
Source: Consumer Spending data are derived from the 2019 and 2020 Consumer Expenditure Surveys, Bureau of Labor Statistics. Esri. Source: Esri forecasts for 2023 and 2028 U.S. Census Bureau 2000 and 2010 decennial Census data converted by Esri into 2020 geography.
September 26, 2023
4807 SW Xero Ave, Redmond, Oregon, 97756 Prepared by Esri Ring bands: 0-1, 1-3, 3-5 mile radii Latitude: 44.24624 Longitude: -121.22678 0 - 1 mile 1 - 3 mile 3 - 5 mile Top 3 Tapestry Segments 1. Midlife Constants (5E) Middleburg (4C) Middleburg (4C) 2. Middleburg (4C) Urban Edge Families (7C) The Great Outdoors (6C) 3. The Great Outdoors (6C) Front Porches (8E) Silver & Gold (9A) 2023 Consumer Spending Apparel & Services: Total $ $2,202,873 $17,446,484 $13,234,691 Average Spent $1,746.93 $1,877.38 $2,014.72 Spending Potential Index 79 85 92 Education: Total $ $1,712,187 $13,602,013 $9,993,531 Average Spent $1,357.80 $1,463.68 $1,521.32 Spending Potential Index 76 82 85 Entertainment/Recreation: Total $ $4,034,646 $29,979,278 $23,693,326 Average Spent $3,199.56 $3,226.01 $3,606.84 Spending Potential Index 85 85 95 Food at Home: Total $ $7,074,964 $54,445,896 $41,631,634 Average Spent $5,610.60 $5,858.81 $6,337.59 Spending Potential Index 82 86 93 Food Away from Home: Total $ $3,762,089 $29,929,375 $22,890,467 Average Spent $2,983.42 $3,220.64 $3,484.62 Spending Potential Index 80 87 94 Health Care: Total $ $8,251,461 $58,996,708 $47,534,775 Average Spent $6,543.59 $6,348.51 $7,236.23 Spending Potential Index 89 86 98 HH Furnishings & Equipment: Total $ $3,097,786 $23,616,254 $18,502,335 Average Spent $2,456.61 $2,541.29 $2,816.61 Spending Potential Index 83 86 95 Personal Care Products & Services: Total $ $981,477 $7,718,563 $5,918,636 Average Spent $778.33 $830.58 $900.99 Spending Potential Index 81 87 94 Shelter: Total $ $25,185,321 $199,699,212 $150,913,712 Average Spent $19,972.50 $21,489.21 $22,973.62 Spending Potential Index 81 87 93 Support Payments/Cash Contributions/Gifts in Kind: Total $ $3,475,126 $25,241,459 $20,450,688 Average Spent $2,755.85 $2,716.18 $3,113.21 Spending Potential Index 88 87 100 Travel: Total $ $2,347,219 $17,963,034 $14,165,765 Average Spent $1,861.39 $1,932.96 $2,156.46 Spending Potential Index 83 86 96 Vehicle Maintenance & Repairs: Total $ $1,396,612 $10,704,571 $8,370,909 Average Spent $1,107.54 $1,151.90 $1,274.30 Spending Potential Index 85 88 97
©2023 Esri Page 7 of 7

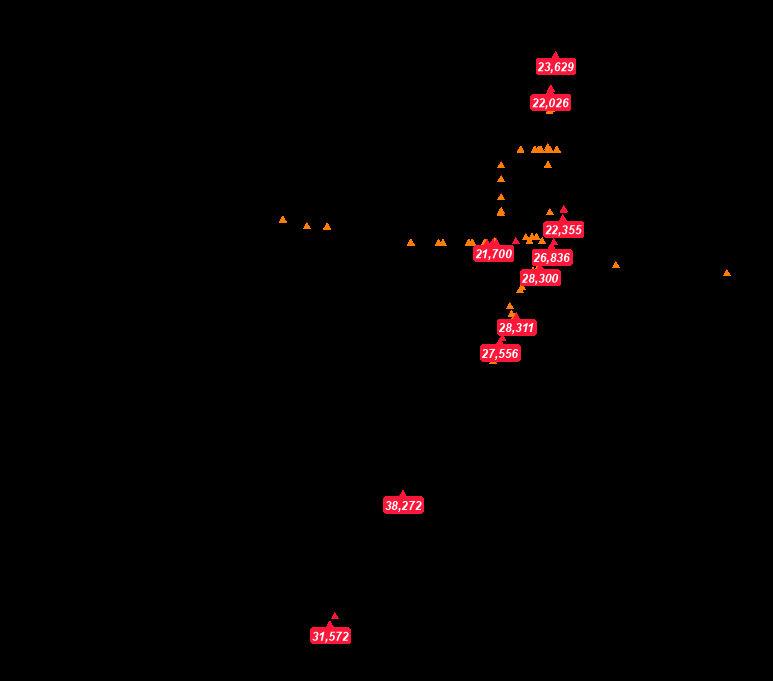
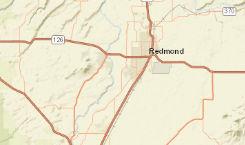
Bureau of Land Management, State of Oregon GEO, State of Oregon, Esri, HERE, Garmin, INCREMENT P, NGA, USGS, U.S. Forest Service 0 0.8 1.6 mi
4807 SW Xero Ave, Redmond, Oregon, 97756 Prepared by Esri Ring bands: 0-1, 1-3, 3-5 mile radii Latitude: 44.24624 Longitude: -121.22678 Source: ©2023 Kalibrate Technologies (Q2 2023). September 26, 2023 ©2023 Esri Page 1 of 1
Traffic Count Map
RESIDENTIAL USE ZONES
8.0120
8.0121
8.0125 Residential Neighborhood Mixed Use RMU Zone.
[Section 8.0125 deleted by Ord. #2022-04 passed June 28, 2022]
8.0130 Urban Holding UH-10 Zone. The City shall administer the provisions of Title 20 Redmond Urban Area Zoning Ordinance of the Deschutes County Code for this County zoning district.
1. Master Development Plans. The development and approval of an Urban Area Master Plan subject to the provisions of RDC 8.0270 is required as a condition of annexation, prior to or concurrent with rezoning from UH-10 to City zoning districts.
2. Exception to Master Development Plans Requirement. Approval of a development plan may be granted without going through a Master Development Plan process according to the following requirements:
Non-Residential Properties.
A. The development plan is 12 acres or less in size; and,
B. The development plan addresses the applicable Great Neighborhood Principles; and, the development plan includes an appropriate local grid street plan, that complies with street spacing and connectivity requirements in the Redmond TSP and showing street connectivity and bike/pedestrian system connectivity to adjacent planned and unplanned residential areas; and,
C. The development plan meets applicable requirements for land near the urban edge; and,
D. The development approval is obtained through a PUD process except when the property is to be used for a public use, such as for a park or school or some other public facility; and,
E. Annexation to the City of Redmond is proposed as part of the development plan; and,
F. The development plan addresses all other applicable requirements of the Redmond Comprehensive Plan and Development Code; and,
G. The development plan conforms to the density and design guidelines established for the area in the Redmond Urban Framework Plan and/or an adopted Area Plan.
Residential Properties.
H. The parcel is within the City of Redmond or can be annexed to the City; and,
I. The parcel is 3 acres or less in size; and,
J. The development plan conforms to the density and design guidelines established for the area in the Redmond Urban Framework Plan and/or an adopted Area Plan; and,
CHAPTER 8 DEVELOPMENT REGULATIONS 38
Limited Residential
Zone.
Limited Residential
Zone.
Limited Residential
Zone.
Limited Residential
Zone.
General Residential
Zone.
8.0100
R-1
8.0105
R-2
8.0110
R-3
8.0111
R-3A
8.0115
R-4
High Density Residential
R-5 Zone.
Higher Density Overlay Zone.
K. The development plan meets the applicable Great Neighborhood Principles, Land Division, and Site Plan policies; and,
L. Significant Goal 5 resources, as defined in Redmond Comprehensive Plan, Chapter 5, are identified, and managed, in accordance with Redmond’s Goal 5 resource protection program; and,
M. The development plan includes an appropriate local grid street plan that complies with street spacing and connectivity requirements in the Redmond TSP and showing street connectivity and bike/pedestrian system connectivity to adjacent planned and unplanned residential areas; and,
N. The development plan meets applicable requirements for land near the urban edge and meets applicable planning requirements for land near the urban rural interface; and,
O. The development application meets all other required elements for one of the City’s land use planning approval processes.
[Section 8.0130 amended by Ord. #2015-01 passed February 24, 2015]
[Section 8.0130 amended by Ord. #2020-15 passed November 10, 2020]
[Section 8.0130 amended by Ord. #2022-04 passed June 28, 2022]
CHAPTER 8 DEVELOPMENT REGULATIONS 39
8.0135 Table A, Residential Zones, Uses Permitted. The following uses are allowed outright or conditionally in each of the Residential zones as follows:
CHAPTER 8 DEVELOPMENT REGULATIONS 40
“O” means Permitted Outright “C” means Permitted Conditionally “N” means Not Allowed Residential Uses: R-1 R-2 R-3 R-4 R-5 RESTRICTIONS AND REQUIREMENTS Accessory Building: Detached sheds, shops, and garages O O O O O Must be located within the property and not in the yard setback areas. Moveable shipping containers, or similar, are not allowed. Guest House O O O O O No kitchen; uses main houses' sewer & water Accessory Dwelling Unit / Accessory Suite O O O O O Uses main houses' sewer & water or individual City Services; may have kitchen Accessory Use O O O O O Includes Home Occupations Apartments See Multi-Family Complex / Dwelling Bed and Breakfast C C C C C Boarding or Rooming House N N C O O Cottage Development O O O O O Manufactured Home O O O O O See Single Family Detached Dwelling Manufactured Home Park N N N O O See Section 8.0375 Manufactured Home Subdivision N N O O O Subject to compliance w/ applicable ORS Multi Family Complex (5 + units) C C C O O Single Family Detached Dwelling, Duplex, Triplex, Quadplex, Townhouse, Cottage Cluster O O O O O Nursing, Convalescent, and Assisted Living Facility N N C C C More than 15 people Planned Unit Development C C C C C Residential Care Facility N N C C O Defined in and regulated by ORS Residential Care Home O O O O O Defined in and regulated by ORS Non Residential Uses: R-1 R-2 R-3 R-4 R-5 RESTRICTIONS AND REQUIREMENTS Child Care Facility: Child Care Center C C C C C Child Care Home O O O O O Church, Religious Institution C C C C C Community Center (private) C C C C C Community Pool (private) C C C C C Farm Use, Farming O O O O O Mini Storage N N N N N Multi-Use Trail O O O O O Park O O O O O Livestock O O O O O Subject to livestock provisions, section 8.0365 Office N N C C C Conditional in conjunction with a master plan or PUD Retail N N C C C Conditional in conjunction with a master plan or PUD
CHAPTER 8 DEVELOPMENT REGULATIONS
All "R" zones are subject to density transfer provisions. See 8.0020, "Definitions," Density Transfer, and 8.0367, "OSPR / 'R' Zone Density Transfer Provision
[Section 8.0135 amended by Ord. #2009-04 passed April 28, 2009]
[Section 8.0135 amended by Ord. #2015-04 passed May 19, 2015]
[Section 8.0135 amended by Ord. #2016-17 passed January 31, 2017]
[Section 8.0135 amended by Ord. #2018-09 passed September 11, 2018]
[Section 8.0135 amended by Ord. #2020-15 passed November 10, 2020]
[Section 8.0135 amended by Ord. #2022-04 passed June 28, 2022]
8.0137 Table for R-3A Zones, Uses Permitted. The following uses are allowed outright or conditionally in the Residential Zone R-3A as follows:
allowed.
41 School (private) C C C C C Tennis Court (private) O O O O O Non-commercial use only Public Facility or Emergency Management Services C C C C C City Owned Utility Facility O O O O O Private Utility Facilities C C C C C
Residential Uses: R-3A RESTRICTIONS AND REQUIREMENTS Accessory Building: Detached sheds, shops, garages. O Must be located within the property and not
Guest Houses or Accessory Dwelling Unit O Connected to primary residential unit utilities; includes kitchen. Accessory Use O Includes Home Occupation. Multi-Family Complex O Bed and Breakfast C Single Family Detached Dwelling, Duplex, Triplex, Quadplex, Townhouse, Cottage Cluster O Residential Care Home O Defined and regulated by ORS. Non-Residential Uses: Child Care Facility Child Care Center C Child Care Home O Church, Religious Institution C Community Center (private) C Community Pool (private) C Commercial Office C Only within buildings existing as of Oct. 20, 2007, or as modified (expanded) up to a maximum of 25%. Any modification shall require site plan review. A building Retail C Professional Offices C Restaurant C
in the yard setback areas. Moveable shipping containers, or similar, are not
Potting sheds, or similar, must be located within the property and not in the yard setback areas.
CHAPTER 8 DEVELOPMENT REGULATIONS
[Section 8.0137 amended by Ord. #2018-09 passed September 11, 2018]
[Section 8.0137 amended by Ord. #2020-15 passed November 10, 2020]
[Section 8.0137 amended by Ord. #2022-04 passed June 28, 2022]
8.0138 Standards. Except as provided for in Section 8.0137 and 8.0615, the standards and criteria for development in the R-3 zone shall apply to development in the R-3A zone.
8.0140 Table B, Minimum Standards. The following minimum standards apply in each of the Residential zones:
Planned Unit Developments (PUDs) and Cottage Developments (COD) densities in Section 8.0275 et seq.
42 Theater C destroyed or damaged may be rebuilt up to the former size and general configuration. Art Gallery or Center C Public or Semi Public Uses C School (private) C Tennis Court (private) O City Owned Utility Facility O Private Utility Facilities C C = conditional uses.
Standard: R-1 R-2 R-3, R-3A R-4 R-5 Minimum Lot size - Square Feet Single Family, Duplex, Triplex 9,000 9,000 7,500 5,500 5,500 Quadplex, Cottage Clusters 9,000 9,000 7,500 7,000 7,000 Townhouse 1,500 1,500 1,500 1,500 1,500 Multi-family Complex: 5+ units No Minimum Lot Size Must Meet Density Standards Density - Units/Net Acres Minimum Density: All 4 4 5 5 8 Maximum Density: Single Family 5 5 5.8 8 8 Maximum Density: Duplex, Triplex, Quadplex, Cottage Cluster No Maximum Density Must Meet Minimum Lot Size Maximum Density: Townhouses 20 20 23.2 25 25 Maximum Density: Multi-family Complex 5+ units N/A N/A N/A 14.5 17.4 Standard: R-1 R-2 R-3, R-3A R-4 R-5
Minimum Setback Distance - Feet Front Façade, excluding garage 10 10 10 10 10 Interior Side 5/10 5/10 5 5 5
Interior side yards must be a minimum of 5 feet on one side and 10 feet on the other side for single family, duplex, triplex, and quadplex residences. Where alley access is provided, both interior side yards may be reduced to 5 feet. Exceptions to the 10-foot setback are allowed (1) when the residential lot was created prior to the adoption of this standard (November 9, 2006); (2) on cul-de-sac lots; or (3) on flag lots.
Setbacks:
ADUs: Specified in Section 8.0325
Detached Accessory Structures: Specified in Section 8.0323
Cottage Clusters: Specified in Section 8.0143
Cottage Developments: Specified in Section 8.0285 et seq.
Multi-family Complexes: Specified in Section 8.3035.4E. Table A.
Townhouses: Specified in Section 8.0142
[Section 8.0140 amended by Ord. #2012-04 passed April 24, 2012]
[Section 8.0140 amended by Ord. #2013-04 passed May 14, 2013]
[Section 8.0140 amended by Ord. #2018-09 passed September 11, 2018]
[Section 8.0140 amended by Ord. #2020-15 passed November 10, 2020
[Section 8.0140 amended by Ord. #2022-04 passed June 28, 2022]
[Section 8.0140 amended by Ord. #2022-09 passed December 13, 2022]
8.0141 Single Family Detached Dwellings and Plexes Development and Design Standards.
1. Purpose. The purpose of these Development and Design Standards is to promote and sustain:
A. Quality development throughout a variety of housing choices;
B. Architectural design that:
1. Enhances the visual environment and character of the community;
2. Preserves and protects property values, as well as public and private infrastructure investment;
3. Conveys a sense of balance and character among all neighborhoods throughout Redmond; and
4. Elevates the attractiveness and quality of life in Redmond.
2. Intent. The intent of the Development and Design Standards is to:
A. Maintain flexibility for a variety of architectural style to be developed;
CHAPTER 8 DEVELOPMENT REGULATIONS 43
Street Side 10 10 10 10 10 Rear 20 20 20 15 5 Attached Garage, access from alley or street 20 20 20 20 20
Maximum Building Height - Feet 32 32 32 45 45 Minimum Street Frontage - Feet Standard Street 50 50 50 50 40 Cul-de-sac 30 30 30 30 30 Flag Lot 20 20 20 20 20 Townhouse 20 20 20 20 20
B. Continue to allow innovations in design that recognize newer technologies such as solar and wind power, telecommunications, and environmentally conscious construction methods; and,
C. Promote quality design characteristics that will enhance the long-term desirability of the dwelling, neighborhood, and community.
3. Procedure. New single-family detached dwellings and plexes, shall be reviewed for conformance with the requirements listed in this Section, subject to the procedures outlined below:
A. Track 1. Clear and Objective Process. Conformance with Section 8.0141(5), below. An application demonstrating conformance with this Section shall be shown on the architectural plans submitted with the building permit application and administered as part of the plan review process. These applications are reviewed administratively.
B. Track 2. Discretionary Process. As an alternative to the Track 1 procedure, an application may be submitted which demonstrates conformance with the Purpose and Intent of this Section as listed above. These applications are reviewed administratively unless it is determined that a public hearing is necessary, in which case the application will be reviewed by the appropriate Hearings Body. The City may also approve other architectural designs or design elements not listed in this section, approve exceptions or uniquely identifiable house styles provided they comply with the intent of this section.
C. Design Review for Manufactured and Mobile Homes not within approved mobile home parks: Some manufactured homes and mobile homes may not be able to fully comply with the requirements below. In those cases, the following features are required as part of a Track 2 process.
1. At least one covered porch;
2. One exterior types of wall siding material on 4 sides;
3. Band courses; and
4. Application and Approval Process. The applications for either a Track 1 or 2 review as specified in Sections 8.0141(3)(A) and (B) above, shall be submitted prior to or in conjunction with an application for a building permit
5. Architectural Design Standards. Although specific architectural styles are not mandated, single family detached dwellings and plexes, shall conform with the following standards:
A. Screening of Mechanical Equipment. All exterior ground mounted mechanical equipment located forward from the line of the front façade (living space and garage) of the building shall be screened from the street at the ground/eye level line of sight by use of landscaping materials such as shrubs and trees or fencing at least three (3) feet in height at installation. Solar power, wind power, and satellite dishes necessitating placement on walls or roofs for normal operation are exempt from this provision.
B. Building Design. The standards of this section apply per residential structure, rather than per dwelling unit contained in the residential structure.
1. Architectural Design. Duplicate or repetitive exterior home designs must be separated by at least one (1) lot/attached building of nonrepetitive exterior design on either side of the home and not be directly across the street from one another. Home designs will not be considered repetitious if three differentiating criteria are used as listed below:
a. Process. Builders of dwelling units or residential structures on the same street, with the exception of multiple dwelling units that are part of a single plex development, shall submit a plat showing
CHAPTER 8 DEVELOPMENT REGULATIONS 44
the house plan names, elevation designations, or pictures for adjacent homes.
b. Attached plexes are exempt.
2. Roof Design. Required Roof Design Elements:
a. Pitched or sloping roof elements;
b. Eave of at least 12 inches.
3. Front Façade Wall Design. Ten (10) façade elements listed below shall be used on the front elevation. Use of T-111 exceeding 20% of all facades, combined, is not allowed.
a. 25% fenestration of the first story front façade.
b. Window trim at least 3.5 inches wide that completely surrounds the window;
c. Band course, band molding, bellyband, belt course that runs the entire width of the front façade of relatively slight projection; or at the break of the second floor (if one exists) or at the line made by the lower roofline at the gable end;
d. Variation in wall siding, wall surface pattern or decorative materials. If an area above the highest band course exists, it must contain a different siding material than the area below the band;
e. Recessed or covered front entry at least 20 square feet, with a minimum 4-foot depth measured from the front door. If columns are used, they must not be exposed dimensional lumber less than 6” x 6”;
f. Windows with multi-paned sashes, operable sashes, or windows that are elliptical, round, arched, bay, semi-circular or similar design;
g. Shutters;
h. Balconies;
i. Garage doors, including patterning relief over the door surface;
j. Optional enhancements and substitutions:
i. Enclosed soffits;
ii. 1 ½” caliper tree in front of landscape area, in addition to required street trees;
iii. Covered rear patio or porch;
iv. Eave greater than 12 inches in depth, including extended soffit details;
v. Where gable ends are proposed, at least three (3) gable end elements;
vi. Masonry accents;
vii. Paint color schemes, with a minimum of 2 colors used; and
viii. Other elements or substitutions as approved by the Community Development Director, or designee.
4. Side Elevations facing public streets. Side elevations facing streets must include either window trim at least 3.5” in width, or full-lap siding. Façade facing streets are required to have at least 10 square feet of windows or doors.
5. Front Door. A front door that is visible from the public street frontage (front yard) and pedestrian connection between the front door and the public sidewalk is required.
6. Driveways and Garages.
CHAPTER 8 DEVELOPMENT REGULATIONS 45
a. A garage is required for each newly constructed residential structure and shall be of adequate size to accommodate a minimum of one vehicle, and shall at a minimum, meet the design requirements in Section 8.0505 through 8.0515 (Off Street Parking and Loading Requirements) of the RDC.
i. Manufactured homes may meet this standard by substituting a garage with covered parking or carport.
ii. Triplexes and quadplexes may meet this standard by substituting garage or covered parking with uncovered, paved parking spot(s) per the design requirements in Section 8.0505 through 8.0515.
b. Driveways shall be of adequate size to accommodate a minimum of one vehicle, and shall at a minimum, meet the design requirements in Section 8.0515 (Parking Table and Diagram) of the Redmond Development Code.
c. A single-family detached home that adds an ADU shall continue to meet the minimum parking spaces requirement for the primary home.
d. Notwithstanding the applicable provisions of Sections 8.0505 through 8.0515 (Off Street Parking and Loading Requirements) of the RDC, all required off street parking areas and driveways constructed in conjunction with single family detached dwellings or plexes may have alternative surfaces to concrete or asphalt and may include permeable surfaces to the extent they provide an allweather surface sufficient for vehicular travel. Loose gravel, aggregate and similar surface treatments are not permitted for required parking spaces.
7. Off-street Parking. The minimum number of required off-street parking spaces for single-family detached dwellings and plexes are specified in Section 8.0500.
8. Landscaping. Landscaping standards are as follows:
a. On all lots which new single-family detached dwellings or plexes are constructed, landscaping shall be installed between the corresponding façade(s) of the structure and the edge of the street(s), public or private, for the entire length of the street frontage(s).
b. Required landscaping can include, but is not limited to, a combination of the following materials: living plant material such as trees, shrubs, flowers, and lawn (can include artificial turf); and non-living materials such as walkways and courtyards consisting of brick, concrete, asphalt, decorative rock, or other approved materials. Applicable landscaping requirements are subject to the following:
i. Xeriscaping is encouraged. The minimum required allowance for plantings shall be 25%. Rock, rock gardens and bark areas without plantings do not qualify as landscaping or xeriscaping.
ii. The use of gravel is limited to spaces specified for the parking of RVs.
iii. Areas of exposed dirt are not allowed.
c. Street trees are required to be installed on all residential
CHAPTER 8 DEVELOPMENT REGULATIONS 46
lots fronting on public or private streets, including lots already platted at the time of adoption of this ordinance, but not yet developed. Additional standards are located in Section 8.3035.5.K.
each street
i. Flag lots shall be exempt from street tree requirements unless the frontage portion of the flag lot is 30’ or greater.
d. All landscaping and street tree installation shall be completed prior to issuance of a Certificate of Occupancy
9. Fences. See Section 8.0340.
10. Conversion Conversions of an existing single-family detached dwelling to a duplex, triplex, or quadplex is allowed, provided that the conversion does not increase non-conformance with applicable standards of the underlying zone and this section.
[Section 8.0141 added by Ord. #2013-04 passed May 14, 2013]
[Section 8.0141 amended by Ord. #2014-14 passed July 22, 2014]
[Section 8.0141 amended by Ord. #2015-04 passed May 19, 2015]
[Section 8.0141 amended by Ord. #2016-17 passed January 31, 2017]
[Section 8.0141 amended by Ord. #2017-12 passed December 12, 2017]
[Section 8.0141 amended by Ord. #2018-09 passed September 11, 2018]
[Section 8.0141 amended by Ord. #2020-15 passed November 10, 2020]
[Section 8.0141 amended by Ord. #2022-04 passed June 28, 2022]
[Section 8.0141 amended by Ord. #2022-09 passed December 13, 2022]
8.0142 Townhouse Development and Design Standards.
1. Procedure. New townhouses shall be reviewed for conformance with the requirements listed in this section
2. Table A: Minimum Standards.
CHAPTER 8 DEVELOPMENT REGULATIONS 47
Lot Width Number of Street Trees Required Corner Lot Tree requirements will be based on
frontage
50 feet and less 1 51-100 feet 2 101-150 feet 3 151 feet and more One tree/40 feet of
fronting street.
length.
width
Standard: R-1 R-2 R-3, R-3A R-4 R-5 Maximum Density (Units/Net Acre) 20 20 23.2 25 25 Minimum Lot Size (Square Feet) 1,500 1,500 1,500 1,500 1,500 Maximum Building Height (Feet) 35 35 35 45 45 Minimum Street Frontage (Feet) 20 20 20 20 20
3. Off-Street Parking. Townhouses shall meet the off-street parking requirements of Section 8.0500.
4. Areas Owned in Common. For townhouse projects, common areas must be maintained by a homeowners association or other legal entity. A homeowners association may also be responsible for exterior building maintenance. A copy of any applicable covenants, restrictions and conditions must be recorded and provided to the City prior to issuance of a building permit.
5. Design Standards. New townhouses shall meet the design standards in subsections A through G of this section.
A. Entry Orientation. The main entrance of each townhouse must:
1. Be within 8 feet of the longest street-facing wall of the dwelling unit, if the lot has public street frontage; and
2. Either:
a. Face the street (see Figure 1);
b. Be at an angle of up to 45 degrees from the street (see Figure 2);
c. Face a common open space or private access or driveway that is abutted by dwellings on at least two sides; or
d. Open onto a porch (see Figure 3). The porch must:
i. Be at least 25 square feet in area; and
ii. Have at least one entrance facing the street or have a roof.
48 Minimum Setback Distance (Feet) Front with alley or other rear access 10 10 10 10 5 Front without alley or other rear access 10 10 10 10 10 Front garage setback from street 20 20 20 20 20 Non-street side: Common wall lot line where units are attached 0 0 0 0 0 Exterior wall at end of a townhouse structure 5 5 5 5 5 Street Side 10 10 10 10 10 Rear with garage and alley access 0 0 0 0 0 Rear without garage 10 10 10 10 10
CHAPTER 8 DEVELOPMENT REGULATIONS
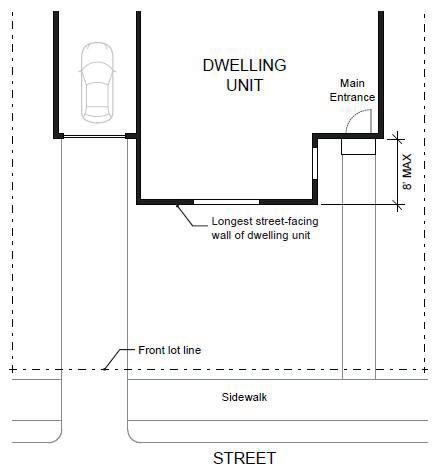
CHAPTER 8 DEVELOPMENT REGULATIONS 49
Figure 1. Main Entrance Facing the Street
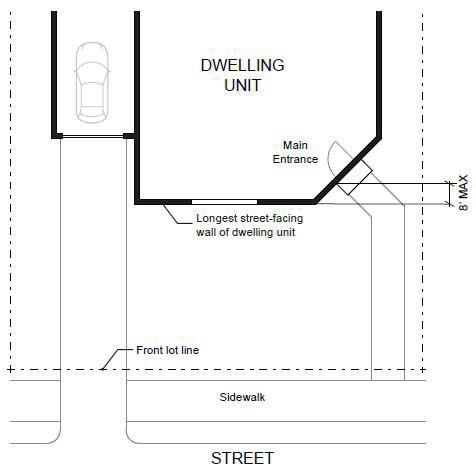
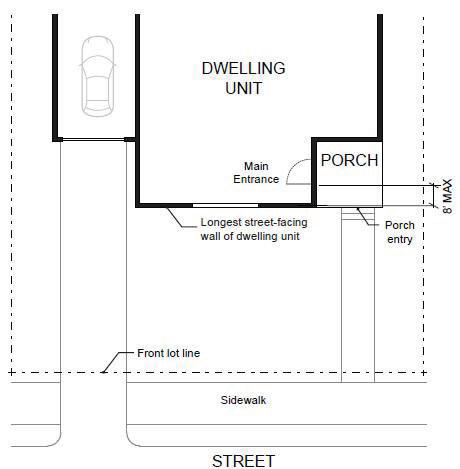
CHAPTER 8 DEVELOPMENT REGULATIONS 50
Figure 2. Main Entrance at 45° Angle from the Street
Figure 3. Main Entrance Opening onto a Porch
B. Unit definition. Each townhouse must include at least one of the following on at least one street-facing façade (see Figure 4):
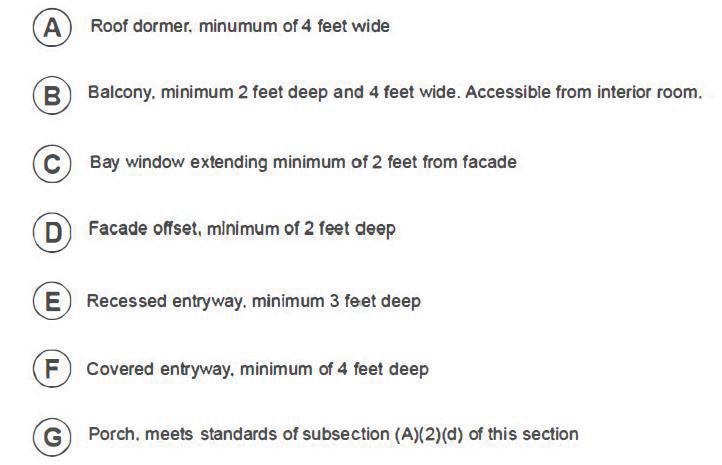
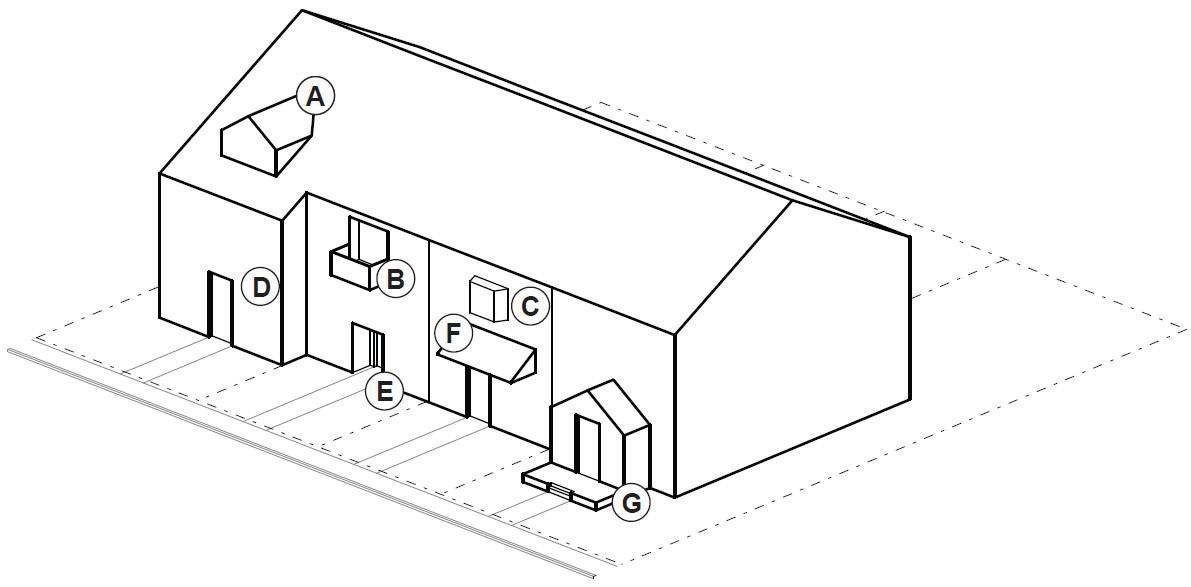
1. A roof dormer a minimum of 4 feet in width, or
2. A balcony a minimum of 2 feet in depth and 4 feet in width and accessible from an interior room, or
3. A bay window that extends from the facade a minimum of 2 feet, or
4. An offset of the facade of a minimum of 2 feet in depth, either from the neighboring townhouse or within the façade of a single townhouse, or
5. An entryway that is recessed a minimum of 3 feet, or
6. A covered entryway with a minimum depth of 4 feet, or
7. A porch meeting the standards of subsection (A)(2)(d) of this section. Balconies and bay windows may encroach into a required setback area.
51
CHAPTER 8 DEVELOPMENT REGULATIONS
Figure 4. Townhouse Unit Definition
C. Windows. A minimum of 15 percent of the area of all street-facing facades on each individual unit must include windows or entrance doors. Half of the window area in the door of an attached garage may count toward meeting this standard. See Figure 5.
D. Driveway Access and Parking. Townhouses with frontage on a public street shall meet the following standards:
1. Garages on the front façade of a townhouse, off-street parking areas in the front yard, and driveways in front of a townhouse are allowed if they meet the following standards (see Figure 6).
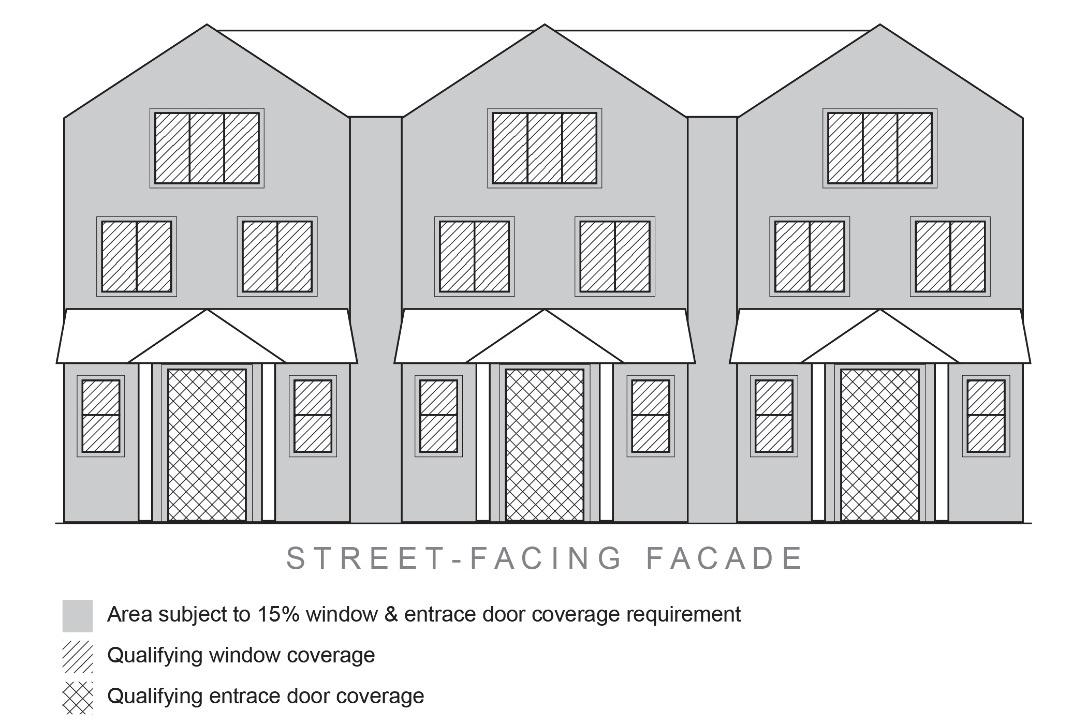
a. Each townhouse lot has a street frontage of at least 15 feet on a local street.
b. A maximum of one (1) driveway approach is allowed for every townhouse. Driveway approaches and/or driveways may be shared.
c. Outdoor on-site parking and maneuvering areas do not exceed 12 feet wide on any lot.
d. The garage width does not exceed 12 feet, as measured from the inside of the garage door frame.
CHAPTER 8 DEVELOPMENT REGULATIONS 52
Figure 5. Window Coverage
a. Off-street parking areas shall be accessed on the back façade or located in the rear yard. No off-street parking shall be allowed in the front yard or side yard of a townhouse.
b. A townhouse project that includes a corner lot shall take access from a single driveway approach on the side of the corner lot. See Figure 7.
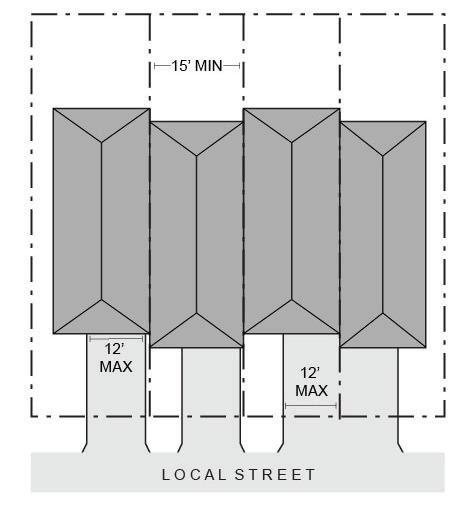
CHAPTER 8 DEVELOPMENT REGULATIONS 53
Figure 6. Townhouses with Parking in Front Yard
2. The following standards apply to driveways and parking areas for townhouse projects that do not meet all of the standards in subsection (1).
c. Townhouse projects that do not include a corner lot shall consolidate access for all lots into a single driveway. The driveway and approach are not allowed in the area directly between the front façade and front lot line of any of the townhouses. See Figure 8.
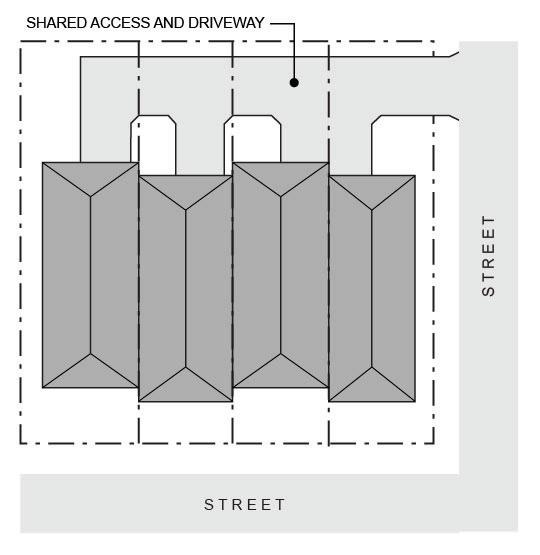
CHAPTER 8 DEVELOPMENT REGULATIONS 54
Figure 7. Townhouses on Corner Lot with Shared Access
d. A townhouse project that includes consolidated access or shared driveways shall grant access easements to allow normal vehicular access and emergency access.
3. Townhouse projects in which all units take exclusive access from a rear alley are exempt from compliance with subsection (2).
E. Screen of Mechanical Equipment. All exterior ground mounted mechanical equipment located forward from the line of the front façade (living space and garage) of the building shall be screened from the street at the ground/eye level line of sight by use of landscaping materials such as shrubs and trees or fencing at least three (3) feet in height at installation. Solar power, wind power, and satellite dishes necessitating placement on walls or roofs for normal operation are exempt from this provision.
F. Landscaping. Landscaping standards are as follows:
1. On all lots which new townhouses are constructed, landscaping shall be installed between the corresponding façade(s) of the structure and the edge of the street(s), public or private, for the entire length of the street frontage(s).
2. Required landscaping can include, but is not limited to, a combination of the following materials: living plant material such as trees, shrubs, flowers, and lawn (can include artificial turf); and non-living materials such as walkways and courtyards consisting of brick, concrete, asphalt, decorative rock, or other approved materials. Applicable landscaping requirements are subject to the following: a. Xeriscaping is encouraged. The minimum required allowance for plantings shall be 25%. Rock, rock gardens and bark areas without plantings do not
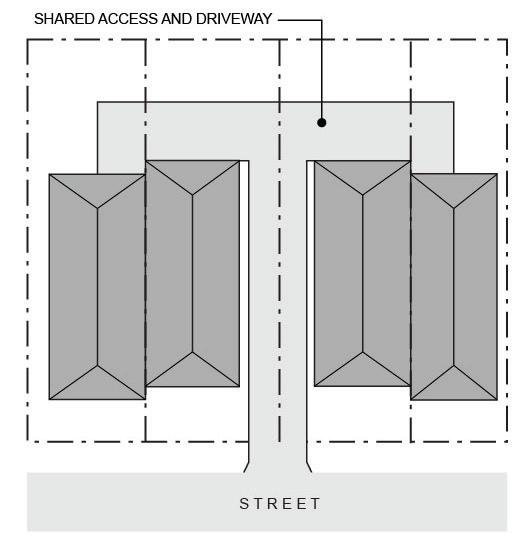
CHAPTER 8 DEVELOPMENT REGULATIONS 55
Figure 8. Townhouses with Consolidated Access
b. The use of gravel is limited to spaces specified for the parking of RVs.
c. Areas of exposed dirt are not allowed. qualify as landscaping or xeriscaping.
3. Street trees are required to be installed on all residential lots fronting on public or private streets, including lots already platted at the time of adoption of this ordinance, but not yet developed. Additional standards are located in Section 8.3035.5.K.
a. Flag lots shall be exempt from street tree requirements unless the frontage portion of the flag lot is 30’ or greater.
4. All landscaping and street tree installation shall be completed prior to issuance of a Certificate of Occupancy G. Fences. See Section 8.0340.
[Section 8.0142 added by Ord. #2018-09 passed September 11, 2018]
[Section 8.0142 amended by Ord. #2020-15 passed November 10, 2020]
[Section 8.0142 “Architectural Design Standards for Multi Family Structures with 5 or more attached units” repealed in its entirety and replaced with Section 8.0142 “Townhouse Development and Design Standards by Ord. #2022-04 passed June 28, 2022]
[Section 8.0142 amended by Ord. #2022-09 passed December 13, 2022]
8.0143 Cottage Cluster Development and Design Standards.
1. Procedure. New cottage clusters shall be reviewed for conformance with the requirements listed in this Section.
2. Table A: Minimum Standards.
56
CHAPTER 8 DEVELOPMENT REGULATIONS
Lot Width Number of Street Trees Required Corner Lot Tree requirements will be based on each street frontage length. 50 feet and less 1 51-100 feet 2 101-150 feet 3 151 feet and more One tree/40 feet of width fronting street.
Standard: R-1 R-2 R-3, R-3A R-4 R-5 Maximum Density (Units/Net Acre N/A N/A N/A N/A N/A Minimum Lot Size (Square Feet) 9,000 9,000 7,500 7,000 7,000 Maximum Building Height 25 feet Minimum Setback Distance (Feet) Front 10 10 10 10 10 Side 5 5 5 5 5 Rear 10 10 10 10 10
3. Building Separation. Cottages shall be separated by a minimum distance of six (6) feet. The minimum distance between all other structures, including accessory structures, shall be in accordance with building code requirements.
4. Unit Size.
A. The maximum building footprint for a cottage is 900 square feet.
B. The maximum average floor area for a cottage cluster is 1,400 square feet per dwelling unit. Community buildings shall be included in the average floor area calculation for a cottage cluster.
5. Cluster Size.
A. Cottage clusters must include a minimum of four units per cluster.
B. A cottage cluster may include up to a maximum of 12 cottages per common courtyard. More than one cottage cluster may be permitted on a site.
6. Off-Street Parking. Cottages shall meet the off-street parking requirements of Section 8.0500.
7. Design Standards. New cottage clusters shall meet the design standards in subsections A through H of this section.
A. Cottage Orientation. Cottages must be clustered around a common courtyard, meaning they abut the associated common courtyard or are directly connected to it by a pedestrian path, and must meet the following standards (see Figure 1):
1. Each cottage within a cluster must either abut the common courtyard or must be directly connected to it by a pedestrian path.
2. A minimum of 50 percent of cottages within a cluster must be oriented to the common courtyard and must:
a. Have a main entrance facing the common courtyard;
b. Be within 10 feet from the common courtyard, measured from the façade of the cottage to the nearest edge of the common courtyard; and
c. Be connected to the common courtyard by a pedestrian path.
3. Cottages within 20 feet of a street property line may have their entrances facing the street.
4. Cottages not facing the common courtyard, or the street, must have their main entrances facing a pedestrian path that is directly connected to the common courtyard.
B. Common Courtyard Design Standards. Each cottage cluster must share a common courtyard in order to provide a sense of openness and community of residents. Common courtyards must meet the following standards (see Figure 1):
1. The common courtyard must be a single, contiguous piece.
2. Cottages must abut the common courtyard on at least two sides of the courtyard.
3. The common courtyard must contain a minimum of 150 square feet per cottage within the associated cluster (as defined in subsection A of this section 6).
4. The common courtyard must be a minimum of 15 feet wide at its narrowest dimension.
5. The common courtyard shall be developed with a mix of landscaping, lawn area, pedestrian paths, and/or paved courtyard area, and may also include recreational amenities. Impervious elements of the common courtyard shall not exceed 75 percent of the total common courtyard area.
CHAPTER 8 DEVELOPMENT REGULATIONS 57
6. Pedestrian paths must be included in a common courtyard. Paths that are contiguous to a courtyard shall count toward the courtyard’s minimum dimension and area. Parking areas, required setbacks, and driveways do not qualify as part of a common courtyard.
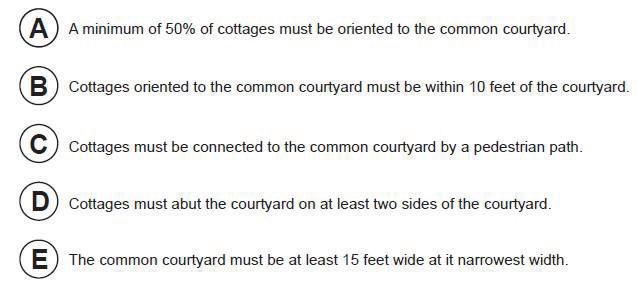
C. Community Buildings. Cottage cluster projects may include community buildings for the shared use of residents that provide space for accessory uses such as community meeting rooms, guest housing, exercise rooms, day care, or
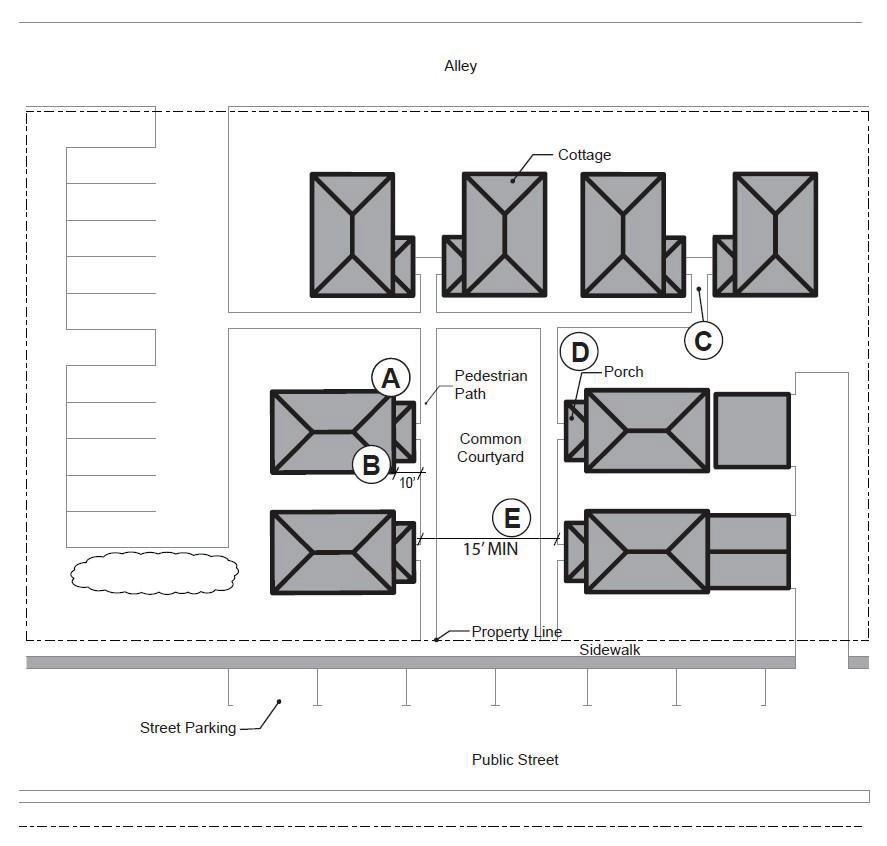
58
CHAPTER 8 DEVELOPMENT REGULATIONS
Figure 1. Cottage Cluster Orientation and Common Courtyard Standards
community eating areas. Community buildings must meet the following standards:
1. Each cottage cluster is permitted one community building, which shall count towards the maximum average floor area, pursuant to section 4.
2. A community building that meets the development code’s definition of a dwelling unit must meet the maximum 900 square foot footprint limitation that applies to cottages, unless a covenant is recorded against the property stating that the structure is not a legal dwelling unit and will not be used as a primary dwelling.
D. Pedestrian Access.
1. An accessible pedestrian path must be provided that connects the main entrance of each cottage to the following:
a. The common courtyard;
b. Shared parking areas;
c. Community buildings; and
d. Sidewalks in public rights-of-way abutting the site or rights-of-way if there are no sidewalks.
2. The pedestrian path must be hard-surfaced and a minimum of four (4) feet wide.
E. Facades. Cottages must meet the architectural design standards for singlefamily detached dwellings in Section 8.0141(5).B.1 through 4.
F. Parking Design. (See Figure 2).
1. Clustered parking. Off-street parking may be arranged in clusters, subject to the following standards:
a. Cottage cluster projects with fewer than 16 cottages are permitted parking clusters of not more than five (5) contiguous spaces.
b. Parking clusters must be separated from other spaces by at least four (4) feet of landscaping.
c. Clustered parking areas may be covered.
2. Parking location and access.
a. Off-street parking spaces and vehicle maneuvering areas shall not be located:
i. Within 20 feet from any street property line, except alley property lines;
ii. Between a street property line and the front façade of cottages located closest to the street property line. This standard does not apply to alleys.
b. Off-street parking spaces shall not be located within 10 feet of any other property line, except alley property lines. Driveways and drive aisles are permitted within 10 feet of other property lines.
3. Screening. Landscaping, fencing, or walls at least three feet tall shall separate clustered parking areas and parking structures from common courtyards and public streets.
4. Garages and carports.
a. Garages and carports (whether shared or individual) must not abut common courtyards.
b. Individual attached garages up to 200 square feet shall be exempted from the calculation of maximum building footprint for cottages.
c. Individual detached garages must not exceed 400 square feet in floor area.
CHAPTER 8 DEVELOPMENT REGULATIONS 59
CHAPTER 8 DEVELOPMENT REGULATIONS
d. Garage doors for attached and detached individual garages must not exceed 20 feet in width
G. Accessory Structures. Accessory structures must not exceed 400 square feet in floor area.
H. Existing Structures. On a lot or parcel to be used for a cottage cluster project, an existing single-family detached dwelling on the same lot at the time of proposed development of the cottage cluster may remain within the cottage cluster project area under the following conditions:
1. The existing dwelling may be non-conforming with respect to the requirements of this code.
2. The existing dwelling may be expanded up to a maximum height of 25 feet or the maximum building footprint of 900 square feet; however, existing dwellings that exceed the maximum height and/or footprint of this code may not be expanded.
3. The floor area of the existing dwelling shall not count towards the maximum average floor area of a cottage cluster.
4. The existing dwelling shall be excluded from the calculation of orientation toward the common courtyard, per subsection (6)(A).
60

CHAPTER 8 DEVELOPMENT REGULATIONS 61
Figure 2. Cottage Cluster Parking Design Standards
[Section 8.0143 added by Ord. #2022-04 passed June 28, 2022]
[Section 8.0143 amended by Ord. #2022-09 passed December 13, 2022]