


Subject Property: 4422 S Hwy 97|Redmond, Oregon | 97756 Tax Lot # 151329CD01600 Prepared By: Danetta Rider 845 SW Veterans Way Redmond, OR 97760 Office: 541-527-1274 Email: danettar@deschutestitle.com “Service is the Difference” Property Development Packet DISCLAIMER: Deschutes County Title has provided this information as a courtesy and assumes no liability for errors, omissions, or the accuracy of the data and does not warranty the fitness of this product for any particular purpose. Bend 397 SW Upper Terrace Dr Bend, Oregon 97702 Office: 541.389.2120 Fax: 541.389.2180 Redmond 845 SW Veterans Way Redmond, Oregon 97756 Office: 541.527.1274 Fax: 541.527.1281 La Pine 51515 Huntington Rd La Pine, Oregon 97739 Office: 541.876.6990 Fax: 541.876.2740 St Helens 240 South First Street St. Helens, Oregon 97051 Office: 503.397.2587 Fax: 503.366.1708 Prepared for Jenifer Holland holland.re.jen@gmail.com (541) 640-1462
DESCHUTESCOUNTYPROPERTYPROFILEINFORMATION
Parcel#:130165
TaxLot:151329CD01600
Owner:Evans,RyanS
CoOwner:Evans,JodyD
Site:4422SHwy97
RedmondOR97756
Mail:POBox240
RedmondOR97756
LandUse:300-Industrial-Vacant
StdLandUse:RMSC-ResidentialMiscellaneous
Legal:
Twn/Rng/Sec:T:15SR:13ES:29Q:SWQQ:SE
ASSESSMENT&TAXINFORMATION
MarketTotal:$194,350.00
MarketLand:$194,350.00
MarketImpr:
AssessmentYear:2022
AssessedTotal:$30,590.00
Exemption:
Taxes:$586.05
LevyCode:2-001
LevyRate:19.1581
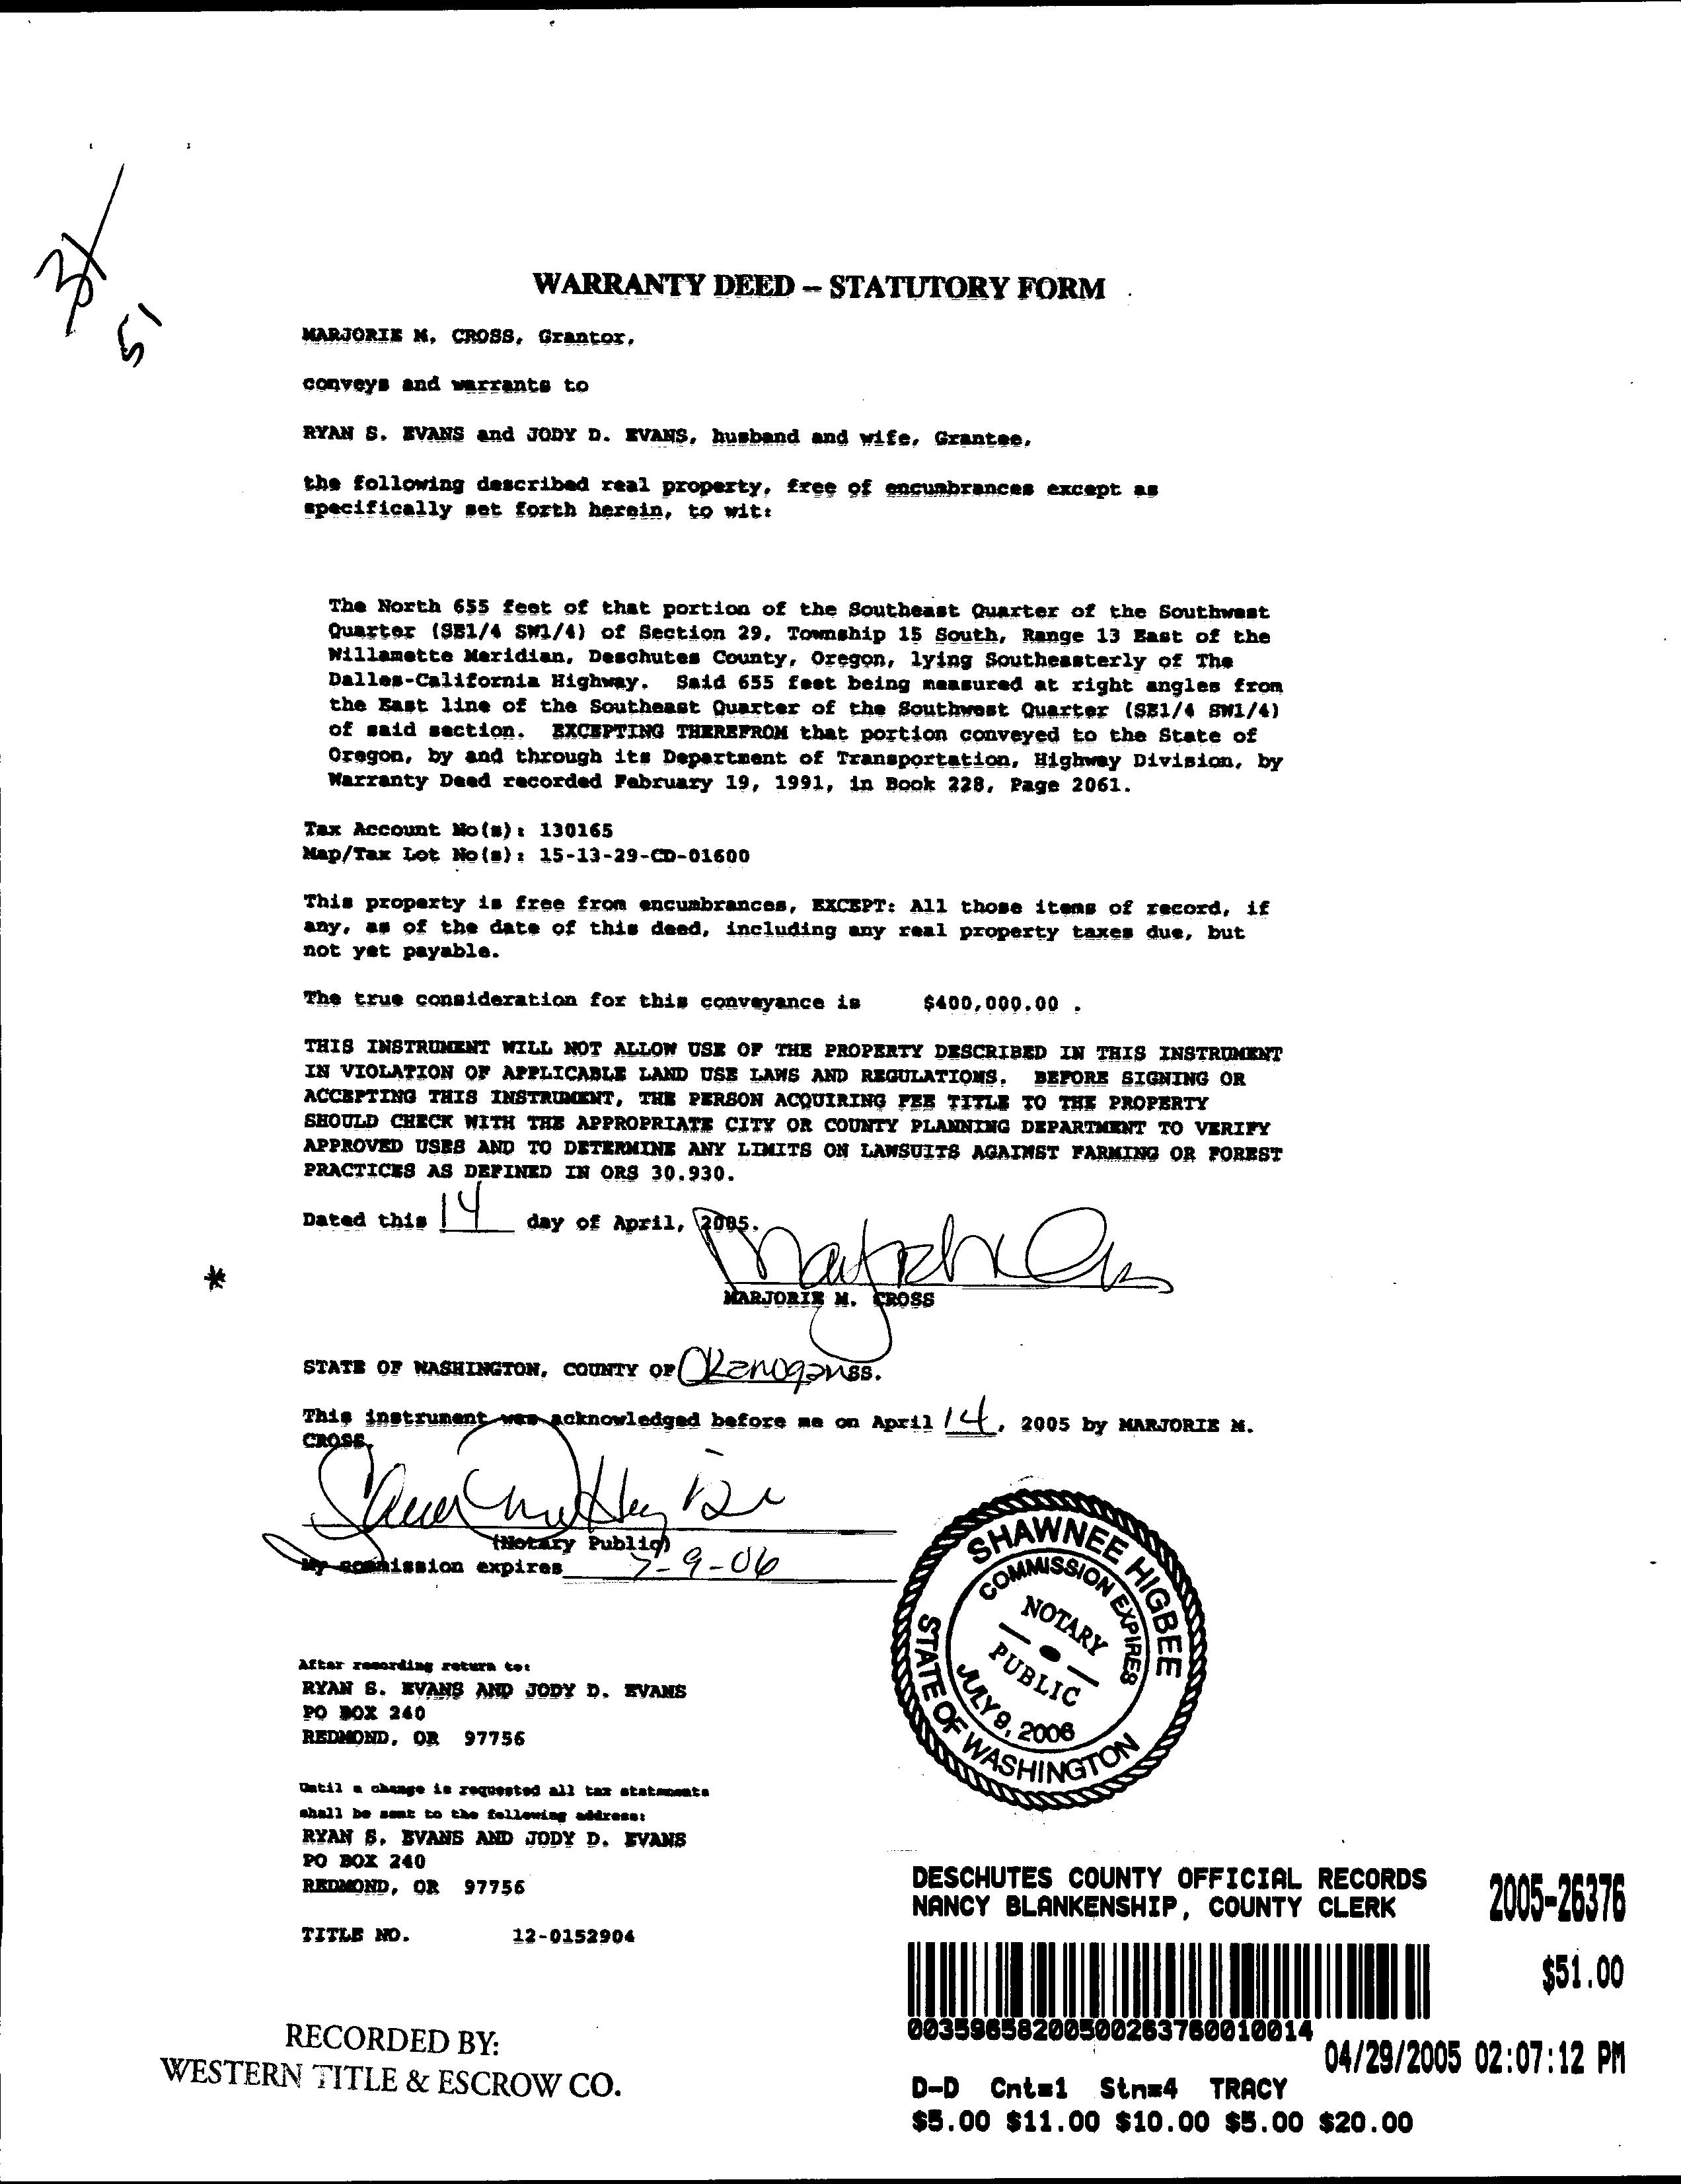
SALE&LOANINFORMATION
SaleDate:04/29/2005
SaleAmount:$400,00000
Document#:26376
DeedType:Deed
LoanAmount:$380,00000
Lender:PRIVATEINDIVIDUAL
LoanType:PrivatePartyLender
InterestType:FIX
TitleCo:WESTERNTITLE&ESCROWCO

YearBuilt:
EffYearBuilt:
Bedrooms:
Bathrooms:
#ofStories:
TotalSqFt:
Floor1SqFt:
Floor2SqFt:
BasementSqFt:
PROPERTYCHARACTERISTICS
Lotsize:2.80Acres(122,085SqFt)
GarageSqFt:
GarageType:
AC:
Pool:
HeatSource: Fireplace:
BldgCondition:
Neighborhood:
Lot:
Block:
Plat/Subdiv:N/A
Zoning:M1-LightIndustrial
SchoolDist:2J-Redmond
Census:1028-001001
Recreation:
SentryDynamics,Inc anditscustomersmakenorepresentations,warrantiesorconditions,expressorimplied,astotheaccuracyorcompletenessofinformationcontainedinthis report
Deschutes County Property Information

Report Date: 9/13/2023 8:24:34 AM
Disclaimer
The information and maps presented in this report are provided for your convenience. Every reasonable effort has been made to assure the accuracy of the data and associated maps. Deschutes County makes no warranty, representation or guarantee as to the content, sequence, accuracy, timeliness or completeness of any of the data provided herein. Deschutes County explicitly disclaims any representations and warranties, including, without limitation, the implied warranties of merchantability and fitness for a particular purpose. Deschutes County shall assume no liability for any errors, omissions, or inaccuracies in the information provided regardless of how caused. Deschutes County assumes no liability for any decisions made or actions taken or not taken by the user of this information or data furnished hereunder.
Account Summary
Account Information Ownership
EVANS, RYAN S & JODY D
Mailing
EVANS, RYAN S & JODY D PO BOX 240
REDMOND, OR 97756
4422 S HWY 97, REDMOND, OR 97756
Subdivision:
Block: Lot:
Property Class: 300 -- INDUSTRIAL
Warnings, Notations, and Special Assessments
Current Assessed Values:
Maximum Assessed Assessed Value
Veterans Exemption
Review of digital records maintained by the Deschutes County Assessor’s Office, Tax Office, Finance Office, and the Community Development Department indicates that there are no special tax, assessment or property development related notations associated with this account. However, independent verification of the presence of other Deschutes County tax, assessment, development, and additional property related considerations is recommended. Confirmation is commonly provided by title companies, real estate agents, developers, engineering and surveying firms, and other parties who are involved in property transactions or property development. In addition, County departments may be contacted directly to discuss the information.
Tax
130165
Address: Map and Taxlot: Account: Situs Address: Mailing Name:
Status: 151329CD01600
Assessable
Property Taxes Assessment Tax Code Area: Current Tax Year: 2001 $586.05 2.77
$194,350 $0 Land Structures Total
Assessor Acres:
Valuation
$194,350 Real Market Values as of Jan. 1, 2022 $30,590 $30,590
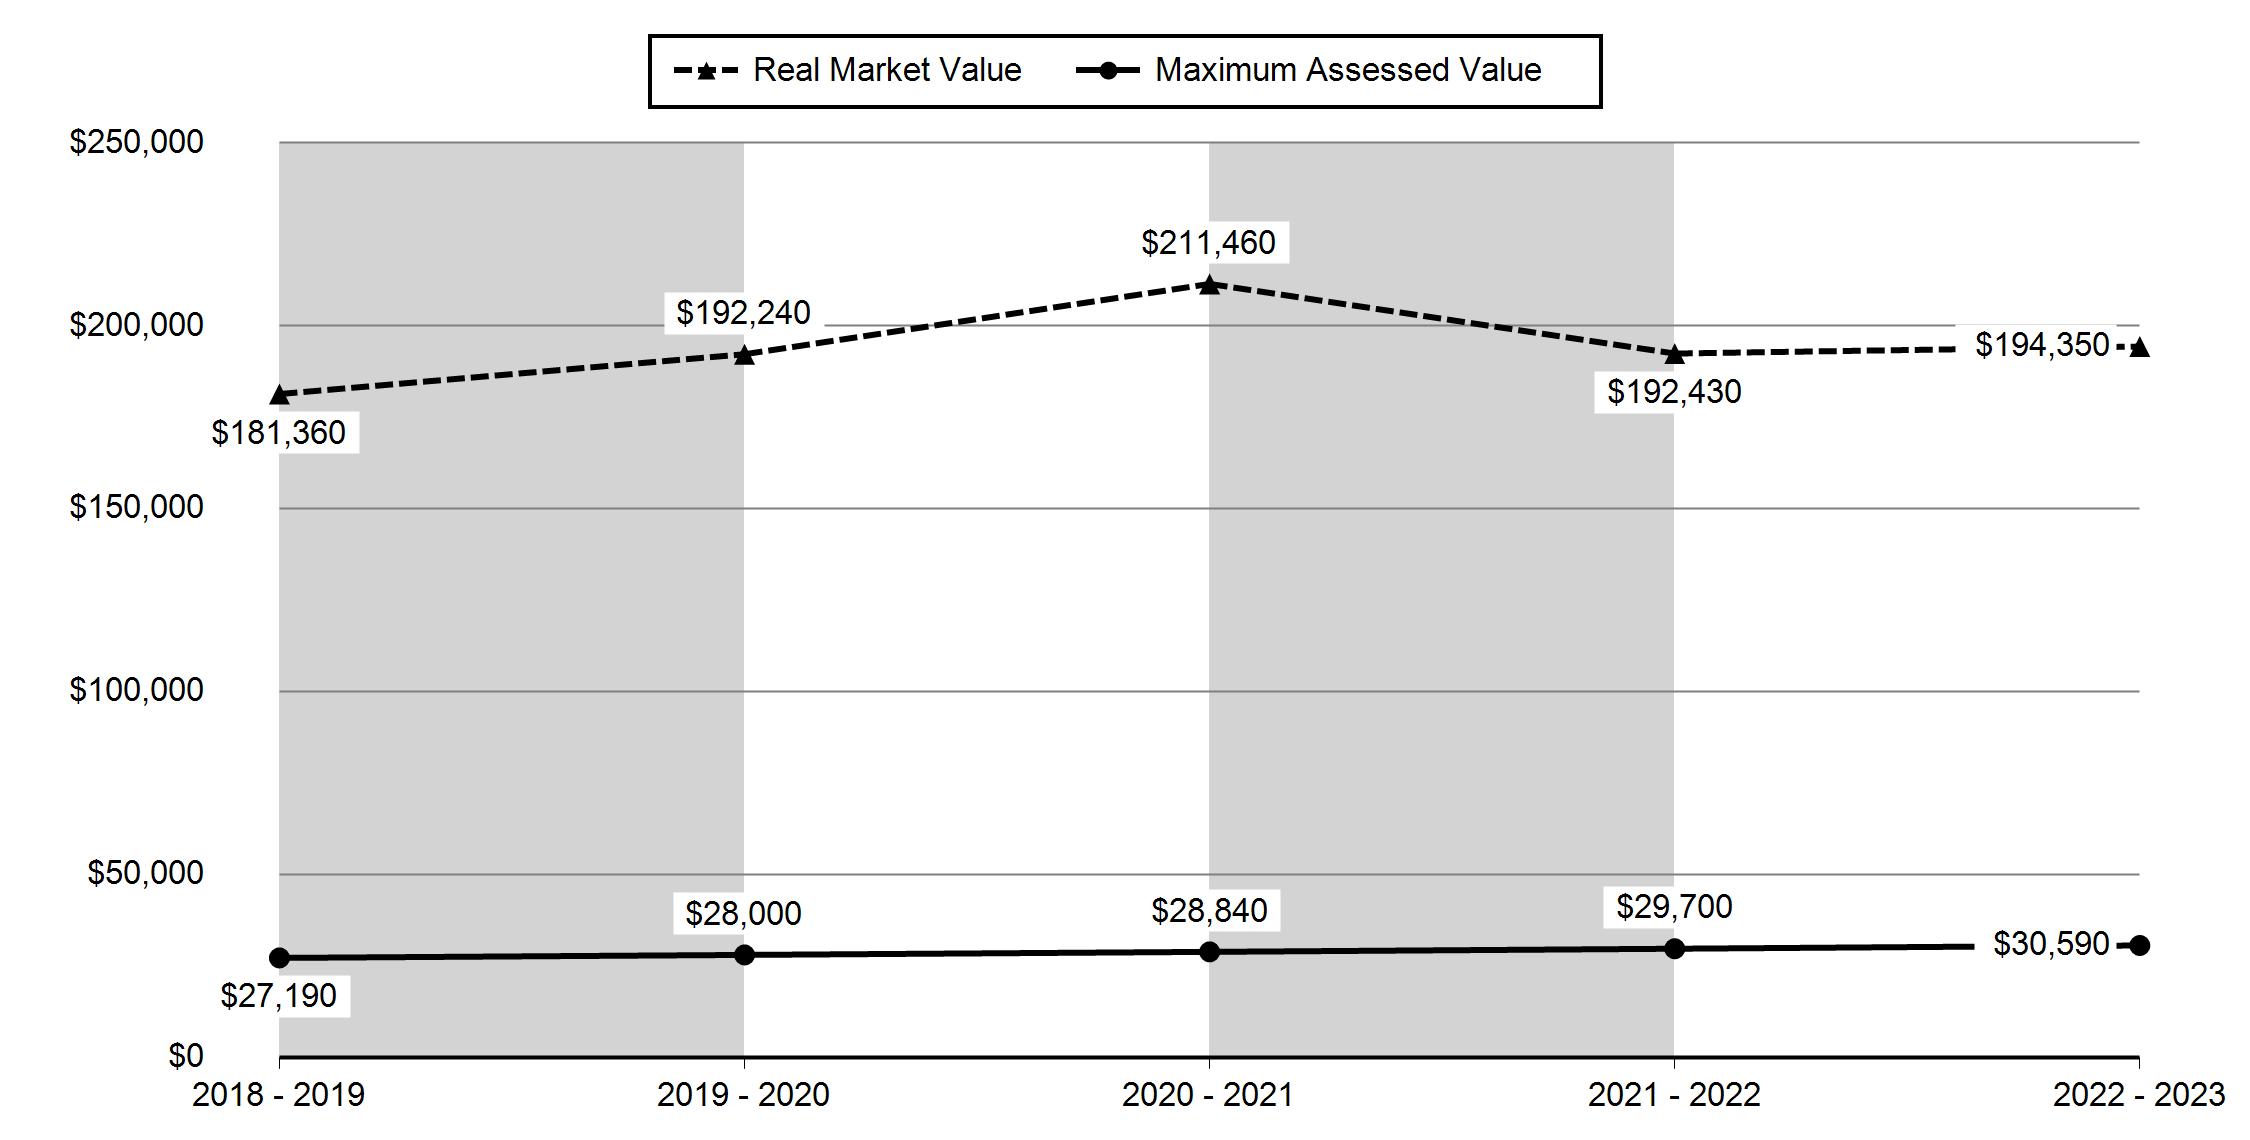
2018 - 2019 2019 - 2020 2020 - 2021 2021 - 2022 2022 - 2023 Real Market Value - Land $181,360 $192,240 $211,460 $192,430 $194,350 Real Market Value - Structures $0 $0 $0 $0 $0 Total Real Market Value $181,360 $192,240 $211,460 $192,430 $194,350 Maximum Assessed Value $27,190 $28,000 $28,840 $29,700 $30,590 Total Assessed Value $27,190 $28,000 $28,840 $29,700 $30,590 Veterans Exemption $0 $0 $0 $0 $0 Valuation History All values are as of January 1 of each year. Tax year is July 1st through June 30th of each year. Deschutes County Property Information Report, page 1
Tax Payment History
Sales History
Year Date Due Transaction Type Transaction Date As Of Date Amount Received Tax Due Discount Amount Interest Charged Refund Interest 2022 11-15-2022 PAYMENT 03-10-2023 03-10-2023 $5.03 ($4.84) $0.00 $0.19 $0.00 2022 11-15-2022 IMPOSED 10-12-2022 11-15-2022 $0.00 $586.05 $0.00 $0.00 $0.00 Total: $581.21 2021 11-15-2021 PAYMENT 03-10-2023 03-10-2023 $644.97 ($549.69) $0.00 $95.28 $0.00 2021 11-15-2021 IMPOSED 10-11-2021 11-15-2021 $0.00 $549.69 $0.00 $0.00 $0.00 Total: $0.00 2020 11-15-2020 WRITE OFF 05-18-2022 05-18-2022 $0.00 ($1.23) $0.00 $0.00 $0.00 2020 11-15-2020 PAYMENT 11-24-2021 11-22-2021 $200.00 ($182.60) $0.00 $17.40 $0.00 2020 11-15-2020 PAYMENT 05-27-2021 05-27-2021 $174.97 ($166.11) $0.00 $8.86 $0.00 2020 11-15-2020 PAYMENT 11-12-2020 11-12-2020 $174.97 ($174.97) $0.00 $0.00 $0.00 2020 11-15-2020 IMPOSED 10-09-2020 11-15-2020 $0.00 $524.91 $0.00 $0.00 $0.00 Total: $0.00
Sale Date Seller Buyer Sale Amount Sale Type Recording Instrument 04/14/2005 CROSS,MARJORIE M EVANS, RYAN S & JODY D $400,000 26-NEW CONSTRUCTION OR NEW PROPERTY 2005-26376 01/03/2000 KEECO INC $255,000 07-INTEREST TRANSFERRED IS PARTIAL/UNDIVIDED/TIMESH ARE 2000-152 10/24/1998 RYAN,JOHN C KEECO INC $400,000 26-NEW CONSTRUCTION OR NEW PROPERTY 1998-5200832 11/10/1992 POTTHOFF CARL H RYAN,JOHN C $70,000 21-PROPERTY SOLD NOT SAME AS ASSESSED 1992-2831546
No Structures Found. Deschutes County Property Information Report, page 2 (For Report Disclaimer see page 1)
Land Characteristics
Related accounts apply to a property that may be on one map and tax lot but due to billing have more than one account. This occurs when a property is in multiple tax code areas. In other cases there may be business personal property or a manufactured home on this property that is not in the same ownership as the land.
Service Providers Please contact districts to confirm.
Land Description Acres Land Classification Industrial Lot 2.77 Ownership Name Type Name Ownership Type Ownership Percentage OWNER EVANS, RYANS OWNER 100.00% HUSBAND AND WIFE~EVANS, JODY D OWNER EVANS, JODYD OWNER 100.00% HUSBAND AND WIFE~EVANS, RYAN S Account ID Owner Name Record Type 195063 (A1) MEADOW OUTDOOR ADVERTISING Real Property
Related Accounts Category Name Phone Address COUNTY SERVICES DESCHUTES COUNTY (541) 388-6570 1300 NW WALL ST, BEND, OR 97703 FIRE DISTRICT REDMOND FIRE AND RESCUE (541) 504-5000 341 NW DOGWOOD AVE, REDMOND, OR 97756 SCHOOL DISTRICT REDMOND SCHOOL DISTRICT (541) 923-5437 145 SE SALMON AVE, REDMOND, OR 97756 ELEMENTARY SCHOOL ATTENDANCE AREA SAGE ELEMENTARY SCHOOL (541) 316-2830 2790 SW WICKIUP, REDMOND, OR 97756 MIDDLE SCHOOL ATTENDANCE AREA OBSIDIAN MIDDLE SCHOOL (541) 923-4900 1335 SW OBSIDIAN, REDMOND, OR 97756 HIGH SCHOOL ATTENDANCE AREA RIDGEVIEW HIGH SCHOOL (541) 504-3600 4555 SW ELKHORN AVE, REDMOND, OR 97756 EDUCATION SERVICE TAX DISTRICT HIGH DESERT EDUCATION SERVICE DISTRICT (541) 693-5600 145 SE SALMON AVE, REDMOND, OR 97756 COLLEGE TAX DISTRICT CENTRAL OREGON COMMUNITY COLLEGE (541) 383-7700 2600 NW COLLEGE WAY, BEND, OR 97703 PARK & RECREATION DISTRICT REDMOND AREA PARK & RECREATION DISTRICT (541) 548-7275 465 SW RIMROCK DR, REDMOND, OR 97756 LIBRARY DISTRICT DESCHUTES PUBLIC LIBRARY (541) 617-7050 601 NW WALL ST, BEND, OR 97703 WATER SERVICE PROVIDER REDMOND WATER DEPARTMENT (541) 504-2000 423 E ANTLER AVE #100, REDMOND, OR 97756 GARBAGE & RECYCLING SERVICE HIGH COUNTRY DISPOSAL (541) 548-4984 1090 NE HEMLOCK AVE, REDMOND, OR 97756
Deschutes County Property Information Report, page 3 (For Report Disclaimer see page 1)
STATEMENT OF TAX ACCOUNT
2022 ADVALOREM $632.72 $581.21 $51.51 $0.00 $586.05 Nov 15, 2022 2021 ADVALOREM $0.00 $0.00 $0.00 $0.00 $549.69 Nov 15, 2021 2020 ADVALOREM $0.00 $0.00 $0.00 $0.00 $524.91 Nov 15, 2020 2019 ADVALOREM $0.00 $0.00 $0.00 $0.00 $501.98 Nov 15, 2019 2018 ADVALOREM $0.00 $0.00 $0.00 $0.00 $489.58 Nov 15, 2018 2017 ADVALOREM $0.00 $0.00 $0.00 $0.00 $477.97 Nov 15, 2017 2016 ADVALOREM $0.00 $0.00 $0.00 $0.00 $471.53 Nov 15, 2016 2015 ADVALOREM $0.00 $0.00 $0.00 $0.00 $457.24 Nov 15, 2015 2014 ADVALOREM $0.00 $0.00 $0.00 $0.00 $445.28 Nov 15, 2014 2013 ADVALOREM $0.00 $0.00 $0.00 $0.00 $432.91 Nov 15, 2013 2012 ADVALOREM $0.00 $0.00 $0.00 $0.00 $429.90 Nov 15, 2012 2011 ADVALOREM $0.00 $0.00 $0.00 $0.00 $409.74 Nov 15, 2011 2010 ADVALOREM $0.00 $0.00 $0.00 $0.00 $394.85 Nov 15, 2010 2009 ADVALOREM $0.00 $0.00 $0.00 $0.00 $388.86 Nov 15, 2009 2008 ADVALOREM $0.00 $0.00 $0.00 $0.00 $347.11 Nov 15, 2008 2007 ADVALOREM $0.00 $0.00 $0.00 $0.00 $334.81 Nov 15, 2007 2006 ADVALOREM $0.00 $0.00 $0.00 $0.00 $331.26 Nov 15, 2006 2005 ADVALOREM $0.00 $0.00 $0.00 $0.00 $331.34 Nov 15, 2005 2004 ADVALOREM $0.00 $0.00 $0.00 $0.00 $248.93 Nov 15, 2004 2003 ADVALOREM $0.00 $0.00 $0.00 $0.00 $232.29 Nov 15, 2003 2002 ADVALOREM $0.00 $0.00 $0.00 $0.00 $223.41 Nov 15, 2002 2001 ADVALOREM $0.00 $0.00 $0.00 $0.00 $214.13 Nov 15, 2001 2000 ADVALOREM $0.00 $0.00 $0.00 $0.00 $210.48 Nov 15, 2000 1999 ADVALOREM $0.00 $0.00 $0.00 $0.00 $207.05 Nov 15, 1999 1998 ADVALOREM $0.00 $0.00 $0.00 $0.00 $199.60 Nov 15, 1998 1997 ADVALOREM $0.00 $0.00 $0.00 $0.00 $199.89 Dec 15, 1997 1996 ADVALOREM $0.00 $0.00 $0.00 $0.00 $619.05 Nov 15, 1996
DESCHUTES COUNTY TAX COLLECTOR DESCHUTES SERVICES BUILDING BEND OR 97703 (541) 388-6540 EVANS, RYAN S & JODY D PO BOX 240 REDMOND OR 97756 13-Sep-2023 130165 Tax Account # Account Status Roll Type Situs Address A Real 4422 S HWY 97 REDMOND 97756 Tax Summary Tax Year Tax Type Total Due Current Due Interest Due Discount Available Original Due Due Date 2001 Sep 13, 2023 Lender Name Loan Number Property ID Interest To $632.72 $581.21 $51.51 $0.00 Total Deschutes County Property Information Report, page 4 (For Report Disclaimer see page 1)
REAL PROPERTY TAX STATEMENT
JULY 1, 2022 TO JUNE 30, 2023
DESCHUTES COUNTY, OREGON - 1300 NW WALL ST STE 203, BEND, OR 97703
TAX BY DISTRICT
TAX ACCOUNT: 130165
PROPERTY DESCRIPTION
CODE: 2001
SITUS ADDRESS: MAP: 300 CLASS: 151329-CD-01600
LEGAL:
4422 S HWY 97 REDMOND
Full Payment with 3% Discount
Discount is lost after due date and interest may apply
PAYMENT OPTIONS:
* Online
www.deschutes.org/tax
* By Mail to Deschutes County Tax, PO Box 7559 Bend OR 97708-7559
* Drop Box located at 1300 NW Wall Street, Bend or 411 SW 9th Street, Redmond * In Person 1300 NW Wall Street, Ste 203, Bend (2nd Floor)
Please include this coupon with payment. Please do not staple, paper clip or tape your payment.
Please select payment option
Full Payment (3% Discount)
No Additional Payment Due
Two-Thirds Payment (2% Discount)
Next Payment Due
One-Third Payment (No Discount)
Next Payment Due
Payment Due November 15, 2022
TAX ACCOUNT: 130165
(Mailing address change form on reverse)
AMOUNT ENCLOSED $
Please make checks payable to Deschutes County Tax Collector
REAL
LAND STRUCTURES TOTAL
TOTAL
VETERAN'S EXEMPTION NET TAXABLE: TOTAL PROPERTY TAX: LAST YEAR THIS YEAR 192,430 0 192,430 194,350 0 194,350 29,700 0 29,700 549.69 30,590 0 30,590 586.05 TAX QUESTIONS ASSESSMENT QUESTIONS (541) 388-6540 (541) 388-6508
VALUES:
MARKET (RMV)
RMV
ASSESSED VALUE
$1,184.13
05/15/23 02/15/23 $811.01 $998.55 $1,184.13
09100001301650000081101000009985500001184134 30,590 29,700 MAXIMUM ASSESSED VALUE
Change my Mailing Address EVANS, RYAN S & JODY D PO BOX 240 REDMOND OR 97756 Deschutes County Tax Collector PO Box 7559 Bend OR 97708-7559
D
BOX
REDMOND OR 97756
EVANS, RYAN S & JODY
PO
240
For Property Information: dial.deschutes.org SCHOOL DISTRICT #2J 142.53 C O C C 17.60 HIGH DESERT ESD 2.74 EDUCATION TOTAL: 162.87 DESCHUTES COUNTY 34.56 COUNTY LIBRARY 15.60 COUNTYWIDE LAW ENFORCEMENT 29.79 COUNTY EXTENSION/4H 0.64 9-1-1 10.26 CITY OF REDMOND 125.09 REDMOND DWNTWN URBAN RENEWAL 29.33 REDMOND SOUTH 97 URBAN RENEWAL 5.11 REDMOND FIRE & RESCUE 49.76 REDMOND FIRE & RESCUE LOCAL OPTION 8.26 REDMOND AREA PARK & REC DISTRICT 10.54 GENERAL GOVT TOTAL: 318.94 COUNTY LIBRARY BOND 10.32 CITY OF REDMOND BOND 2022 22.12 SCHOOL #2J BOND 2004 22.95 SCHOOL #2J BOND 2008 39.37 SCHOOL #2J BOND 2021 7.13 C O C C BOND 2.35 BONDS - OTHER TOTAL: 104.24 DELINQUENT TAXES: 2021-22 TAX AND INTEREST DUE 615.66 Deschutes County Property Information Report, page 5 (For Report Disclaimer see page 1)
Deschutes County Property Information Report, page 6 (For Report Disclaimer see page 1)
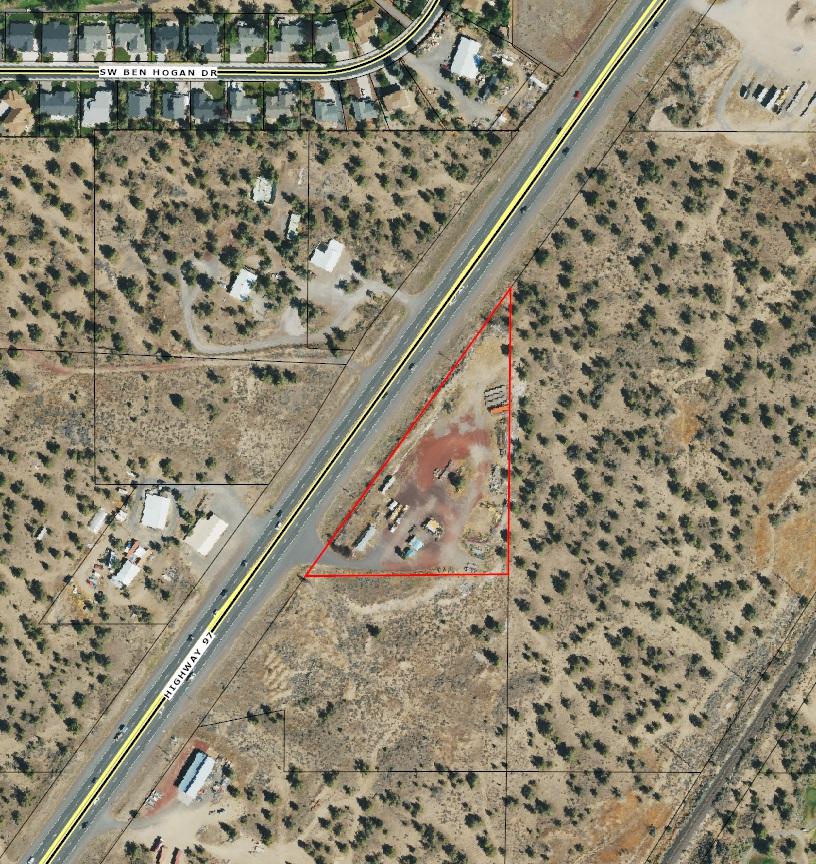
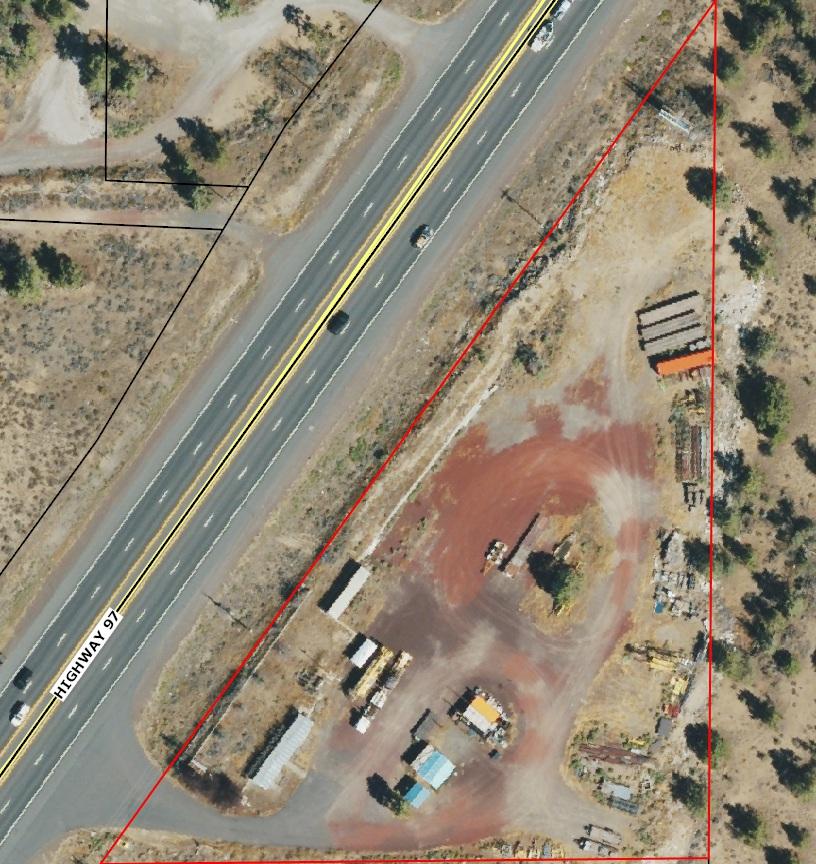
AerialMap
ParcelID:130165
TaxAccount#:151329CD01600
4422SHwy97, RedmondOR97756
Thismap/plat isbeingfurnishedasanaidinlocatingtheherein describedlandinrelationtoadjoiningstreets,natural boundariesandotherland,andisnot asurveyoftheland depicted Except totheextent apolicyoftitleinsuranceis expresslymodifiedbyendorsement,ifany,thecompanydoes not insuredimensions,distances,locationofeasements, acreageorothermattersshownthereon
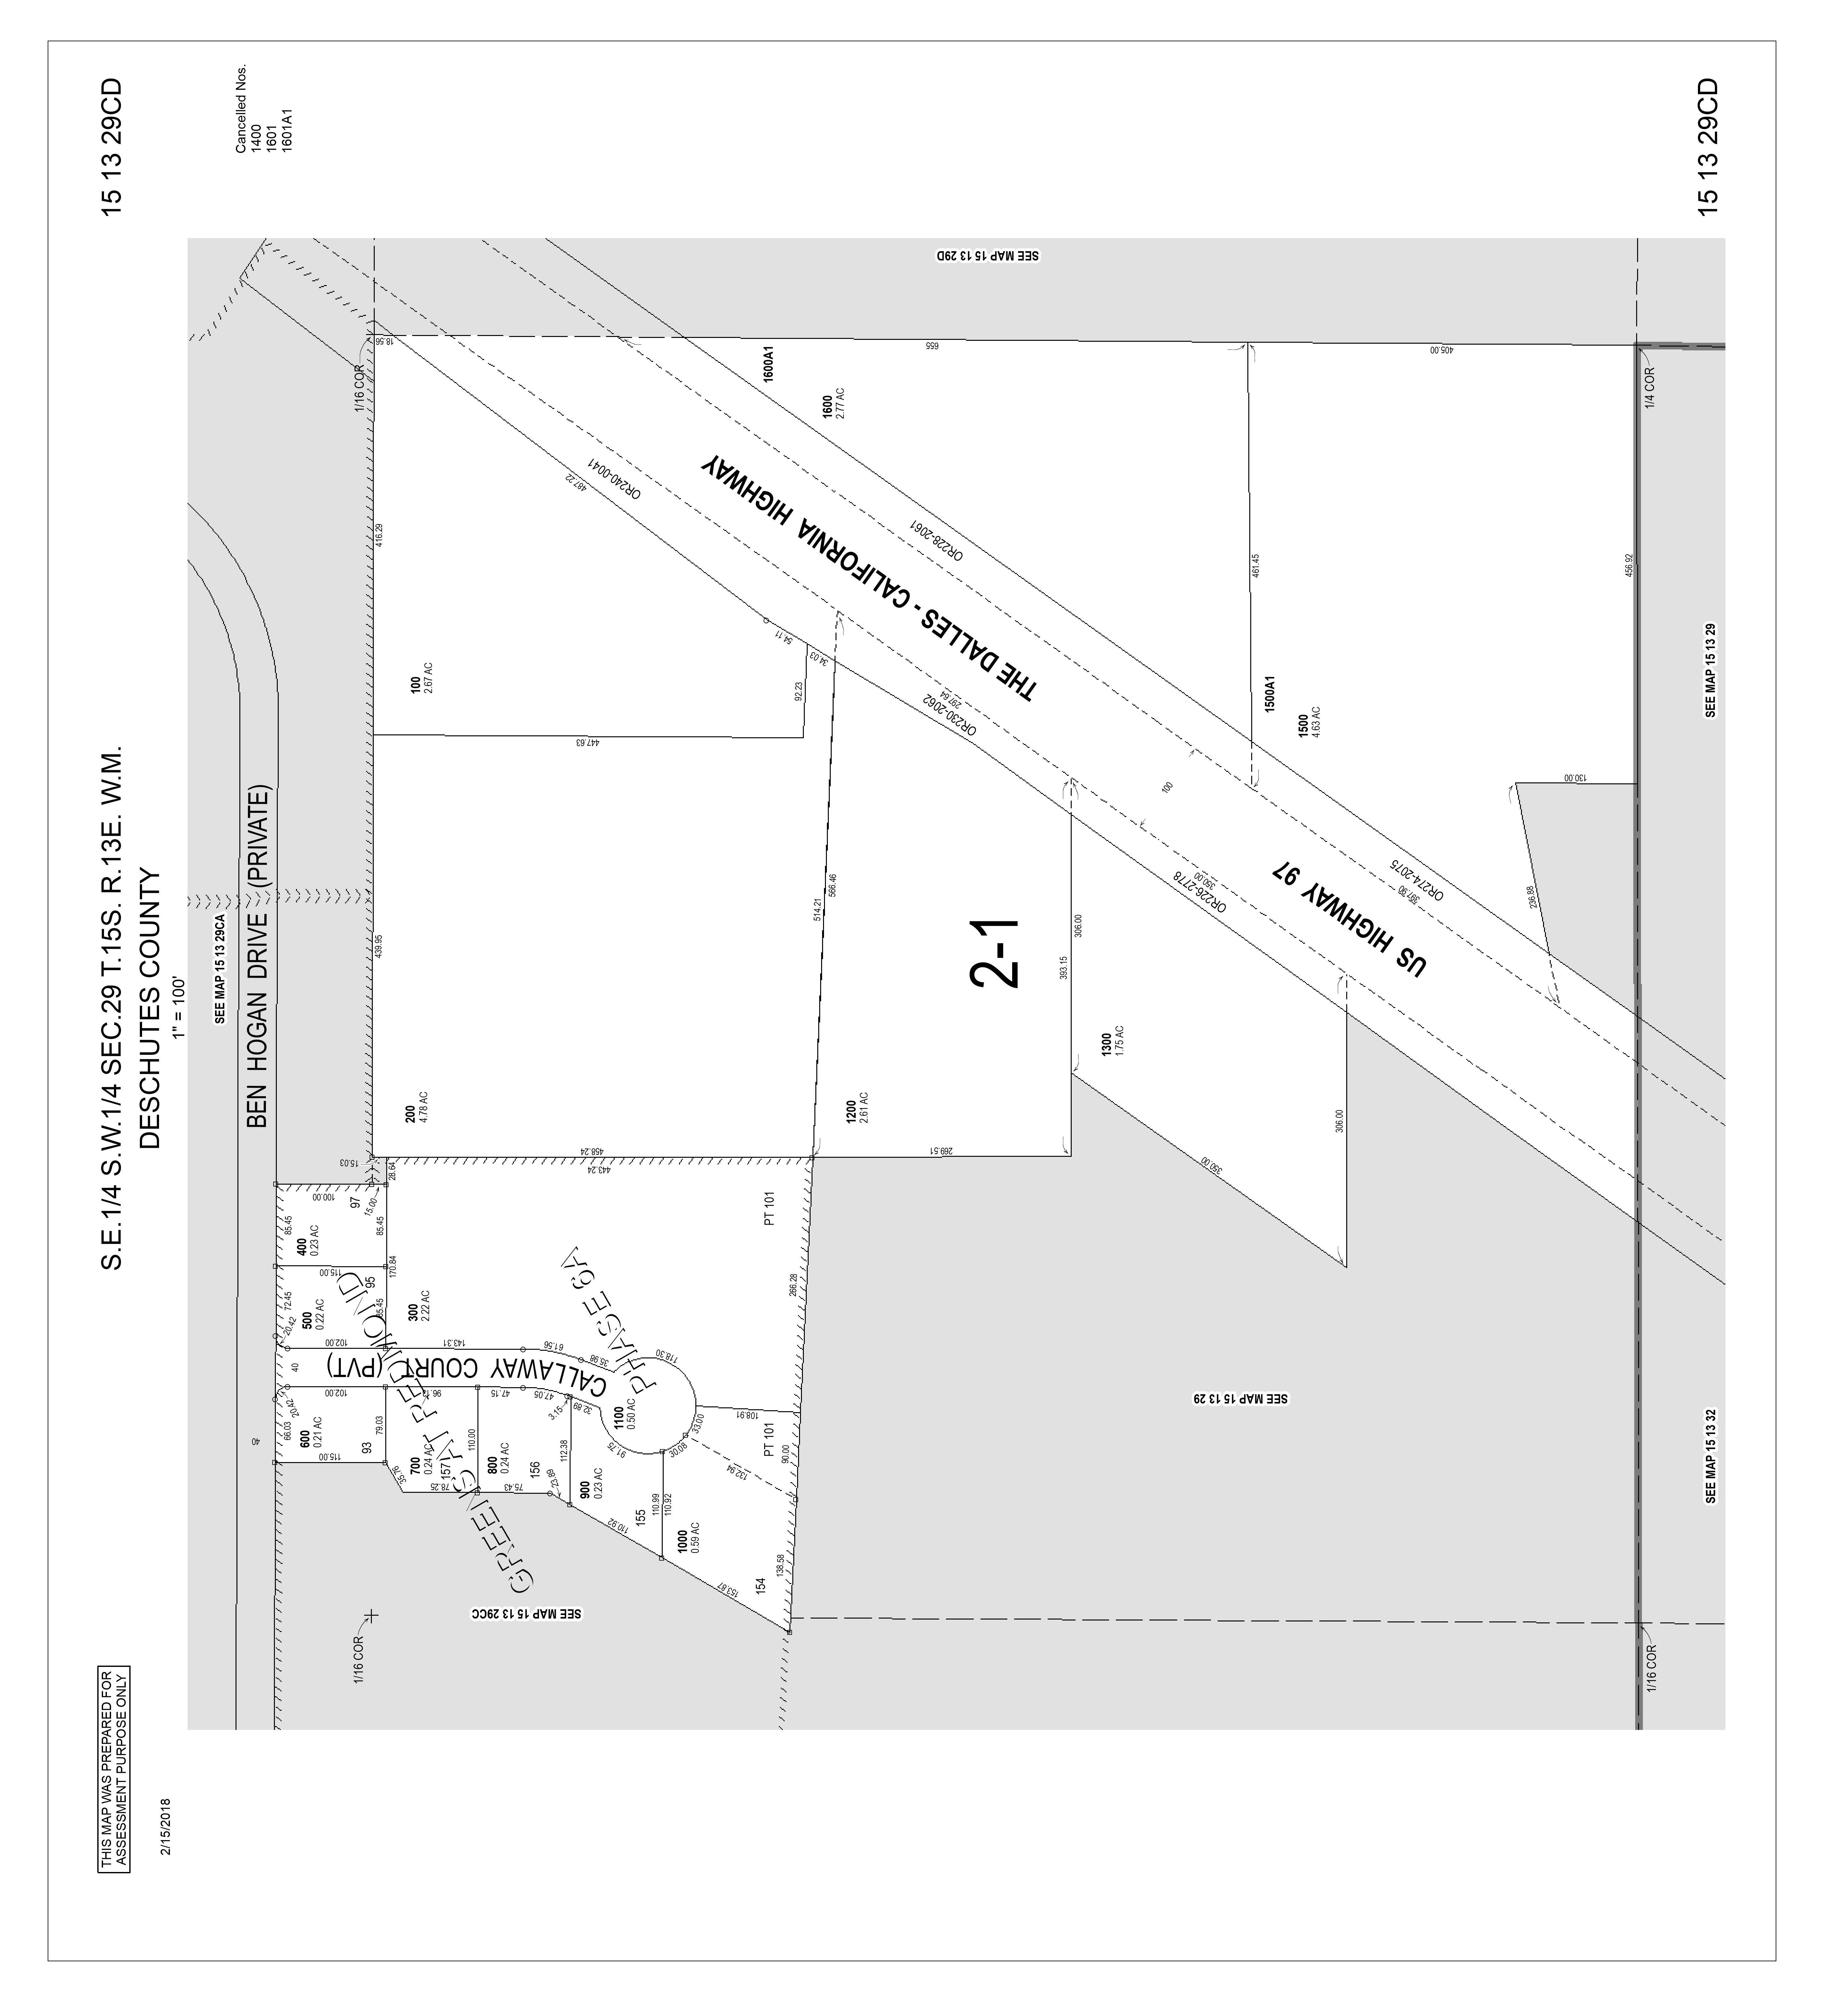
AssessorMap
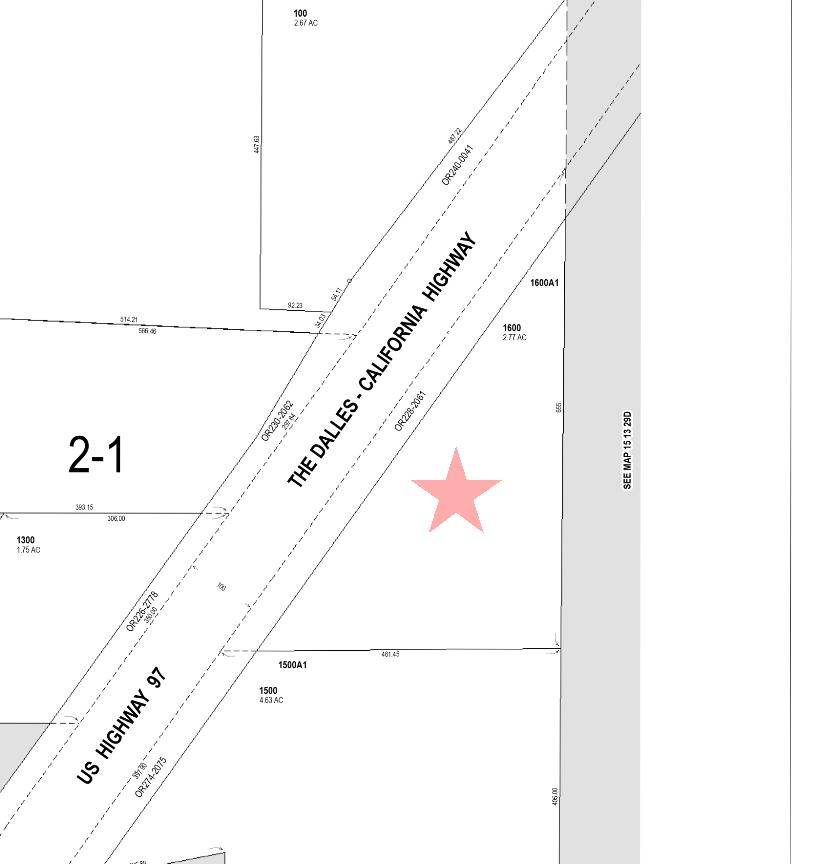
ParcelID:130165
TaxAccount#:151329CD01600
4422SHwy97, RedmondOR97756
Thismap/plat isbeingfurnishedasanaidinlocatingtheherein describedlandinrelationtoadjoiningstreets,natural boundariesandotherland,andisnot asurveyoftheland depicted Except totheextent apolicyoftitleinsuranceis expresslymodifiedbyendorsement,ifany,thecompanydoes not insuredimensions,distances,locationofeasements, acreageorothermattersshownthereon
ContourMap
ParcelID:130165
TaxAccount#:151329CD01600
4422SHwy97, RedmondOR97756
Thismap/plat isbeingfurnishedasanaidinlocatingtheherein describedlandinrelationtoadjoiningstreets,natural boundariesandotherland,andisnot asurveyoftheland depicted Except totheextent apolicyoftitleinsuranceis expresslymodifiedbyendorsement,ifany,thecompanydoes not insuredimensions,distances,locationofeasements, acreageorothermattersshownthereon
FloodMap
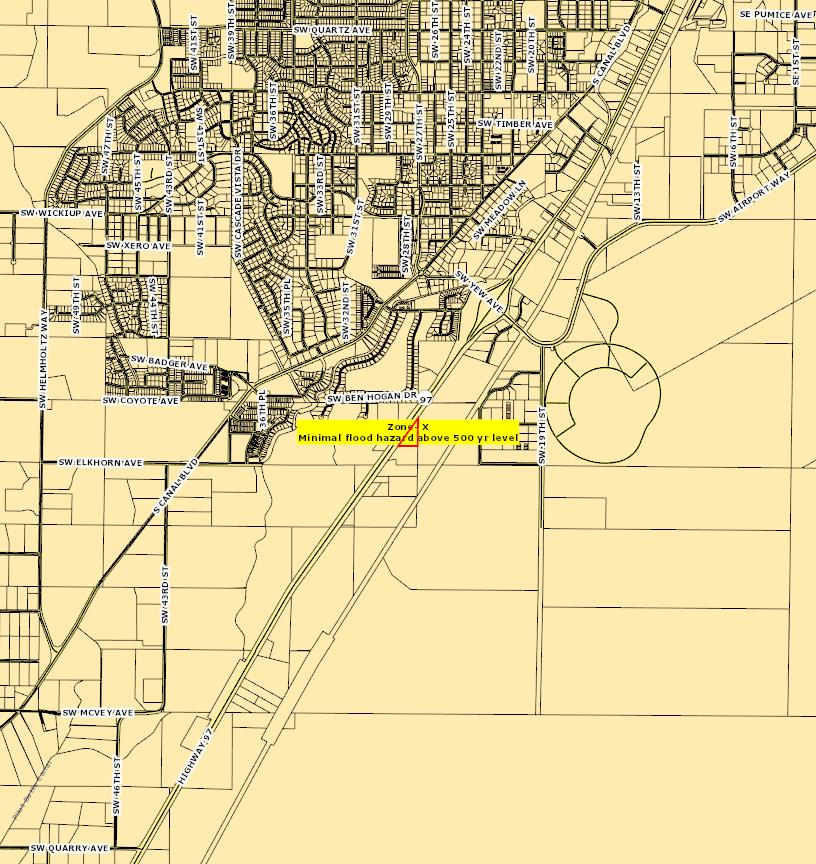
ParcelID:130165
TaxAccount#:151329CD01600
4422SHwy97, RedmondOR97756
Thismap/plat isbeingfurnishedasanaidinlocatingtheherein describedlandinrelationtoadjoiningstreets,natural boundariesandotherland,andisnot asurveyoftheland depicted Except totheextent apolicyoftitleinsuranceis expresslymodifiedbyendorsement,ifany,thecompanydoes not insuredimensions,distances,locationofeasements, acreageorothermattersshownthereon
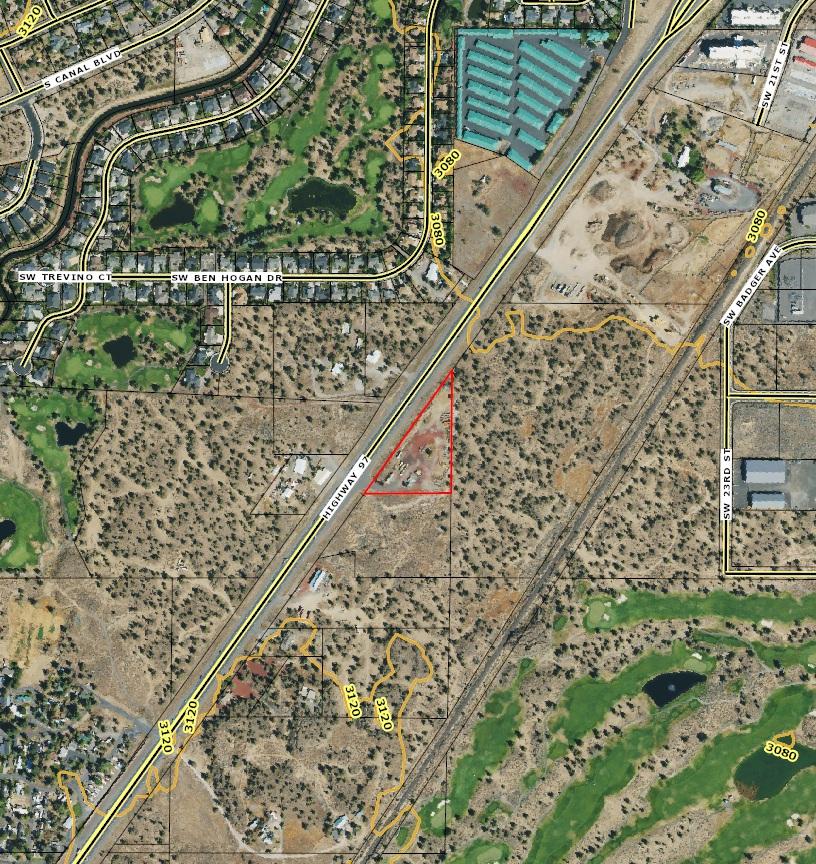
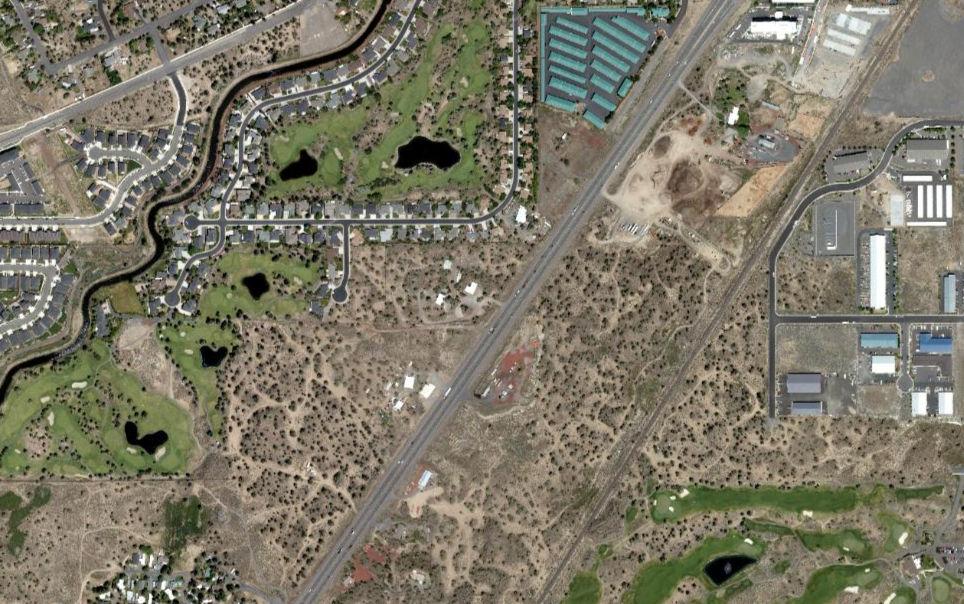
AerialMap
ParcelID:130165
TaxAccount#:151329CD01600
4422SHwy97, RedmondOR97756
Thismap/plat isbeingfurnishedasanaidinlocatingtheherein describedlandinrelationtoadjoiningstreets,natural boundariesandotherland,andisnot asurveyoftheland depicted Except totheextent apolicyoftitleinsuranceis expresslymodifiedbyendorsement,ifany,thecompanydoes not insuredimensions,distances,locationofeasements, acreageorothermattersshownthereon
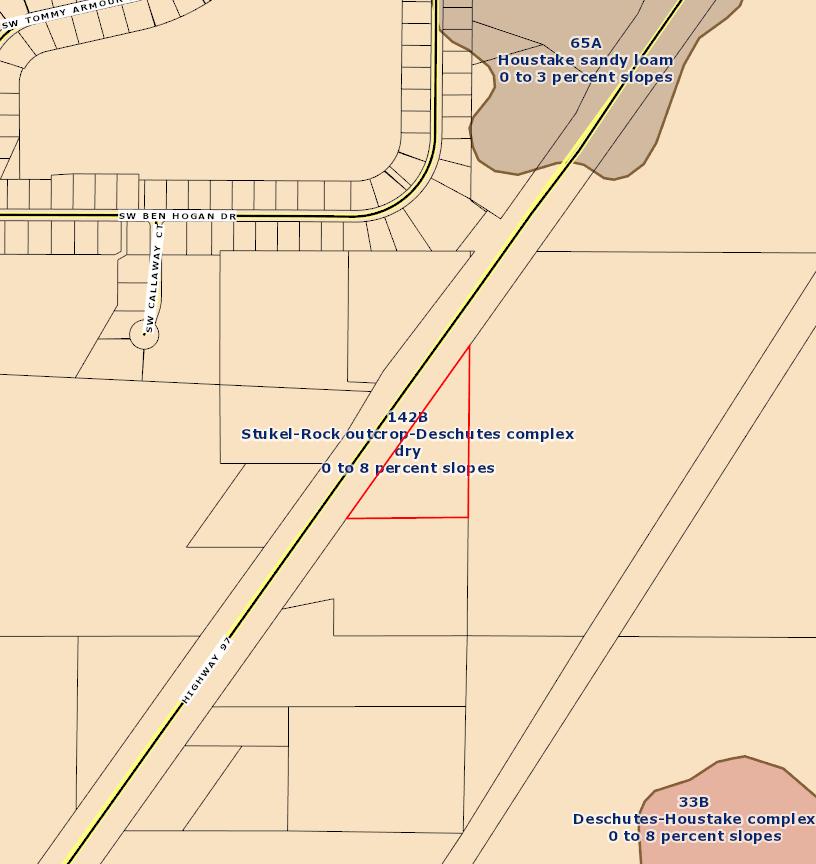
SoilMap
ParcelID:130165
TaxAccount#:151329CD01600
4422SHwy97, RedmondOR97756
Thismap/plat isbeingfurnishedasanaidinlocatingtheherein describedlandinrelationtoadjoiningstreets,natural boundariesandotherland,andisnot asurveyoftheland depicted Except totheextent apolicyoftitleinsuranceis expresslymodifiedbyendorsement,ifany,thecompanydoes not insuredimensions,distances,locationofeasements, acreageorothermattersshownthereon
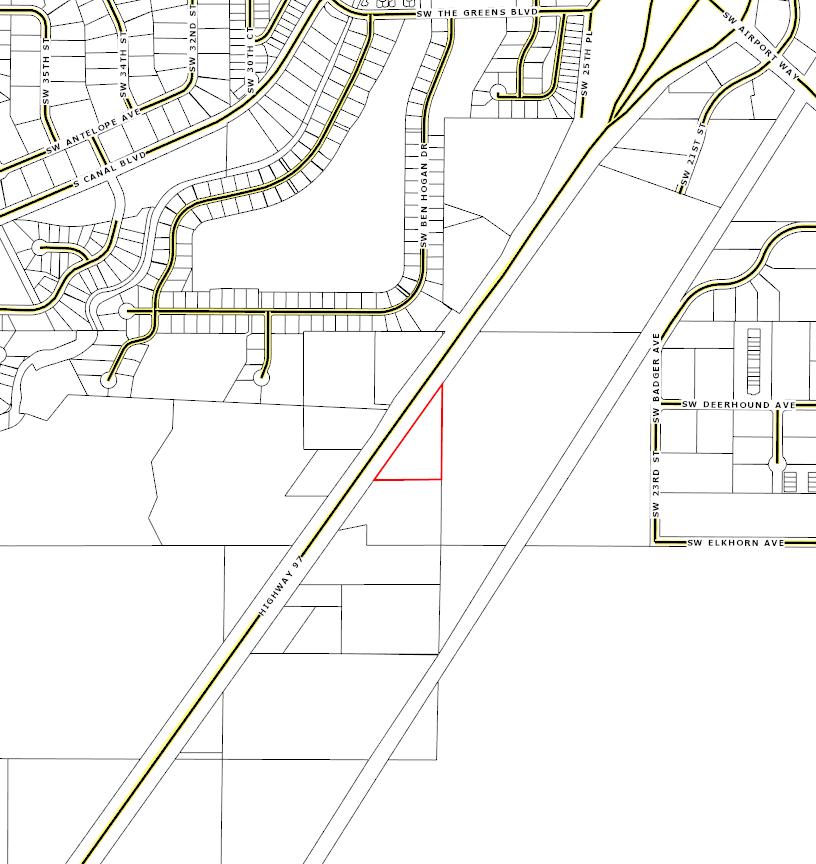
StreetMap
ParcelID:130165
TaxAccount#:151329CD01600
4422SHwy97, RedmondOR97756
Thismap/plat isbeingfurnishedasanaidinlocatingtheherein describedlandinrelationtoadjoiningstreets,natural boundariesandotherland,andisnot asurveyoftheland depicted Except totheextent apolicyoftitleinsuranceis expresslymodifiedbyendorsement,ifany,thecompanydoes not insuredimensions,distances,locationofeasements, acreageorothermattersshownthereon
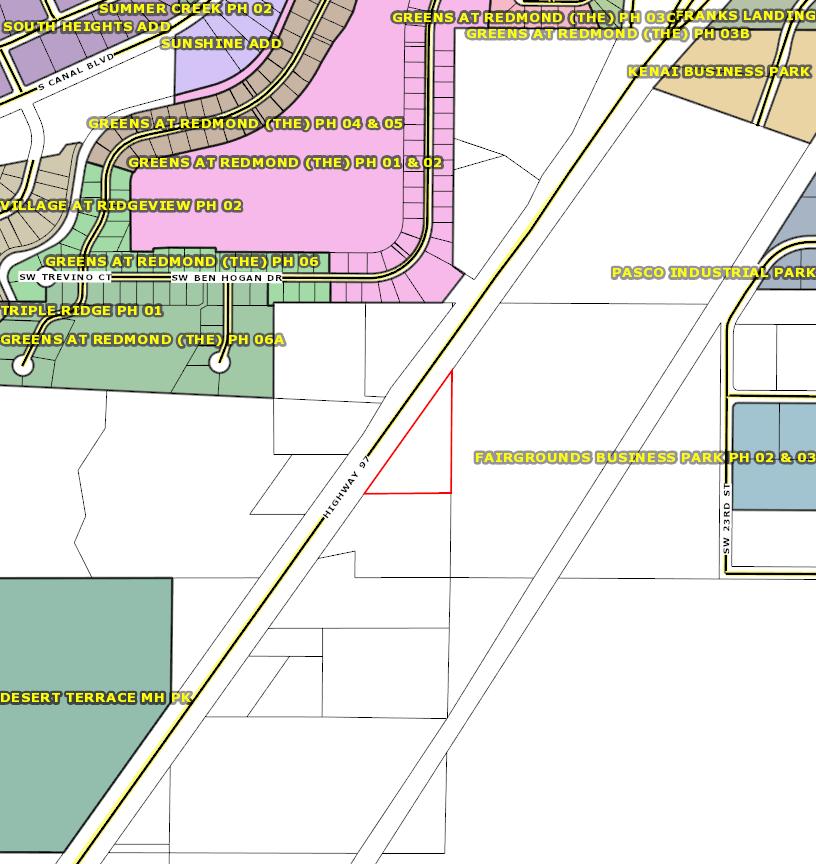
SubdivisionMap
ParcelID:130165
TaxAccount#:151329CD01600
4422SHwy97, RedmondOR97756
Thismap/plat isbeingfurnishedasanaidinlocatingtheherein describedlandinrelationtoadjoiningstreets,natural boundariesandotherland,andisnot asurveyoftheland depicted Except totheextent apolicyoftitleinsuranceis expresslymodifiedbyendorsement,ifany,thecompanydoes not insuredimensions,distances,locationofeasements, acreageorothermattersshownthereon
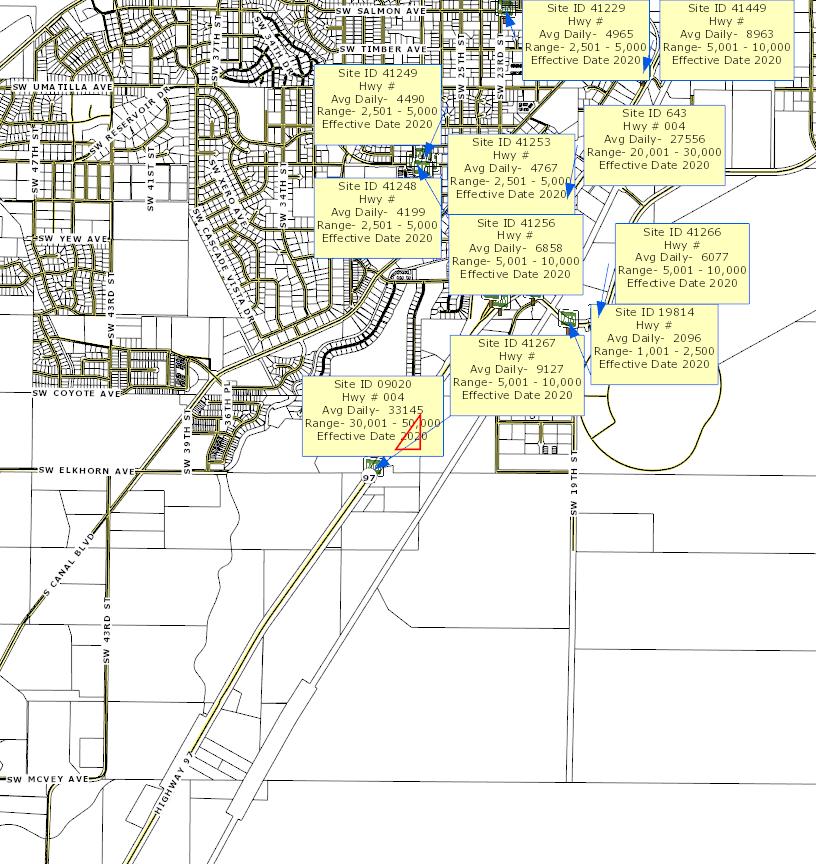
TransportationMap
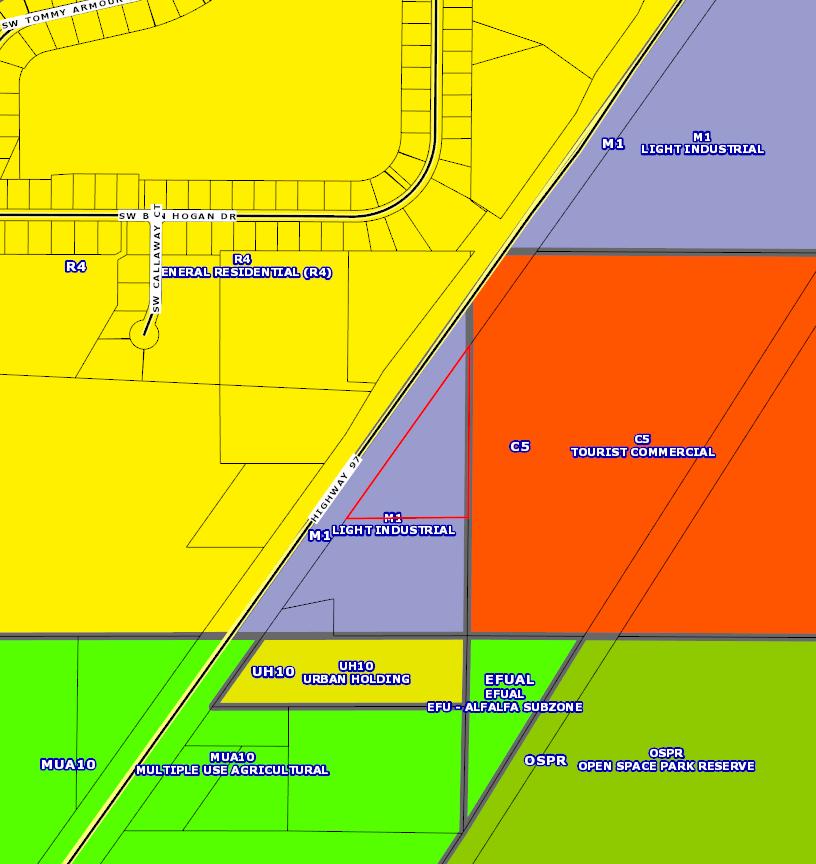
ZoningMap
ParcelID:130165
TaxAccount#:151329CD01600
4422SHwy97, RedmondOR97756
Thismap/plat isbeingfurnishedasanaidinlocatingtheherein describedlandinrelationtoadjoiningstreets,natural boundariesandotherland,andisnot asurveyoftheland depicted Except totheextent apolicyoftitleinsuranceis expresslymodifiedbyendorsement,ifany,thecompanydoes not insuredimensions,distances,locationofeasements, acreageorothermattersshownthereon
CHAPTER 8
REDMOND CODE
The contents of Chapter Development Regulations can be found here: https://www.redmondoregon.gov/home/showpublisheddocument/3426/638091 082331730000
DEVELOPMENT REGULATIONS
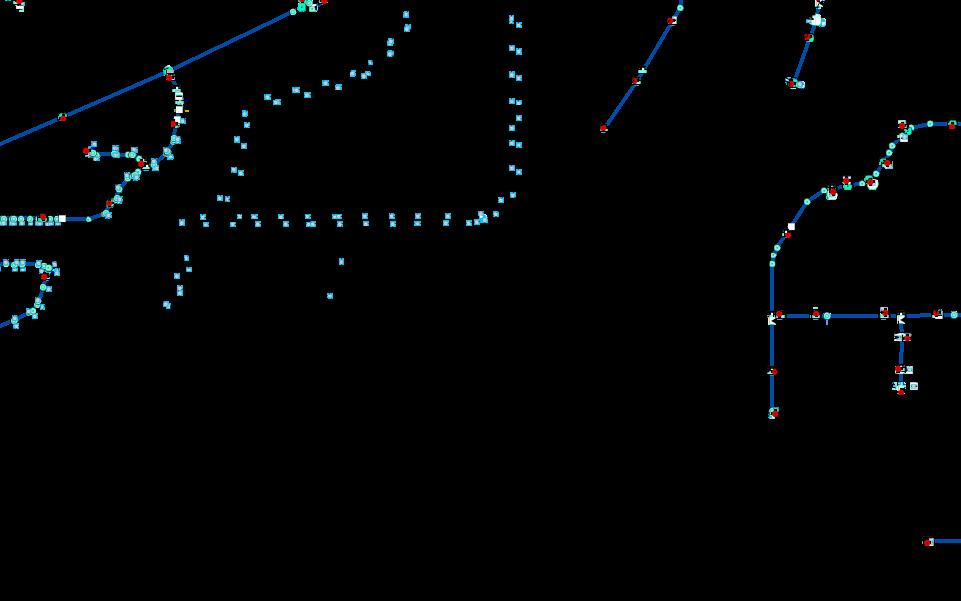
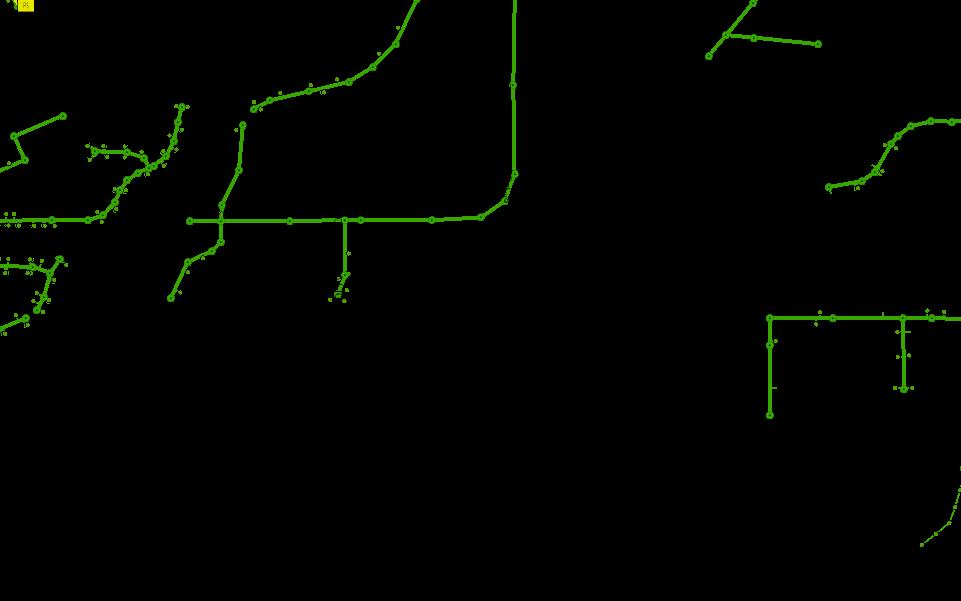
SW 36thSt SW Water Distribution Map - 4422 S Hwy 97 Esri Community Maps Contributors, Oregon State Parks, State of Oregon GEO, © OpenStreetMap, Microsoft, Esri, HERE, Garmin, SafeGraph, REDMOND TAXLOTS WATER LATERAL Commercial Domestic Fire HydrantLaterals Industrial Irrigation System Commercial/Fire GRAVITY MAIN SYSTEM VALVE FITTINGS Bend Cap Coupling Cross ExpansionJoint 9/13/2023, 9:01:44 AM 0 0.1 0.2 0.05 mi 0 0.15 0.3 0.07 km 1:9,028 Web AppBuilder for ArcGIS Esri Community Maps Contributors, Oregon State Parks, State of Oregon GEO, © OpenStreetMap, Microsoft, Esri, HERE, Garmin, SafeGraph, GeoTechnologies, Inc, METI/NASA, USGS, Bureau of Land Management, EPA, NPS, US Census Bureau, USDA | Esri
SW 36thSt SW S Water Distribution Map - 4422 S Hwy 97 Esri Community Maps Contributors, Oregon State Parks, State of Oregon GEO, © OpenStreetMap, Microsoft, Esri, HERE, Garmin, SafeGraph, REDMOND TAXLOTS WATER LATERAL Commercial Domestic Fire HydrantLaterals Industrial Irrigation System Commercial/Fire GRAVITY MAIN SYSTEM VALVE FITTINGS Bend Cap Coupling Cross ExpansionJoint 9/13/2023, 9:02:31 AM 0 0.1 0.2 0.05 mi 0 0.15 0.3 0.07 km 1:9,028 Web AppBuilder for ArcGIS Esri Community Maps Contributors, Oregon State Parks, State of Oregon GEO, © OpenStreetMap, Microsoft, Esri, HERE, Garmin, SafeGraph, GeoTechnologies, Inc, METI/NASA, USGS, Bureau of Land Management, EPA, NPS, US Census Bureau, USDA | Esri
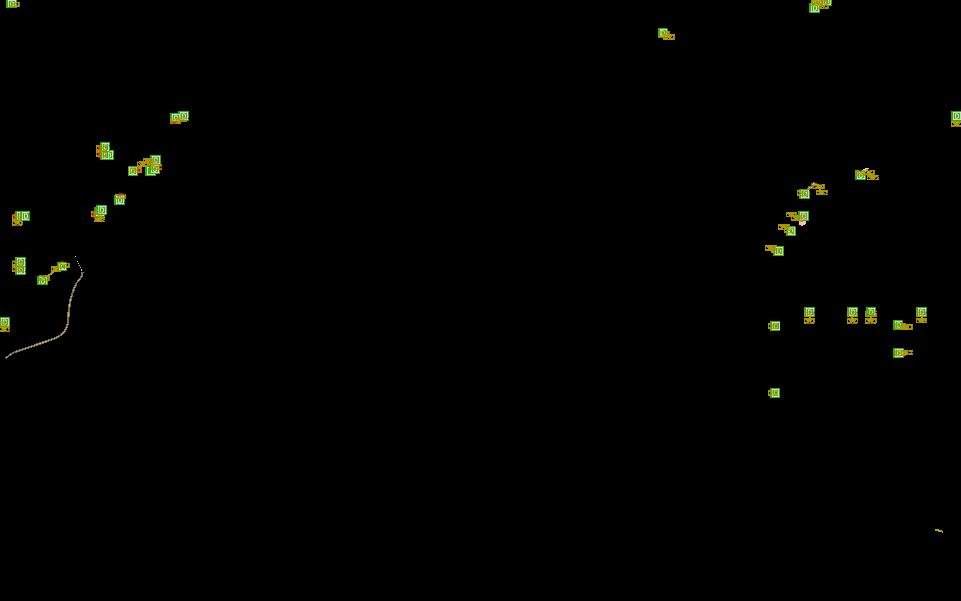
SW 36thSt SW Waste Water Collection System - 4422 S Hwy 97 Esri Community Maps Contributors, Oregon State Parks, State of Oregon GEO, © OpenStreetMap, Microsoft, Esri, HERE, Garmin, SafeGraph, COLLECTION MAIN SERVICE LATERAL CLEAN OUT MANHOLE PRESSURE MAIN PUMP STATION REDMOND TAXLOTS 9/13/2023, 9:04:19 AM 0 0.1 0.2 0.05 mi 0 0.15 0.3 0.07 km 1:9,028 Web AppBuilder for ArcGIS Esri Community Maps Contributors, Oregon State Parks, State of Oregon GEO, © OpenStreetMap, Microsoft, Esri, HERE, Garmin, SafeGraph, GeoTechnologies, Inc, METI/NASA, USGS, Bureau of Land Management, EPA, NPS, US Census Bureau, USDA | Esri
SW 36thSt SW S Waste Water Collection System - 4422 S Hwy 97 Esri Community Maps Contributors, Oregon State Parks, State of Oregon GEO, © OpenStreetMap, Microsoft, Esri, HERE, Garmin, SafeGraph, COLLECTION MAIN SERVICE LATERAL CLEAN OUT MANHOLE PRESSURE MAIN PUMP STATION REDMOND TAXLOTS 9/13/2023, 9:03:48 AM 0 0.1 0.2 0.05 mi 0 0.15 0.3 0.07 km 1:9,028 Web AppBuilder for ArcGIS Esri Community Maps Contributors, Oregon State Parks, State of Oregon GEO, © OpenStreetMap, Microsoft, Esri, HERE, Garmin, SafeGraph, GeoTechnologies, Inc, METI/NASA, USGS, Bureau of Land Management, EPA, NPS, US Census Bureau, USDA | Esri
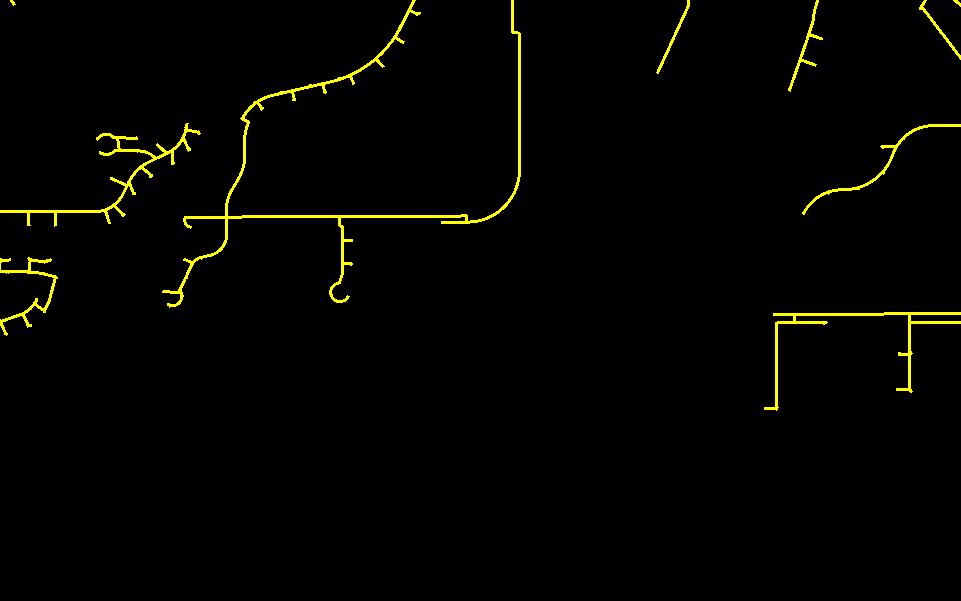
SW 36thSt SW Storm Water Map - 4422 S Hwy 97 Esri Community Maps Contributors, Oregon State Parks, State of Oregon GEO, © OpenStreetMap, Microsoft, Esri, HERE, Garmin, SafeGraph, DETENTION BASINS INFILTRATION BASIN POND SWALE STORM PIPE ACCESS POINTS CLEANOUT MANHOLE OTHER SEDIMENTATION MANHOLE VAULT STORM UIC FACILITIES DRILL HOLE DRYWELL FRENCH DRAIN 9/13/2023, 9:08:08 AM 0 0.1 0.2 0.05 mi 0 0.15 0.3 0.07 km 1:9,028 Web AppBuilder for ArcGIS Esri Community Maps Contributors, Oregon State Parks, State of Oregon GEO, © OpenStreetMap, Microsoft, Esri, HERE, Garmin, SafeGraph, GeoTechnologies, Inc, METI/NASA, USGS, Bureau of Land Management, EPA, NPS, US Census Bureau, USDA | Esri
SW 36thSt SW S Storm Water Map - 4422 S Hwy 97 Esri Community Maps Contributors, Oregon State Parks, State of Oregon GEO, © OpenStreetMap, Microsoft, Esri, HERE, Garmin, SafeGraph, DETENTION BASINS INFILTRATION BASIN POND SWALE STORM PIPE ACCESS POINTS CLEANOUT MANHOLE OTHER SEDIMENTATION MANHOLE VAULT STORM UIC FACILITIES DRILL HOLE DRYWELL FRENCH DRAIN 9/13/2023, 9:08:44 AM 0 0.1 0.2 0.05 mi 0 0.15 0.3 0.07 km 1:9,028 Web AppBuilder for ArcGIS Esri Community Maps Contributors, Oregon State Parks, State of Oregon GEO, © OpenStreetMap, Microsoft, Esri, HERE, Garmin, SafeGraph, GeoTechnologies, Inc, METI/NASA, USGS, Bureau of Land Management, EPA, NPS, US Census Bureau, USDA | Esri
SW 36thSt SW Natural Gas Map - 4422 S Hwy 97 Esri Community Maps Contributors, Oregon State Parks, State of Oregon GEO, © OpenStreetMap, Microsoft, Esri, HERE, Garmin, SafeGraph, NATURAL GAS REDMOND TAXLOTS 9/13/2023, 9:10:06 AM 0 0.1 0.2 0.05 mi 0 0.15 0.3 0.07 km 1:9,028 Web AppBuilder for ArcGIS Esri Community Maps Contributors, Oregon State Parks, State of Oregon GEO, © OpenStreetMap, Microsoft, Esri, HERE, Garmin, SafeGraph, GeoTechnologies, Inc, METI/NASA, USGS, Bureau of Land Management, EPA, NPS, US Census Bureau, USDA | Esri
SW 36thSt SW S Natural Gas Map - 4422 S Hwy 97 Esri Community Maps Contributors, Oregon State Parks, State of Oregon GEO, © OpenStreetMap, Microsoft, Esri, HERE, Garmin, SafeGraph, NATURAL GAS REDMOND TAXLOTS 9/13/2023, 9:09:39 AM 0 0.1 0.2 0.05 mi 0 0.15 0.3 0.07 km 1:9,028 Web AppBuilder for ArcGIS Esri Community Maps Contributors, Oregon State Parks, State of Oregon GEO, © OpenStreetMap, Microsoft, Esri, HERE, Garmin, SafeGraph, GeoTechnologies, Inc, METI/NASA, USGS, Bureau of Land Management, EPA, NPS, US Census Bureau, USDA | Esri
Site Details Map
City: Redmond County: Deschutes County
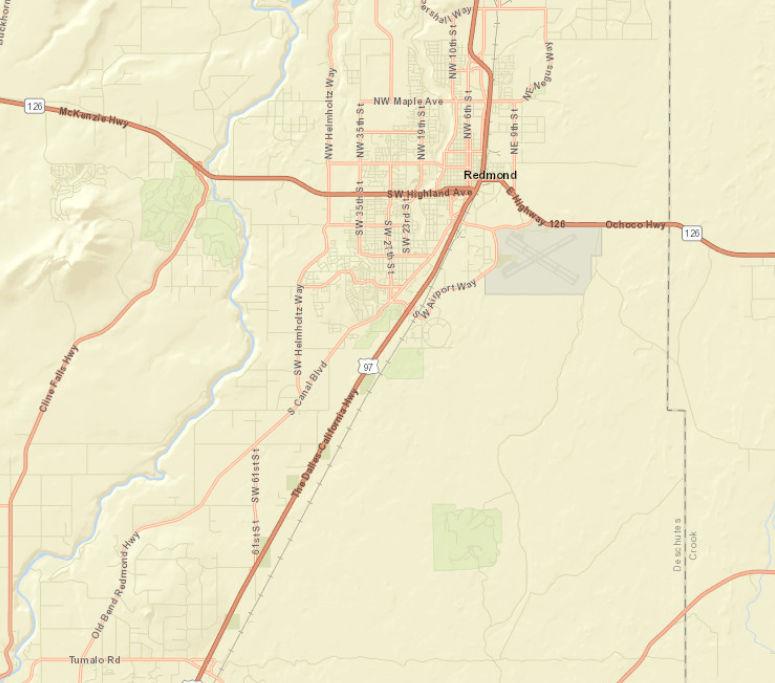
State: Oregon
ZIP Code: 97756
Census Tract: 41017001005
Census Block Group: 410170010051
CBSA: Bend, OR Metropolitan Statistical Area

Bureau of Land Management, State of Oregon GEO, State of Oregon, Esri, HERE, Garmin, INCREMENT P, NGA, USGS, U.S. Forest Service 0 0.8 1.6 mi
4422 S Highway 97, Redmond, Oregon, 97756 Prepared by Esri Rings: 1, 3, 5 mile radii Latitude: 44.23435 Longitude: -121.20029
This site is located in:
September 13, 2023 ©2023 Esri Page 1 of 1
ACS Population Summary

4422 S Highway 97, Redmond, Oregon, 97756 Prepared by Esri Ring: 1 mile radius Latitude: 44.23435 Longitude: -121.20029 2017-2021 ACS Estimate Percent MOE(±) Reliability TOTALS Total Population 1,824 476 Total Households 995 327 Total Housing Units 987 327 POPULATION AGE 3+ YEARS BY SCHOOL ENROLLMENT Total 1,808 100.0% 475 Enrolled in school 194 10 7% 136 Enrolled in nursery school, preschool 2 0 1% 92 Public school 1 0.1% 36 Private school 1 0 1% 57 Enrolled in kindergarten 1 0.1% 11 Public school 0 0.0% 10 Private school 0 0.0% 3 Enrolled in grade 1 to grade 4 42 2.3% 213 Public school 24 1.3% 61 Private school 18 1.0% 294 Enrolled in grade 5 to grade 8 66 3.7% 70 Public school 66 3.7% 70 Private school 0 0.0% 0 Enrolled in grade 9 to grade 12 10 0.6% 115 Public school 10 0.6% 115 Private school 0 0 0% 0 Enrolled in college undergraduate years 64 3.5% 101 Public school 64 3.5% 101 Private school 0 0.0% 0 Enrolled in graduate or professional school 9 0 5% 24 Public school 0 0.0% 0 Private school 9 0 5% 24 Not enrolled in school 1,615 89.3% 390 POPULATION AGE 65+ BY RELATIONSHIP AND HOUSEHOLD TYPE Total 767 100.0% 395 Living in Households 733 95 6% 388 Living in Family Households 518 67.5% 261 Householder 313 40 8% 158 Spouse 188 24 5% 131 Parent 0 0.0% 1 Parent-in-law 0 0 0% 0 Other Relative 16 2.1% 36 Nonrelative 1 0 1% 38 Living in Nonfamily Households 215 28 0% 298 Householder 208 27.1% 296 Nonrelative 7 0.9% 16 Living in Group Quarters 34 4 4% 66 Source: U.S. Census Bureau, 2017-2021 American Community Survey Reliability: high medium low September 13, 2023 ©2023 Esri Page 1 of 24
ACS Population Summary
4422 S Highway 97, Redmond, Oregon, 97756 Prepared by Esri Ring: 1 mile radius Latitude: 44.23435 Longitude: -121.20029 2017-2021 ACS Estimate Percent MOE(±) Reliability HOUSEHOLDS BY TYPE AND SIZE Family Households 551 55 4% 174 2-Person 412 41.4% 178 3-Person 92 9.2% 88 4-Person 35 3.5% 52 5-Person 1 0.1% 44 6-Person 8 0.8% 134 7+ Person 3 0.3% 52 Nonfamily Households 443 44 5% 336 1-Person 375 37 7% 335 2-Person 65 6.5% 97 3-Person 2 0.2% 30 4-Person 2 0.2% 63 5-Person 0 0.0% 0 6-Person 0 0.0% 0 7+ Person 0 0.0% 0 HOUSEHOLDS BY PRESENCE OF PEOPLE UNDER 18 YEARS BY HOUSEHOLD TYPE Households with one or more people under 18 years 106 10.7% 82 Family households 105 10.6% 81 Married-couple family 68 6.8% 74 Male householder, no wife present 5 0.5% 52 Female householder, no husband present 32 3.2% 52 Nonfamily households 1 0.1% 11 Households with no people under 18 years 889 89.3% 332 Married-couple family 377 37.9% 164 Other family 69 6.9% 114 Nonfamily households 443 44.5% 337 HOUSEHOLDS BY PRESENCE OF PEOPLE 65 YEARS AND OVER, HOUSEHOLD SIZE AND HOUSEHOLD TYPE Households with Pop 65+ 573 57.6% 328 1-Person 224 22.5% 298 2+ Person Family 345 34.7% 158 2+ Person Nonfamily 4 0.4% 8 Households with No Pop 65+ 422 42.4% 191 1-Person 150 15.1% 179 2+ Person Family 207 20.8% 115 2+ Person Nonfamily 65 6.5% 91 HOUSEHOLD TYPE BY RELATIVES AND NONRELATIVES FOR POPULATION IN HOUSEHOLDS POPULATION IN HOUSEHOLDS Total 1,775 100.0% 468 In Family Households 1,293 72 8% 414 In Married-Couple Family 1,035 58 3% 393 Relatives 1,033 58 2% 392 Nonrelatives 2 0.1% 27 In Male Householder-No Spouse Present-Family 29 1.6% 275 Relatives 13 0.7% 130 Nonrelatives 16 0.9% 227 In Female Householder-No Spouse Present-Family 229 12 9% 306 Relatives 229 12.9% 306 Nonrelatives 0 0.0% 0 In Nonfamily Households 482 27 2% 359 Source: U.S. Census Bureau, 2017-2021 American Community Survey Reliability: high medium low September 13, 2023 ©2023 Esri Page 2 of 24
ACS Population Summary
4422 S Highway 97, Redmond, Oregon, 97756 Prepared by Esri Ring: 1 mile radius Latitude: 44.23435 Longitude: -121.20029 2017-2021 ACS Estimate Percent MOE(±) Reliability POPULATION AGE 5+ YEARS BY LANGUAGE SPOKEN AT HOME AND ABILITY TO SPEAK ENGLISH Total 1,792 100.0% 476 5 to 17 years Speak only English 126 7 0% 154 Speak Spanish 11 0.6% 135 Speak English "very well" or "well" 11 0.6% 135 Speak English "not well" 0 0.0% 0 Speak English "not at all" 0 0 0% 0 Speak other Indo-European languages 0 0.0% 0 Speak English "very well" or "well" 0 0.0% 0 Speak English "not well" 0 0.0% 0 Speak English "not at all" 0 0 0% 0 Speak Asian and Pacific Island languages 0 0.0% 0 Speak English "very well" or "well" 0 0.0% 0 Speak English "not well" 0 0.0% 0 Speak English "not at all" 0 0 0% 0 Speak other languages 0 0.0% 0 Speak English "very well" or "well" 0 0.0% 0 Speak English "not well" 0 0.0% 0 Speak English "not at all" 0 0 0% 0 18 to 64 years Speak only English 849 47.4% 308 Speak Spanish 25 1.4% 299 Speak English "very well" or "well" 7 0.4% 67 Speak English "not well" 12 0.7% 184 Speak English "not at all" 6 0 3% 108 Speak other Indo-European languages 9 0.5% 156 Speak English "very well" or "well" 9 0.5% 155 Speak English "not well" 0 0.0% 0 Speak English "not at all" 0 0 0% 0 Speak Asian and Pacific Island languages 5 0.3% 71 Speak English "very well" or "well" 4 0.2% 57 Speak English "not well" 1 0.1% 15 Speak English "not at all" 0 0 0% 0 Speak other languages 0 0.0% 0 Speak English "very well" or "well" 0 0.0% 0 Speak English "not well" 0 0.0% 0 Speak English "not at all" 0 0 0% 0 65 years and over Speak only English 691 38 6% 397 Speak Spanish 47 2.6% 113 Speak English "very well" or "well" 47 2.6% 113 Speak English "not well" 0 0.0% 0 Speak English "not at all" 0 0 0% 0 Speak other Indo-European languages 0 0.0% 0 Speak English "very well" or "well" 0 0.0% 0 Speak English "not well" 0 0.0% 0 Speak English "not at all" 0 0 0% 0 Speak Asian and Pacific Island languages 28 1.6% 74 Speak English "very well" or "well" 28 1.6% 74 Speak English "not well" 0 0.0% 0 Speak English "not at all" 0 0 0% 0 Speak other languages 0 0.0% 0 Speak English "very well" or "well" 0 0.0% 0 Speak English "not well" 0 0.0% 0 Speak English "not at all" 0 0 0% 0 Source: U.S. Census Bureau, 2017-2021 American Community Survey Reliability: high medium low September 13, 2023 ©2023 Esri Page 3 of 24
4422 S Highway 97, Redmond, Oregon, 97756 Prepared by Esri Ring: 1 mile radius Latitude: 44.23435 Longitude: -121.20029 2017-2021 ACS Estimate Percent MOE(±) Reliability WORKERS AGE 16+ YEARS BY PLACE OF WORK Total 732 100.0% 313 Worked in state and in county of residence 653 89.2% 278 Worked in state and outside county of residence 49 6 7% 80 Worked outside state of residence 30 4.1% 61 SEX BY CLASS OF WORKER FOR THE CIVILIAN EMPLOYED POPULATION 16 YEARS AND OVER Total: 743 100.0% 318 Male: 383 51 5% 190 Employee of private company workers 242 32 6% 128 Self-employed in own incorporated business workers 101 13 6% 169 Private not-for-profit wage and salary workers 6 0.8% 16 Local government workers 5 0.7% 13 State government workers 20 2.7% 59 Federal government workers 1 0.1% 18 Self-employed in own not incorporated business workers 9 1 2% 118 Unpaid family workers 0 0.0% 0 Female: 360 48 5% 196 Employee of private company workers 250 33 6% 156 Self-employed in own incorporated business workers 6 0.8% 74 Private not-for-profit wage and salary workers 18 2.4% 33 Local government workers 71 9.6% 147 State government workers 0 0.0% 0 Federal government workers 1 0.1% 19 Self-employed in own not incorporated business workers 15 2.0% 32 Unpaid family workers 0 0 0% 0 POPULATION IN HOUSEHOLDS AND PRESENCE OF A COMPUTER Total 1,775 100.0% 468 Population <18 in Households 169 9 5% 130 Have a Computer 168 9.5% 272 Have NO Computer 1 0.1% 20 Population 18-64 in Households 873 49 2% 302 Have a Computer 836 47 1% 305 Have NO Computer 37 2 1% 89 Population 65+ in Households 733 41 3% 388 Have a Computer 561 31.6% 256 Have NO Computer 172 9 7% 323 HOUSEHOLDS AND INTERNET SUBSCRIPTIONS Total 995 100.0% 327 With an Internet Subscription 815 81.9% 198 Dial-Up Alone 5 0 5% 22 Broadband 751 75 5% 200 Satellite Service 19 1 9% 27 Other Service 1 0 1% 26 Internet Access with no Subscription 26 2.6% 58 With No Internet Access 153 15 4% 297 Source: U.S. Census Bureau, 2017-2021 American Community Survey Reliability: high medium low September 13, 2023 ©2023 Esri Page 4 of 24
ACS Population Summary
ACS Population Summary
4422 S Highway 97, Redmond, Oregon, 97756 Prepared by Esri Ring: 1 mile radius Latitude: 44.23435 Longitude: -121.20029 2017-2021 ACS Estimate Percent MOE(±) Reliability WORKERS AGE 16+ YEARS BY MEANS OF TRANSPORTATION TO WORK Total 732 100.0% 313 Drove alone 499 68 2% 280 Carpooled 20 2.7% 153 Public transportation (excluding taxicab) 1 0.1% 74 Bus or trolley bus 1 0.1% 74 Light rail, streetcar or trolley 0 0.0% 0 Subway or elevated 0 0.0% 0 Long-distance/Commuter Train 0 0.0% 0 Ferryboat 0 0.0% 0 Taxicab 1 0.1% 57 Motorcycle 48 6.6% 120 Bicycle 71 9.7% 163 Walked 2 0.3% 27 Other means 5 0.7% 13 Worked at home 86 11.7% 99
AGE
BY TRAVEL TIME TO WORK Total 647 100.0% 290 Less than 5 minutes 132 20 4% 173 5 to 9 minutes 93 14.4% 99 10 to 14 minutes 150 23 2% 159 15 to 19 minutes 62 9 6% 75 20 to 24 minutes 68 10 5% 74 25 to 29 minutes 82 12 7% 109 30 to 34 minutes 26 4.0% 124 35 to 39 minutes 15 2 3% 27 40 to 44 minutes 2 0.3% 64 45 to 59 minutes 16 2 5% 40 60 to 89 minutes 1 0.2% 30 90 or more minutes 1 0 2% 21 Average Travel Time to Work (in minutes) N/A N/A FEMALES AGE 20-64 YEARS BY AGE OF OWN CHILDREN AND EMPLOYMENT STATUS Total 387 100.0% 187 Own children under 6 years only 26 6.7% 41 In labor force 25 6.5% 42 Not in labor force 1 0.3% 25 Own children under 6 years and 6 to 17 years 16 4 1% 135 In labor force 5 1.3% 76 Not in labor force 11 2.8% 151 Own children 6 to 17 years only 58 15.0% 65 In labor force 45 11.6% 64 Not in labor force 12 3.1% 22 No own children under 18 years 287 74 2% 160 In labor force 221 57.1% 152 Not in labor force 66 17.1% 65
U.S. Census Bureau,
American Community Survey Reliability: high medium low September 13, 2023 ©2023 Esri Page 5 of 24
WORKERS
16+ YEARS (WHO DID NOT WORK FROM HOME)
Source:
2017-2021
4422 S Highway 97, Redmond, Oregon, 97756 Prepared by Esri Ring: 1 mile radius Latitude: 44.23435 Longitude: -121.20029 2017-2021 ACS Estimate Percent MOE(±) Reliability CIVILIAN NONINSTITUTIONALIZED POPULATION BY AGE & TYPES OHEALINSURANCE COVERAGE OF HEALTH INSURANCE COVERAGE Total 1,822 100.0% 476 Under 19 years: 209 11 5% 231 One Type of Health Insurance: 168 9 2% 259 Employer-Based Health Ins Only 46 2.5% 81 Direct-Purchase Health Ins Only 38 2 1% 92 Medicare Coverage Only 0 0.0% 0 Medicaid Coverage Only 85 4 7% 469 TRICARE/Military Hlth Cov Only 0 0.0% 0 VA Health Care Only 0 0.0% 0 2+ Types of Health Insurance 38 2.1% 64 No Health Insurance Coverage 2 0.1% 50 19 to 34 years: 238 13.1% 191 One Type of Health Insurance: 210 11.5% 185 Employer-Based Health Ins Only 164 9.0% 185 Direct-Purchase Health Ins Only 30 1.6% 57 Medicare Coverage Only 0 0.0% 0 Medicaid Coverage Only 15 0 8% 81 TRICARE/Military Hlth Cov Only 1 0.1% 33 VA Health Care Only 1 0 1% 9 2+ Types of Health Insurance 23 1.3% 42 No Health Insurance Coverage 5 0 3% 93 35 to 64 years: 609 33 4% 234 One Type of Health Insurance: 377 20 7% 183 Employer-Based Health Ins Only 268 14 7% 170 Direct-Purchase Health Ins Only 26 1.4% 89 Medicare Coverage Only 0 0.0% 0 Medicaid Coverage Only 79 4 3% 119 TRICARE/Military Hlth Cov Only 0 0.0% 22 VA Health Care Only 3 0 2% 46 2+ Types of Health Insurance 133 7.3% 122 No Health Insurance Coverage 99 5.4% 143 65+ years: 765 42.0% 395 One Type of Health Insurance: 451 24.8% 378 Employer-Based Health Ins Only 15 0.8% 39 Direct-Purchase Health Ins Only 0 0.0% 0 Medicare Coverage Only 437 24 0% 377 TRICARE/Military Hlth Cov Only 0 0 0% 0 VA Health Care Only 0 0.0% 0 2+ Types of Health Insurance: 314 17 2% 170 Employer-Based & Direct-Purchase Health Insurance 0 0.0% 0 Employer-Based Health & Medicare Insurance 67 3.7% 118 Direct-Purchase Health & Medicare Insurance 82 4.5% 121 Medicare & Medicaid Coverage 20 1.1% 23 Other Private Health Insurance Combos 0 0.0% 0 Other Public Health Insurance Combos 19 1.0% 37 Other Health Insurance Combinations 126 6.9% 113 No Health Insurance Coverage 0 0.0% 0 Source: U.S. Census Bureau, 2017-2021 American Community Survey Reliability: high medium low September 13, 2023 ©2023 Esri Page 6 of 24
ACS Population Summary
ACS Population Summary
CIVILIAN POPULATION AGE 18 OR OLDER BY VETERAN STATUS
CIVILIAN VETERANS AGE 18 OR OLDER BY PERIOD OF MILITARY SERVICE
4422 S Highway 97, Redmond, Oregon, 97756 Prepared by Esri Ring: 1 mile radius Latitude: 44.23435 Longitude: -121.20029 2017-2021 ACS Estimate Percent MOE(±) Reliability POPULATION
Total 1,818 100.0% 476 Under 50 55 3.0% 62 50 to 99 72 4.0% 89 1 00 to 1 24 177 9.7% 313 1 25 to 1 49 44 2 4% 90 1 50 to 1 84 80 4.4% 414 1 85 to 1 99 4 0 2% 52 2 00 and over 1,384 76 1% 437
BY RATIO OF INCOME TO POVERTY LEVEL
Total 1,655 100.0% 439 Veteran 208 12.6% 154 Nonveteran 1,447 87.4% 420 Male 728 44 0% 181 Veteran 207 12 5% 155 Nonveteran 521 31 5% 187 Female 927 56 0% 343 Veteran 1 0.1% 45 Nonveteran 926 56 0% 343
Total 208 100.0% 154 Gulf War (9/01 or later), no Gulf War (8/90 to 8/01), no Vietnam Era 35 16 8% 57 Gulf War (9/01 or later) and Gulf War (8/90 to 8/01), no Vietnam Era 1 0.5% 18 Gulf War (9/01 or later), and Gulf War (8/90 to 8/01), and Vietnam Era 0 0.0% 0 Gulf War (8/90 to 8/01), no Vietnam Era 1 0.5% 19 Gulf War (8/90 to 8/01) and Vietnam Era 0 0.0% 0 Vietnam Era, no Korean War, no World War II 124 59 6% 127 Vietnam Era and Korean War, no World War II 0 0.0% 0 Vietnam Era and Korean War and World War II 0 0.0% 0 Korean War, no Vietnam Era, no World War II 15 7.2% 38 Korean War and World War II, no Vietnam Era 0 0 0% 0 World War II, no Korean War, no Vietnam Era 1 0.5% 41 Between Gulf War and Vietnam Era only 3 1.4% 7 Between Vietnam Era and Korean War only 29 13 9% 55 Between Korean War and World War II only 0 0.0% 0 Pre-World War II only 0 0.0% 0 HOUSEHOLDS BY POVERTY STATUS Total 995 100.0% 327 Income in the past 12 months below poverty level 47 4.7% 53 Married-couple family 18 1.8% 38 Other family - male householder (no wife present) 0 0.0% 0 Other family - female householder (no husband present) 11 1.1% 21 Nonfamily household - male householder 1 0.1% 15 Nonfamily household - female householder 17 1.7% 29 Income in the past 12 months at or above poverty level 948 95 3% 334 Married-couple family 428 43 0% 166 Other family - male householder (no wife present) 6 0.6% 68 Other family - female householder (no husband present) 89 8.9% 127 Nonfamily household - male householder 156 15.7% 162 Nonfamily household - female householder 270 27 1% 301 Poverty Index 38 Source: U.S. Census Bureau, 2017-2021 American Community Survey Reliability: high medium low September 13, 2023 ©2023 Esri Page 7 of 24
ACS Population Summary
Data Note: N/A means not available Population by Ratio of Income to Poverty Level represents persons for whom poverty status is determined. Household income represents income in 2021, adjusted for inflation
2017-2021 ACS Estimate: The American Community Survey (ACS) replaces census sample data. Esri is releasing the 2017-2021 ACS estimates, five-year period data collected monthly from January 1, 2017 through December 31, 2021. Although the ACS includes many of the subjects previously covered by the decennial census sample, there are significant differences between the two surveys including fundamental differences in survey design and residency rules
Margin of error (MOE): The MOE is a measure of the variability of the estimate due to sampling error. MOEs enable the data user to measure the range of uncertainty for each estimate with 90 percent confidence. The range of uncertainty is called the confidence interval, and it is calculated by taking the estimate +/- the MOE. For example, if the ACS reports an estimate of 100 with an MOE of +/- 20, then you can be 90 percent certain the value for the whole population falls between 80 and 120.
Reliability: These symbols represent threshold values that Esri has established from the Coefficients of Variation (CV) to designate the usability of the estimates. The CV measures the amount of sampling error relative to the size of the estimate, expressed as a percentage
High Reliability: Small CVs (less than or equal to 12 percent) are flagged green to indicate that the sampling error is small relative to the estimate and the estimate is reasonably reliable.
Medium Reliability: Estimates with CVs between 12 and 40 are flagged yellow-use with caution.
Low Reliability: Large CVs (over 40 percent) are flagged red to indicate that the sampling error is large relative to the estimate. The estimate is considered very unreliable.
Source: U.S. Census Bureau, 2017-2021 American Community Survey Reliability: high medium low
4422 S Highway 97, Redmond, Oregon, 97756 Prepared by Esri Ring: 1 mile radius Latitude: 44.23435 Longitude: -121.20029 2017-2021 ACS Estimate Percent MOE(±) Reliability HOUSEHOLDS BY OTHER INCOME Social Security Income 585 58 8% 331 No Social Security Income 410 41.2% 196 Retirement Income 269 27 0% 152 No Retirement Income 726 73 0% 333 GROSS RENT AS A PERCENTAGE OF HOUSEHOLD INCOME IN THE PAST 12 MONTHS <10% of Income 0 0.0% 0 10-14 9% of Income 10 2.8% 82 15-19 9% of Income 1 0 3% 21 20-24 9% of Income 50 13 9% 96 25-29.9% of Income 4 1.1% 51 30-34 9% of Income 4 1.1% 68 35-39 9% of Income 1 0 3% 50 40-49 9% of Income 66 18 3% 135 50+% of Income 212 58 9% 304 Gross Rent % Inc Not Computed 11 3.1% 22 HOUSEHOLDS BY PUBLIC ASSISTANCE INCOME IN THE PAST 12 MONTHS Total 995 100.0% 327 With public assistance income 25 2.5% 44 No public assistance income 970 97.5% 322 HOUSEHOLDS BY FOOD STAMPS/SNAP STATUS Total 995 100.0% 327 With Food Stamps/SNAP 73 7.3% 94 With No Food Stamps/SNAP 922 92.7% 342 HOUSEHOLDS BY DISABILITY STATUS Total 995 100.0% 327 With 1+ Persons w/Disability 430 43.2% 321 With No Person w/Disability 565 56.8% 221
September 13, 2023 ©2023 Esri Page 8 of 24
ACS Population Summary
4422 S Highway 97, Redmond, Oregon, 97756 Prepared by Esri Ring: 3 mile radius Latitude: 44.23435 Longitude: -121.20029 2017-2021 ACS Estimate Percent MOE(±) Reliability TOTALS Total Population 22,064 1,630 Total Households 8,327 700 Total Housing Units 8,420 606 POPULATION AGE 3+ YEARS BY SCHOOL ENROLLMENT Total 21,220 100.0% 1,611 Enrolled in school 4,793 22 6% 705 Enrolled in nursery school, preschool 298 1 4% 211 Public school 173 0.8% 165 Private school 126 0 6% 132 Enrolled in kindergarten 237 1.1% 178 Public school 225 1 1% 178 Private school 12 0.1% 19 Enrolled in grade 1 to grade 4 1,247 5.9% 346 Public school 865 4.1% 319 Private school 382 1 8% 229 Enrolled in grade 5 to grade 8 1,348 6.4% 319 Public school 1,264 6 0% 302 Private school 85 0.4% 98 Enrolled in grade 9 to grade 12 1,100 5 2% 358 Public school 1,029 4.8% 351 Private school 71 0.3% 71 Enrolled in college undergraduate years 490 2.3% 164 Public school 424 2.0% 147 Private school 66 0.3% 75 Enrolled in graduate or professional school 72 0 3% 56 Public school 14 0.1% 22 Private school 58 0.3% 52 Not enrolled in school 16,427 77.4% 947 POPULATION AGE 65+ BY RELATIONSHIP AND HOUSEHOLD TYPE Total 2,910 100.0% 360 Living in Households 2,803 96 3% 357 Living in Family Households 1,891 65 0% 316 Householder 1,041 35 8% 179 Spouse 692 23 8% 145 Parent 10 0.3% 13 Parent-in-law 7 0 2% 37 Other Relative 90 3.1% 80 Nonrelative 51 1.8% 65 Living in Nonfamily Households 912 31 3% 174 Householder 872 30.0% 174 Nonrelative 41 1.4% 30 Living in Group Quarters 107 3 7% 46 Source: U.S. Census Bureau, 2017-2021 American Community Survey Reliability: high medium low September 13, 2023 ©2023 Esri Page 9 of 24
ACS Population Summary
HOUSEHOLD TYPE BY RELATIVES AND NONRELATIVES FOR POPULATION IN
4422 S Highway 97, Redmond, Oregon, 97756 Prepared by Esri Ring: 3 mile radius Latitude: 44.23435 Longitude: -121.20029 2017-2021 ACS Estimate Percent MOE(±) Reliability HOUSEHOLDS BY TYPE AND SIZE Family Households 5,282 63 4% 584 2-Person 1,960 23.5% 396 3-Person 1,525 18 3% 350 4-Person 1,024 12 3% 377 5-Person 375 4 5% 155 6-Person 292 3.5% 192 7+ Person 107 1.3% 75 Nonfamily Households 3,045 36 6% 542 1-Person 2,092 25 1% 456 2-Person 747 9.0% 319 3-Person 166 2 0% 116 4-Person 40 0.5% 64 5-Person 0 0.0% 0 6-Person 0 0.0% 0 7+ Person 0 0.0% 0 HOUSEHOLDS BY PRESENCE OF PEOPLE UNDER 18 YEARS BY HOUSEHOLD TYPE Households with one or more people under 18 years 2,924 35.1% 481 Family households 2,906 34.9% 480 Married-couple family 1,995 24.0% 446 Male householder, no wife present 420 5.0% 164 Female householder, no husband present 491 5.9% 228 Nonfamily households 18 0.2% 21 Households with no people under 18 years 5,403 64.9% 594 Married-couple family 1,863 22.4% 332 Other family 513 6.2% 266 Nonfamily households 3,027 36.4% 542 HOUSEHOLDS BY PRESENCE OF PEOPLE 65 YEARS AND OVER, HOUSEHOLD SIZE AND HOUSEHOLD TYPE Households with Pop 65+ 2,081 25.0% 409 1-Person 840 10.1% 335 2+ Person Family 1,203 14.4% 253 2+ Person Nonfamily 38 0.5% 36 Households with No Pop 65+ 6,246 75.0% 656 1-Person 1,252 15.0% 335 2+ Person Family 4,079 49.0% 570 2+ Person Nonfamily 915 11.0% 344
IN HOUSEHOLDS Total 21,901 100.0% 1,630 In Family Households 17,536 80 1% 1,609 In Married-Couple Family 13,317 60 8% 1,556 Relatives 13,094 59 8% 1,546 Nonrelatives 223 1.0% 147 In Male Householder-No Spouse Present-Family 1,739 7.9% 529 Relatives 1,216 5 6% 396 Nonrelatives 522 2.4% 248 In Female Householder-No Spouse Present-Family 2,481 11 3% 730 Relatives 2,303 10.5% 706 Nonrelatives 178 0 8% 164 In Nonfamily Households 4,365 19 9% 727 Source: U.S. Census Bureau, 2017-2021 American Community Survey Reliability: high medium low September 13, 2023 ©2023 Esri Page 10 of 24
HOUSEHOLDS POPULATION
ACS Population Summary
4422 S Highway 97, Redmond, Oregon, 97756 Prepared by Esri Ring: 3 mile radius Latitude: 44.23435 Longitude: -121.20029 2017-2021 ACS Estimate Percent MOE(±) Reliability POPULATION AGE 5+ YEARS BY LANGUAGE SPOKEN AT HOME AND ABILITY TO SPEAK ENGLISH Total 20,819 100.0% 1,603 5 to 17 years Speak only English 3,431 16 5% 615 Speak Spanish 753 3.6% 389 Speak English "very well" or "well" 721 3.5% 389 Speak English "not well" 32 0.2% 59 Speak English "not at all" 0 0 0% 0 Speak other Indo-European languages 3 0.0% 8 Speak English "very well" or "well" 3 0.0% 8 Speak English "not well" 0 0.0% 0 Speak English "not at all" 0 0 0% 0 Speak Asian and Pacific Island languages 19 0.1% 35 Speak English "very well" or "well" 0 0.0% 0 Speak English "not well" 19 0.1% 35 Speak English "not at all" 0 0 0% 0 Speak other languages 0 0.0% 0 Speak English "very well" or "well" 0 0.0% 0 Speak English "not well" 0 0.0% 0 Speak English "not at all" 0 0 0% 0 18 to 64 years Speak only English 11,916 57.2% 1,117 Speak Spanish 1,537 7.4% 428 Speak English "very well" or "well" 986 4 7% 407 Speak English "not well" 453 2.2% 247 Speak English "not at all" 98 0 5% 122 Speak other Indo-European languages 148 0.7% 149 Speak English "very well" or "well" 148 0 7% 148 Speak English "not well" 0 0.0% 0 Speak English "not at all" 0 0 0% 0 Speak Asian and Pacific Island languages 101 0.5% 70 Speak English "very well" or "well" 84 0.4% 60 Speak English "not well" 17 0.1% 27 Speak English "not at all" 0 0 0% 0 Speak other languages 0 0.0% 0 Speak English "very well" or "well" 0 0.0% 0 Speak English "not well" 0 0.0% 0 Speak English "not at all" 0 0 0% 0 65 years and over Speak only English 2,670 12 8% 358 Speak Spanish 95 0.5% 94 Speak English "very well" or "well" 78 0.4% 113 Speak English "not well" 0 0.0% 0 Speak English "not at all" 17 0 1% 74 Speak other Indo-European languages 71 0.3% 201 Speak English "very well" or "well" 70 0.3% 207 Speak English "not well" 0 0.0% 2 Speak English "not at all" 0 0 0% 0 Speak Asian and Pacific Island languages 75 0.4% 49 Speak English "very well" or "well" 53 0.3% 67 Speak English "not well" 22 0.1% 37 Speak English "not at all" 0 0 0% 0 Speak other languages 0 0.0% 0 Speak English "very well" or "well" 0 0.0% 0 Speak English "not well" 0 0.0% 0 Speak English "not at all" 0 0 0% 0 Source: U.S. Census Bureau, 2017-2021 American Community Survey Reliability: high medium low September 13, 2023 ©2023 Esri Page 11 of 24
4422 S Highway 97, Redmond, Oregon, 97756 Prepared by Esri Ring: 3 mile radius Latitude: 44.23435 Longitude: -121.20029 2017-2021 ACS Estimate Percent MOE(±) Reliability WORKERS AGE 16+ YEARS BY PLACE OF WORK Total 10,946 100.0% 1,119 Worked in state and in county of residence 10,096 92.2% 1,118 Worked in state and outside county of residence 709 6 5% 228 Worked outside state of residence 141 1.3% 91 SEX BY CLASS OF WORKER FOR THE CIVILIAN EMPLOYED POPULATION 16 YEARS AND OVER Total: 11,178 100.0% 1,111 Male: 5,825 52 1% 629 Employee of private company workers 4,232 37 9% 592 Self-employed in own incorporated business workers 411 3.7% 140 Private not-for-profit wage and salary workers 239 2.1% 105 Local government workers 87 0.8% 60 State government workers 143 1 3% 95 Federal government workers 97 0.9% 61 Self-employed in own not incorporated business workers 617 5 5% 261 Unpaid family workers 0 0.0% 0 Female: 5,353 47 9% 662 Employee of private company workers 3,490 31 2% 625 Self-employed in own incorporated business workers 196 1 8% 49 Private not-for-profit wage and salary workers 615 5.5% 222 Local government workers 575 5.1% 224 State government workers 78 0.7% 100 Federal government workers 56 0.5% 69 Self-employed in own not incorporated business workers 337 3.0% 146 Unpaid family workers 5 0 0% 23 POPULATION IN HOUSEHOLDS AND PRESENCE OF A COMPUTER Total 21,901 100.0% 1,630 Population <18 in Households 5,452 24 9% 690 Have a Computer 5,338 24 4% 689 Have NO Computer 114 0.5% 147 Population 18-64 in Households 13,646 62 3% 1,172 Have a Computer 13,395 61 2% 1,182 Have NO Computer 251 1.1% 141 Population 65+ in Households 2,803 12 8% 357 Have a Computer 2,379 10.9% 322 Have NO Computer 424 1 9% 231 HOUSEHOLDS AND INTERNET SUBSCRIPTIONS Total 8,327 100.0% 700 With an Internet Subscription 7,609 91.4% 642 Dial-Up Alone 52 0 6% 68 Broadband 6,290 75 5% 629 Satellite Service 592 7.1% 177 Other Service 39 0 5% 40 Internet Access with no Subscription 61 0.7% 64 With No Internet Access 658 7 9% 351 Source: U.S. Census Bureau, 2017-2021 American Community Survey Reliability: high medium low September 13, 2023 ©2023 Esri Page 12 of 24
ACS Population Summary
4422 S Highway 97, Redmond, Oregon, 97756 Prepared by Esri Ring: 3 mile radius Latitude: 44.23435 Longitude: -121.20029 2017-2021 ACS Estimate Percent MOE(±) Reliability WORKERS AGE 16+ YEARS BY MEANS OF TRANSPORTATION TO WORK Total 10,946 100.0% 1,119 Drove alone 8,714 79 6% 1,061 Carpooled 852 7 8% 215 Public transportation (excluding taxicab) 70 0.6% 85 Bus or trolley bus 70 0.6% 85 Light rail, streetcar or trolley 0 0.0% 0 Subway or elevated 0 0.0% 0 Long-distance/Commuter Train 0 0.0% 0 Ferryboat 0 0.0% 0 Taxicab 39 0.4% 75 Motorcycle 81 0.7% 116 Bicycle 128 1.2% 147 Walked 163 1 5% 67 Other means 106 1.0% 122 Worked at home 792 7 2% 269
BY TRAVEL TIME TO WORK Total 10,154 100.0% 1,081 Less than 5 minutes 631 6.2% 139 5 to 9 minutes 1,647 16.2% 337 10 to 14 minutes 1,845 18 2% 470 15 to 19 minutes 669 6 6% 207 20 to 24 minutes 1,719 16 9% 446 25 to 29 minutes 1,511 14 9% 447 30 to 34 minutes 1,361 13.4% 324 35 to 39 minutes 205 2 0% 95 40 to 44 minutes 227 2.2% 124 45 to 59 minutes 154 1 5% 61 60 to 89 minutes 48 0.5% 60 90 or more minutes 138 1 4% 108 Average Travel Time to Work (in minutes) N/A N/A
AGE 20-64 YEARS
AGE OF OWN CHILDREN AND EMPLOYMENT STATUS Total 6,806 100.0% 692 Own children under 6 years only 702 10.3% 261 In labor force 579 8 5% 232 Not in labor force 123 1.8% 123 Own children under 6 years and 6 to 17 years 513 7 5% 220 In labor force 307 4.5% 203 Not in labor force 206 3 0% 139 Own children 6 to 17 years only 1,436 21.1% 395 In labor force 1,150 16 9% 362 Not in labor force 286 4.2% 155 No own children under 18 years 4,155 61 0% 594 In labor force 3,354 49.3% 573 Not in labor force 801 11 8% 209 Source: U.S. Census Bureau, 2017-2021 American Community Survey Reliability: high medium low September 13, 2023 ©2023 Esri Page 13 of 24
ACS Population Summary
WORKERS AGE 16+ YEARS (WHO DID NOT WORK FROM HOME)
FEMALES
BY
4422 S Highway 97, Redmond, Oregon, 97756 Prepared by Esri Ring: 3 mile radius Latitude: 44.23435 Longitude: -121.20029 2017-2021 ACS Estimate Percent MOE(±) Reliability CIVILIAN NONINSTITUTIONALIZED POPULATION BY AGE & TYPES OHEALINSURANCE COVERAGE OF HEALTH INSURANCE COVERAGE Total 22,030 100.0% 1,630 Under 19 years: 5,835 26 5% 734 One Type of Health Insurance: 5,298 24 0% 688 Employer-Based Health Ins Only 1,405 6.4% 406 Direct-Purchase Health Ins Only 608 2 8% 382 Medicare Coverage Only 0 0.0% 0 Medicaid Coverage Only 3,283 14 9% 527 TRICARE/Military Hlth Cov Only 2 0.0% 26 VA Health Care Only 0 0.0% 0 2+ Types of Health Insurance 471 2.1% 264 No Health Insurance Coverage 67 0.3% 43 19 to 34 years: 4,371 19.8% 716 One Type of Health Insurance: 3,322 15.1% 511 Employer-Based Health Ins Only 2,207 10 0% 397 Direct-Purchase Health Ins Only 291 1 3% 181 Medicare Coverage Only 0 0.0% 0 Medicaid Coverage Only 779 3 5% 274 TRICARE/Military Hlth Cov Only 36 0.2% 48 VA Health Care Only 9 0 0% 16 2+ Types of Health Insurance 457 2.1% 252 No Health Insurance Coverage 593 2 7% 297 35 to 64 years: 8,943 40 6% 983 One Type of Health Insurance: 6,319 28 7% 879 Employer-Based Health Ins Only 4,050 18 4% 790 Direct-Purchase Health Ins Only 982 4 5% 364 Medicare Coverage Only 128 0.6% 84 Medicaid Coverage Only 1,045 4 7% 309 TRICARE/Military Hlth Cov Only 50 0.2% 53 VA Health Care Only 64 0 3% 46 2+ Types of Health Insurance 1,437 6.5% 403 No Health Insurance Coverage 1,188 5.4% 352 65+ years: 2,881 13.1% 360 One Type of Health Insurance: 1,284 5.8% 323 Employer-Based Health Ins Only 65 0.3% 51 Direct-Purchase Health Ins Only 1 0.0% 14 Medicare Coverage Only 1,218 5.5% 323 TRICARE/Military Hlth Cov Only 0 0 0% 0 VA Health Care Only 0 0.0% 0 2+ Types of Health Insurance: 1,589 7 2% 203 Employer-Based & Direct-Purchase Health Insurance 0 0.0% 0 Employer-Based Health & Medicare Insurance 217 1 0% 74 Direct-Purchase Health & Medicare Insurance 581 2.6% 166 Medicare & Medicaid Coverage 143 0 6% 80 Other Private Health Insurance Combos 0 0.0% 0 Other Public Health Insurance Combos 55 0.2% 25 Other Health Insurance Combinations 593 2.7% 135 No Health Insurance Coverage 7 0.0% 13 Source: U.S. Census Bureau, 2017-2021 American Community Survey Reliability: high medium low September 13, 2023 ©2023 Esri Page 14 of 24
ACS Population Summary
ACS Population Summary
CIVILIAN POPULATION AGE 18 OR OLDER BY VETERAN STATUS
CIVILIAN VETERANS AGE 18 OR OLDER BY PERIOD OF MILITARY SERVICE
4422 S Highway 97, Redmond, Oregon, 97756 Prepared by Esri Ring: 3 mile radius Latitude: 44.23435 Longitude: -121.20029 2017-2021 ACS Estimate Percent MOE(±) Reliability POPULATION BY RATIO
LEVEL Total 21,838 100.0% 1,630 Under 50 664 3.0% 246 50 to 99 1,204 5 5% 347 1 00 to 1 24 819 3.8% 258 1 25 to 1 49 1,448 6 6% 695 1 50 to 1 84 2,218 10 2% 659 1 85 to 1 99 500 2 3% 512 2 00 and over 14,986 68 6% 1,547
OF INCOME TO POVERTY
Total 16,612 100.0% 1,178 Veteran 1,190 7.2% 209 Nonveteran 15,422 92.8% 1,159 Male 7,669 46 2% 636 Veteran 1,056 6 4% 164 Nonveteran 6,613 39 8% 642 Female 8,943 53 8% 738 Veteran 134 0.8% 122 Nonveteran 8,809 53 0% 735
Total 1,190 100.0% 209 Gulf War (9/01 or later), no Gulf War (8/90 to 8/01), no Vietnam Era 271 22 8% 133 Gulf War (9/01 or later) and Gulf War (8/90 to 8/01), no Vietnam Era 48 4.0% 33 Gulf War (9/01 or later), and Gulf War (8/90 to 8/01), and Vietnam Era 0 0.0% 0 Gulf War (8/90 to 8/01), no Vietnam Era 149 12.5% 98 Gulf War (8/90 to 8/01) and Vietnam Era 0 0.0% 0 Vietnam Era, no Korean War, no World War II 489 41 1% 116 Vietnam Era and Korean War, no World War II 0 0.0% 0 Vietnam Era and Korean War and World War II 0 0.0% 0 Korean War, no Vietnam Era, no World War II 30 2.5% 31 Korean War and World War II, no Vietnam Era 0 0 0% 0 World War II, no Korean War, no Vietnam Era 35 2.9% 60 Between Gulf War and Vietnam Era only 117 9 8% 85 Between Vietnam Era and Korean War only 52 4.4% 51 Between Korean War and World War II only 0 0.0% 0 Pre-World War II only 0 0.0% 0 HOUSEHOLDS BY POVERTY STATUS Total 8,327 100.0% 700 Income in the past 12 months below poverty level 689 8.3% 211 Married-couple family 89 1.1% 71 Other family - male householder (no wife present) 131 1.6% 97 Other family - female householder (no husband present) 122 1 5% 74 Nonfamily household - male householder 91 1.1% 78 Nonfamily household - female householder 256 3.1% 145 Income in the past 12 months at or above poverty level 7,638 91 7% 707 Married-couple family 3,770 45 3% 534 Other family - male householder (no wife present) 364 4.4% 156 Other family - female householder (no husband present) 807 9.7% 334 Nonfamily household - male householder 953 11.4% 278 Nonfamily household - female householder 1,744 20 9% 468 Poverty Index 67 Source: U.S. Census Bureau, 2017-2021 American Community Survey Reliability: high medium low September 13, 2023 ©2023 Esri Page 15 of 24
ACS Population Summary
Data Note: N/A means not available Population by Ratio of Income to Poverty Level represents persons for whom poverty status is determined. Household income represents income in 2021, adjusted for inflation
2017-2021 ACS Estimate: The American Community Survey (ACS) replaces census sample data. Esri is releasing the 2017-2021 ACS estimates, five-year period data collected monthly from January 1, 2017 through December 31, 2021. Although the ACS includes many of the subjects previously covered by the decennial census sample, there are significant differences between the two surveys including fundamental differences in survey design and residency rules
Margin of error (MOE): The MOE is a measure of the variability of the estimate due to sampling error. MOEs enable the data user to measure the range of uncertainty for each estimate with 90 percent confidence. The range of uncertainty is called the confidence interval, and it is calculated by taking the estimate +/- the MOE. For example, if the ACS reports an estimate of 100 with an MOE of +/- 20, then you can be 90 percent certain the value for the whole population falls between 80 and 120.
Reliability: These symbols represent threshold values that Esri has established from the Coefficients of Variation (CV) to designate the usability of the estimates. The CV measures the amount of sampling error relative to the size of the estimate, expressed as a percentage
High Reliability: Small CVs (less than or equal to 12 percent) are flagged green to indicate that the sampling error is small relative to the estimate and the estimate is reasonably reliable.
Medium Reliability: Estimates with CVs between 12 and 40 are flagged yellow-use with caution.
Low Reliability: Large CVs (over 40 percent) are flagged red to indicate that the sampling error is large relative to the estimate. The estimate is considered very unreliable.
Source: U.S. Census Bureau, 2017-2021 American Community Survey
Reliability: high medium low September
4422 S Highway 97, Redmond, Oregon, 97756 Prepared by Esri Ring: 3 mile radius Latitude: 44.23435 Longitude: -121.20029 2017-2021 ACS Estimate Percent MOE(±) Reliability HOUSEHOLDS BY OTHER INCOME Social Security Income 2,551 30 6% 477 No Social Security Income 5,776 69.4% 626 Retirement Income 1,247 15 0% 268 No Retirement Income 7,080 85 0% 718 GROSS RENT AS A PERCENTAGE OF HOUSEHOLD INCOME IN THE PAST 12 MONTHS <10% of Income 90 2.9% 106 10-14 9% of Income 310 10 0% 207 15-19 9% of Income 455 14 6% 218 20-24 9% of Income 371 11 9% 185 25-29.9% of Income 319 10.2% 166 30-34 9% of Income 177 5.7% 113 35-39 9% of Income 383 12 3% 276 40-49 9% of Income 313 10 0% 164 50+% of Income 623 20 0% 338 Gross Rent % Inc Not Computed 73 2.3% 70 HOUSEHOLDS BY PUBLIC ASSISTANCE INCOME IN THE PAST 12 MONTHS Total 8,327 100.0% 700 With public assistance income 267 3.2% 141 No public assistance income 8,060 96.8% 701 HOUSEHOLDS BY FOOD STAMPS/SNAP STATUS Total 8,327 100.0% 700 With Food Stamps/SNAP 1,489 17.9% 326 With No Food Stamps/SNAP 6,838 82.1% 700 HOUSEHOLDS BY DISABILITY STATUS Total 8,327 100.0% 700 With 1+ Persons w/Disability 2,331 28.0% 497 With No Person w/Disability 5,996 72.0% 675
13, 2023 ©2023 Esri Page 16 of 24
4422 S Highway 97, Redmond, Oregon, 97756 Prepared by Esri Ring: 5 mile radius Latitude: 44.23435 Longitude: -121.20029 2017-2021 ACS Estimate Percent MOE(±) Reliability TOTALS Total Population 38,169 2,276 Total Households 14,873 794 Total Housing Units 15,541 806 POPULATION AGE 3+ YEARS BY SCHOOL ENROLLMENT Total 36,858 100.0% 2,210 Enrolled in school 7,743 21 0% 933 Enrolled in nursery school, preschool 517 1 4% 222 Public school 323 0.9% 178 Private school 194 0 5% 132 Enrolled in kindergarten 268 0.7% 178 Public school 234 0 6% 178 Private school 34 0.1% 23 Enrolled in grade 1 to grade 4 1,916 5.2% 486 Public school 1,460 4.0% 374 Private school 455 1 2% 318 Enrolled in grade 5 to grade 8 2,114 5.7% 438 Public school 1,897 5 1% 419 Private school 216 0.6% 116 Enrolled in grade 9 to grade 12 1,790 4 9% 434 Public school 1,649 4.5% 427 Private school 142 0 4% 82 Enrolled in college undergraduate years 996 2.7% 273 Public school 884 2.4% 255 Private school 113 0.3% 100 Enrolled in graduate or professional school 142 0 4% 83 Public school 55 0.1% 50 Private school 87 0.2% 66 Not enrolled in school 29,115 79.0% 1,371 POPULATION AGE 65+ BY RELATIONSHIP AND HOUSEHOLD TYPE Total 6,483 100.0% 643 Living in Households 6,362 98 1% 636 Living in Family Households 4,439 68 5% 528 Householder 2,328 35 9% 309 Spouse 1,749 27 0% 255 Parent 42 0.6% 24 Parent-in-law 101 1 6% 102 Other Relative 140 2.2% 90 Nonrelative 78 1.2% 67 Living in Nonfamily Households 1,923 29 7% 402 Householder 1,816 28.0% 388 Nonrelative 108 1.7% 76 Living in Group Quarters 121 1 9% 97 Source: U.S. Census Bureau, 2017-2021 American Community Survey Reliability: high medium low September 13, 2023 ©2023 Esri Page 17 of 24
ACS Population Summary
ACS Population Summary
4422 S Highway 97, Redmond, Oregon, 97756 Prepared by Esri Ring: 5 mile radius Latitude: 44.23435 Longitude: -121.20029 2017-2021 ACS Estimate Percent MOE(±) Reliability HOUSEHOLDS BY TYPE AND SIZE Family Households 9,714 65 3% 684 2-Person 4,198 28.2% 475 3-Person 2,556 17 2% 488 4-Person 1,611 10 8% 409 5-Person 809 5 4% 201 6-Person 397 2.7% 213 7+ Person 144 1.0% 91 Nonfamily Households 5,158 34 7% 619 1-Person 3,692 24 8% 532 2-Person 1,152 7.7% 343 3-Person 247 1 7% 134 4-Person 68 0.5% 73 5-Person 0 0.0% 0 6-Person 0 0.0% 0 7+ Person 0 0.0% 0 HOUSEHOLDS BY PRESENCE OF PEOPLE UNDER 18 YEARS BY HOUSEHOLD TYPE Households with one or more people under 18 years 4,503 30.3% 552 Family households 4,448 29.9% 551 Married-couple family 3,097 20.8% 508 Male householder, no wife present 565 3.8% 214 Female householder, no husband present 786 5.3% 352 Nonfamily households 55 0.4% 47 Households with no people under 18 years 10,370 69.7% 701 Married-couple family 4,299 28.9% 448 Other family 968 6.5% 294 Nonfamily households 5,103 34.3% 619 HOUSEHOLDS BY PRESENCE OF PEOPLE 65 YEARS AND OVER, HOUSEHOLD SIZE AND HOUSEHOLD TYPE Households with Pop 65+ 4,624 31.1% 472 1-Person 1,633 11.0% 386 2+ Person Family 2,790 18.8% 316 2+ Person Nonfamily 201 1.4% 80 Households with No Pop 65+ 10,249 68.9% 760 1-Person 2,059 13.8% 398 2+ Person Family 6,924 46.6% 668 2+ Person Nonfamily 1,266 8.5% 367 HOUSEHOLD TYPE
RELATIVES AND NONRELATIVES
IN HOUSEHOLDS POPULATION IN HOUSEHOLDS Total 37,950 100.0% 2,272 In Family Households 30,796 81 1% 2,264 In Married-Couple Family 23,482 61 9% 2,267 Relatives 23,115 60 9% 2,243 Nonrelatives 367 1.0% 262 In Male Householder-No Spouse Present-Family 2,461 6.5% 805 Relatives 1,811 4 8% 566 Nonrelatives 651 1.7% 368 In Female Householder-No Spouse Present-Family 4,853 12 8% 1,317 Relatives 4,420 11.6% 1,162 Nonrelatives 433 1 1% 279 In Nonfamily Households 7,154 18 9% 963 Source: U.S. Census Bureau, 2017-2021 American Community Survey Reliability: high medium low September 13, 2023 ©2023 Esri Page 18 of 24
BY
FOR POPULATION
4422 S Highway 97, Redmond, Oregon, 97756 Prepared by Esri Ring: 5 mile radius Latitude: 44.23435 Longitude: -121.20029 2017-2021 ACS Estimate Percent MOE(±) Reliability POPULATION AGE 5+ YEARS BY LANGUAGE SPOKEN AT HOME AND ABILITY TO SPEAK ENGLISH Total 36,156 100.0% 2,156 5 to 17 years Speak only English 5,411 15 0% 822 Speak Spanish 957 2.6% 464 Speak English "very well" or "well" 845 2.3% 430 Speak English "not well" 112 0.3% 113 Speak English "not at all" 0 0 0% 0 Speak other Indo-European languages 10 0.0% 10 Speak English "very well" or "well" 10 0.0% 10 Speak English "not well" 0 0.0% 0 Speak English "not at all" 0 0 0% 0 Speak Asian and Pacific Island languages 19 0.1% 35 Speak English "very well" or "well" 0 0.0% 0 Speak English "not well" 19 0.1% 35 Speak English "not at all" 0 0 0% 0 Speak other languages 0 0.0% 0 Speak English "very well" or "well" 0 0.0% 0 Speak English "not well" 0 0.0% 0 Speak English "not at all" 0 0 0% 0 18 to 64 years Speak only English 20,642 57.1% 1,514 Speak Spanish 2,153 6.0% 565 Speak English "very well" or "well" 1,495 4 1% 441 Speak English "not well" 560 1.5% 336 Speak English "not at all" 98 0 3% 122 Speak other Indo-European languages 364 1.0% 193 Speak English "very well" or "well" 364 1 0% 192 Speak English "not well" 0 0.0% 0 Speak English "not at all" 0 0 0% 0 Speak Asian and Pacific Island languages 116 0.3% 84 Speak English "very well" or "well" 99 0.3% 73 Speak English "not well" 17 0.0% 27 Speak English "not at all" 0 0 0% 0 Speak other languages 0 0.0% 0 Speak English "very well" or "well" 0 0.0% 0 Speak English "not well" 0 0.0% 0 Speak English "not at all" 0 0 0% 0 65 years and over Speak only English 6,021 16 7% 615 Speak Spanish 194 0.5% 140 Speak English "very well" or "well" 112 0 3% 116 Speak English "not well" 30 0.1% 39 Speak English "not at all" 52 0 1% 78 Speak other Indo-European languages 191 0.5% 204 Speak English "very well" or "well" 190 0 5% 210 Speak English "not well" 1 0.0% 5 Speak English "not at all" 0 0 0% 0 Speak Asian and Pacific Island languages 77 0.2% 86 Speak English "very well" or "well" 53 0.1% 77 Speak English "not well" 24 0.1% 38 Speak English "not at all" 0 0 0% 0 Speak other languages 0 0.0% 0 Speak English "very well" or "well" 0 0.0% 0 Speak English "not well" 0 0.0% 0 Speak English "not at all" 0 0 0% 0 Source: U.S. Census Bureau, 2017-2021 American Community Survey Reliability: high medium low September 13, 2023 ©2023 Esri Page 19 of 24
ACS Population Summary
4422 S Highway 97, Redmond, Oregon, 97756 Prepared by Esri Ring: 5 mile radius Latitude: 44.23435 Longitude: -121.20029 2017-2021 ACS Estimate Percent MOE(±) Reliability WORKERS AGE 16+ YEARS BY PLACE OF WORK Total 18,444 100.0% 1,393 Worked in state and in county of residence 17,063 92.5% 1,375 Worked in state and outside county of residence 1,176 6 4% 361 Worked outside state of residence 205 1.1% 114 SEX BY CLASS OF WORKER FOR THE CIVILIAN EMPLOYED POPULATION 16 YEARS AND OVER Total: 18,853 100.0% 1,414 Male: 9,700 51 5% 859 Employee of private company workers 6,751 35 8% 809 Self-employed in own incorporated business workers 903 4.8% 249 Private not-for-profit wage and salary workers 358 1.9% 164 Local government workers 280 1.5% 117 State government workers 235 1 2% 115 Federal government workers 243 1.3% 92 Self-employed in own not incorporated business workers 929 4 9% 398 Unpaid family workers 3 0.0% 22 Female: 9,153 48 5% 841 Employee of private company workers 5,659 30 0% 786 Self-employed in own incorporated business workers 578 3 1% 153 Private not-for-profit wage and salary workers 1,183 6.3% 266 Local government workers 878 4.7% 310 State government workers 183 1.0% 104 Federal government workers 99 0.5% 74 Self-employed in own not incorporated business workers 558 3.0% 194 Unpaid family workers 15 0 1% 23 POPULATION IN HOUSEHOLDS AND PRESENCE OF A COMPUTER Total 37,950 100.0% 2,272 Population <18 in Households 8,411 22 2% 1,001 Have a Computer 8,297 21 9% 1,001 Have NO Computer 114 0.3% 149 Population 18-64 in Households 23,177 61 1% 1,601 Have a Computer 22,856 60 2% 1,611 Have NO Computer 321 0.8% 191 Population 65+ in Households 6,362 16 8% 636 Have a Computer 5,872 15.5% 556 Have NO Computer 490 1 3% 340 HOUSEHOLDS AND INTERNET SUBSCRIPTIONS Total 14,873 100.0% 794 With an Internet Subscription 13,660 91.8% 745 Dial-Up Alone 83 0 6% 77 Broadband 10,994 73 9% 761 Satellite Service 1,442 9 7% 320 Other Service 81 0 5% 41 Internet Access with no Subscription 170 1.1% 85 With No Internet Access 1,042 7 0% 386 Source: U.S. Census Bureau, 2017-2021 American Community Survey Reliability: high medium low September 13, 2023 ©2023 Esri Page 20 of 24
ACS Population Summary
ACS Population Summary
4422 S Highway 97, Redmond, Oregon, 97756 Prepared by Esri Ring: 5 mile radius Latitude: 44.23435 Longitude: -121.20029 2017-2021 ACS Estimate Percent MOE(±) Reliability
AGE 16+ YEARS BY MEANS OF TRANSPORTATION TO WORK Total 18,444 100.0% 1,393 Drove alone 13,936 75 6% 1,307 Carpooled 1,719 9 3% 353 Public transportation (excluding taxicab) 134 0.7% 131 Bus or trolley bus 134 0 7% 131 Light rail, streetcar or trolley 0 0.0% 0 Subway or elevated 0 0.0% 0 Long-distance/Commuter Train 0 0.0% 0 Ferryboat 0 0.0% 0 Taxicab 57 0.3% 81 Motorcycle 97 0.5% 121 Bicycle 143 0.8% 165 Walked 314 1 7% 144 Other means 225 1.2% 232 Worked at home 1,818 9 9% 375
BY TRAVEL TIME TO WORK Total 16,626 100.0% 1,347 Less than 5 minutes 911 5.5% 305 5 to 9 minutes 2,699 16.2% 544 10 to 14 minutes 2,863 17 2% 590 15 to 19 minutes 1,465 8 8% 308 20 to 24 minutes 2,349 14 1% 567 25 to 29 minutes 2,168 13 0% 704 30 to 34 minutes 2,610 15.7% 435 35 to 39 minutes 398 2 4% 152 40 to 44 minutes 435 2.6% 145 45 to 59 minutes 347 2 1% 107 60 to 89 minutes 188 1.1% 132 90 or more minutes 192 1 2% 113 Average Travel Time to Work (in minutes) N/A N/A FEMALES AGE 20-64 YEARS BY AGE OF OWN CHILDREN AND EMPLOYMENT STATUS Total 11,722 100.0% 926 Own children under 6 years only 1,202 10.3% 412 In labor force 993 8 5% 386 Not in labor force 209 1.8% 154 Own children under 6 years and 6 to 17 years 685 5 8% 279 In labor force 423 3.6% 210 Not in labor force 262 2 2% 185 Own children 6 to 17 years only 2,262 19.3% 467 In labor force 1,861 15 9% 433 Not in labor force 401 3.4% 174 No own children under 18 years 7,573 64 6% 811 In labor force 5,869 50.1% 766 Not in labor force 1,704 14 5% 308 Source: U.S. Census Bureau, 2017-2021 American Community Survey Reliability: high medium low September 13, 2023 ©2023 Esri Page 21 of 24
WORKERS
WORKERS AGE 16+ YEARS (WHO DID NOT WORK FROM HOME)
4422 S Highway 97, Redmond, Oregon, 97756 Prepared by Esri Ring: 5 mile radius Latitude: 44.23435 Longitude: -121.20029 2017-2021 ACS Estimate Percent MOE(±) Reliability CIVILIAN NONINSTITUTIONALIZED POPULATION BY AGE & TYPES OHEALINSURANCE COVERAGE OF HEALTH INSURANCE COVERAGE Total 38,120 100.0% 2,274 Under 19 years: 9,000 23 6% 1,049 One Type of Health Insurance: 8,269 21 7% 1,002 Employer-Based Health Ins Only 2,835 7.4% 535 Direct-Purchase Health Ins Only 693 1 8% 429 Medicare Coverage Only 0 0.0% 0 Medicaid Coverage Only 4,568 12 0% 870 TRICARE/Military Hlth Cov Only 174 0.5% 153 VA Health Care Only 0 0.0% 0 2+ Types of Health Insurance 587 1.5% 288 No Health Insurance Coverage 143 0.4% 114 19 to 34 years: 7,507 19.7% 1,011 One Type of Health Insurance: 5,970 15.7% 783 Employer-Based Health Ins Only 3,938 10 3% 623 Direct-Purchase Health Ins Only 535 1 4% 316 Medicare Coverage Only 0 0.0% 0 Medicaid Coverage Only 1,397 3 7% 411 TRICARE/Military Hlth Cov Only 87 0.2% 64 VA Health Care Only 12 0 0% 18 2+ Types of Health Insurance 783 2.1% 361 No Health Insurance Coverage 755 2 0% 321 35 to 64 years: 15,163 39 8% 1,280 One Type of Health Insurance: 10,979 28 8% 1,096 Employer-Based Health Ins Only 7,156 18 8% 975 Direct-Purchase Health Ins Only 1,671 4 4% 452 Medicare Coverage Only 213 0.6% 112 Medicaid Coverage Only 1,741 4 6% 359 TRICARE/Military Hlth Cov Only 105 0.3% 75 VA Health Care Only 93 0 2% 74 2+ Types of Health Insurance 2,358 6.2% 515 No Health Insurance Coverage 1,826 4.8% 533 65+ years: 6,450 16.9% 640 One Type of Health Insurance: 2,378 6.2% 503 Employer-Based Health Ins Only 98 0.3% 64 Direct-Purchase Health Ins Only 6 0.0% 21 Medicare Coverage Only 2,275 6.0% 501 TRICARE/Military Hlth Cov Only 0 0 0% 0 VA Health Care Only 0 0.0% 0 2+ Types of Health Insurance: 4,065 10 7% 452 Employer-Based & Direct-Purchase Health Insurance 0 0.0% 0 Employer-Based Health & Medicare Insurance 684 1 8% 179 Direct-Purchase Health & Medicare Insurance 1,756 4.6% 346 Medicare & Medicaid Coverage 296 0 8% 99 Other Private Health Insurance Combos 0 0.0% 0 Other Public Health Insurance Combos 93 0.2% 52 Other Health Insurance Combinations 1,235 3.2% 266 No Health Insurance Coverage 7 0.0% 13 Source: U.S. Census Bureau, 2017-2021 American Community Survey Reliability: high medium low September 13, 2023 ©2023 Esri Page 22 of 24
ACS Population Summary
ACS Population Summary
CIVILIAN POPULATION AGE 18 OR OLDER BY VETERAN STATUS
CIVILIAN VETERANS AGE 18 OR OLDER BY PERIOD OF MILITARY SERVICE
4422 S Highway 97, Redmond, Oregon, 97756 Prepared by Esri Ring: 5 mile radius Latitude: 44.23435 Longitude: -121.20029 2017-2021 ACS Estimate Percent MOE(±) Reliability POPULATION BY RATIO OF INCOME TO POVERTY LEVEL Total 37,855 100.0% 2,273 Under 50 1,412 3.7% 379 50 to 99 1,862 4 9% 525 1 00 to 1 24 1,496 4.0% 678 1 25 to 1 49 2,857 7 5% 1,022 1 50 to 1 84 2,664 7.0% 943 1 85 to 1 99 727 1 9% 518 2 00 and over 26,837 70 9% 2,139
Total 29,749 100.0% 1,632 Veteran 2,588 8.7% 414 Nonveteran 27,161 91.3% 1,545 Male 13,777 46 3% 902 Veteran 2,367 8 0% 389 Nonveteran 11,410 38 4% 858 Female 15,972 53.7% 1,017 Veteran 221 0.7% 131 Nonveteran 15,751 52 9% 1,014
Total 2,589 100.0% 414 Gulf War (9/01 or later), no Gulf War (8/90 to 8/01), no Vietnam Era 502 19 4% 301 Gulf War (9/01 or later) and Gulf War (8/90 to 8/01), no Vietnam Era 70 2.7% 45 Gulf War (9/01 or later), and Gulf War (8/90 to 8/01), and Vietnam Era 0 0.0% 0 Gulf War (8/90 to 8/01), no Vietnam Era 262 10.1% 133 Gulf War (8/90 to 8/01) and Vietnam Era 7 0.3% 20 Vietnam Era, no Korean War, no World War II 937 36 2% 221 Vietnam Era and Korean War, no World War II 2 0.1% 19 Vietnam Era and Korean War and World War II 0 0.0% 0 Korean War, no Vietnam Era, no World War II 106 4.1% 47 Korean War and World War II, no Vietnam Era 0 0 0% 0 World War II, no Korean War, no Vietnam Era 35 1.4% 60 Between Gulf War and Vietnam Era only 499 19 3% 138 Between Vietnam Era and Korean War only 169 6.5% 58 Between Korean War and World War II only 0 0.0% 0 Pre-World War II only 0 0.0% 0 HOUSEHOLDS BY POVERTY STATUS Total 14,873 100.0% 794 Income in the past 12 months below poverty level 1,316 8.8% 269 Married-couple family 205 1 4% 78 Other family - male householder (no wife present) 137 0.9% 123 Other family - female householder (no husband present) 225 1 5% 111 Nonfamily household - male householder 261 1.8% 139 Nonfamily household - female householder 487 3.3% 158 Income in the past 12 months at or above poverty level 13,557 91 2% 807 Married-couple family 7,191 48 3% 662 Other family - male householder (no wife present) 573 3.9% 214 Other family - female householder (no husband present) 1,383 9.3% 442 Nonfamily household - male householder 1,606 10.8% 318 Nonfamily household - female householder 2,804 18 9% 528 Poverty Index 71 Source: U.S. Census Bureau, 2017-2021 American Community Survey Reliability: high medium low September 13, 2023 ©2023 Esri Page 23 of 24
ACS Population Summary
Data Note: N/A means not available Population by Ratio of Income to Poverty Level represents persons for whom poverty status is determined. Household income represents income in 2021, adjusted for inflation
2017-2021 ACS Estimate: The American Community Survey (ACS) replaces census sample data. Esri is releasing the 2017-2021 ACS estimates, five-year period data collected monthly from January 1, 2017 through December 31, 2021. Although the ACS includes many of the subjects previously covered by the decennial census sample, there are significant differences between the two surveys including fundamental differences in survey design and residency rules
Margin of error (MOE): The MOE is a measure of the variability of the estimate due to sampling error. MOEs enable the data user to measure the range of uncertainty for each estimate with 90 percent confidence. The range of uncertainty is called the confidence interval, and it is calculated by taking the estimate +/- the MOE. For example, if the ACS reports an estimate of 100 with an MOE of +/- 20, then you can be 90 percent certain the value for the whole population falls between 80 and 120.
Reliability: These symbols represent threshold values that Esri has established from the Coefficients of Variation (CV) to designate the usability of the estimates. The CV measures the amount of sampling error relative to the size of the estimate, expressed as a percentage
High Reliability: Small CVs (less than or equal to 12 percent) are flagged green to indicate that the sampling error is small relative to the estimate and the estimate is reasonably reliable.
Medium Reliability: Estimates with CVs between 12 and 40 are flagged yellow-use with caution.
Low Reliability: Large CVs (over 40 percent) are flagged red to indicate that the sampling error is large relative to the estimate. The estimate is considered very unreliable.
Source: U.S. Census Bureau, 2017-2021 American Community Survey
Reliability: high medium low September 13,
4422 S Highway 97, Redmond, Oregon, 97756 Prepared by Esri Ring: 5 mile radius Latitude: 44.23435 Longitude: -121.20029 2017-2021 ACS Estimate Percent MOE(±) Reliability HOUSEHOLDS BY OTHER INCOME Social Security Income 5,307 35 7% 557 No Social Security Income 9,566 64.3% 733 Retirement Income 3,174 21 3% 331 No Retirement Income 11,699 78 7% 816 GROSS RENT AS A PERCENTAGE OF HOUSEHOLD INCOME IN THE PAST 12 MONTHS <10% of Income 156 3 3% 108 10-14 9% of Income 444 9.4% 224 15-19 9% of Income 626 13 3% 244 20-24 9% of Income 487 10 4% 213 25-29.9% of Income 500 10.6% 210 30-34 9% of Income 326 6.9% 152 35-39 9% of Income 445 9 5% 277 40-49 9% of Income 491 10 4% 211 50+% of Income 1,102 23 4% 355 Gross Rent % Inc Not Computed 127 2.7% 77 HOUSEHOLDS BY PUBLIC ASSISTANCE INCOME IN THE PAST 12 MONTHS Total 14,873 100.0% 794 With public assistance income 467 3.1% 161 No public assistance income 14,406 96.9% 793 HOUSEHOLDS BY FOOD STAMPS/SNAP STATUS Total 14,873 100.0% 794 With Food Stamps/SNAP 2,124 14.3% 362 With No Food Stamps/SNAP 12,749 85.7% 801 HOUSEHOLDS BY DISABILITY STATUS Total 14,873 100.0% 794 With 1+ Persons w/Disability 4,271 28.7% 569 With No Person w/Disability 10,602 71.3% 785
©2023 Esri Page 24 of 24
2023
Market Profile
Data Note: Household population includes persons not residing in group quarters. Average Household Size is the household population divided by total households. Persons in families include the householder and persons related to the householder by birth, marriage, or adoption. Per Capita Income represents the income received by all persons aged 15 years and over divided by the total population
and
4422 S Highway 97, Redmond, Oregon, 97756 Prepared by Esri Rings: 1, 3, 5 mile radii Latitude: 44.23435 Longitude: -121.20029 1 mile 3 miles 5 miles Population Summary 2010 Total Population 1,449 16,860 30,278 2020 Total Population 2,390 21,093 38,105 2020 Group Quarters 12 54 152 2023 Total Population 2,860 23,063 41,595 2023 Group Quarters 13 54 152 2028 Total Population 2,996 24,164 43,549 2023-2028 Annual Rate 0.93% 0.94% 0.92% 2023 Total Daytime Population 2,761 21,719 39,070 Workers 935 9,834 17,168 Residents 1,826 11,885 21,902 Household Summary 2010 Households 679 6,477 11,703 2010 Average Household Size 2.04 2.56 2.56 2020 Total Households 1,071 8,103 14,726 2020 Average Household Size 2.22 2.60 2.58 2023 Households 1,251 8,919 16,097 2023 Average Household Size 2.28 2.58 2.57 2028 Households 1,314 9,419 16,972 2028 Average Household Size 2.27 2.56 2.56 2023-2028 Annual Rate 0.99% 1.10% 1.06% 2010 Families 431 4,341 8,098 2010 Average Family Size 2.51 3.04 2.99 2023 Families 770 5,805 10,822 2023 Average Family Size 2.85 3.11 3.06 2028 Families 804 6,091 11,352 2028 Average Family Size 2.85 3.09 3.04 2023-2028 Annual Rate 0.87% 0.97% 0.96% Housing Unit Summary 2000 Housing Units 504 4,681 8,117 Owner Occupied Housing Units 68.3% 59.6% 63.8% Renter Occupied Housing Units 22.8% 34.8% 29.4% Vacant Housing Units 8.9% 5.6% 6.8% 2010 Housing Units 745 7,138 13,427 Owner Occupied Housing Units 67.8% 49.6% 52.6% Renter Occupied Housing Units 23.2% 41.1% 34.6% Vacant Housing Units 8.9% 9.3% 12.8% 2020 Housing Units 1,170 8,547 15,929 Vacant Housing Units 8.5% 5.2% 7.6% 2023 Housing Units 1,375 9,454 17,383 Owner Occupied Housing Units 84.9% 58.1% 63.5% Renter Occupied Housing Units 6.0% 36.3% 29.1% Vacant Housing Units 9.0% 5.7% 7.4% 2028 Housing Units 1,428 9,904 18,181 Owner Occupied Housing Units 86.1% 58.8% 64.6% Renter Occupied Housing Units 6.0% 36.3% 28.8% Vacant Housing Units 8.0% 4.9% 6.6% Median Household Income 2023 $60,475 $72,811 $76,204 2028 $73,532 $80,078 $84,655 Median Home Value 2023 $497,115 $441,739 $486,553 2028 $571,383 $515,937 $560,905 Per Capita Income 2023 $31,418 $33,301 $35,774 2028 $36,976 $38,437 $41,797 Median Age 2010 52.4 34.7 36.6 2023 51.8 37.0 38.7 2028 51.4 37.3 38.9
Source: Esri forecasts for 2023 and 2028 U.S. Census Bureau 2000
2010 decennial Census
September 13, 2023 ©2023 Esri Page 1 of 7
data converted by Esri into 2020 geography.
Market Profile
Data Note: Income represents the preceding year, expressed in current dollars. Household income includes wage and salary earnings, interest dividends, net rents, pensions, SSI and welfare payments, child support, and alimony.
Source: Esri forecasts for 2023 and 2028 U.S. Census Bureau 2000 and 2010 decennial Census data converted by Esri into 2020 geography. September 13, 2023
4422 S Highway 97, Redmond, Oregon, 97756 Prepared by Esri Rings: 1, 3, 5 mile radii Latitude: 44.23435 Longitude: -121.20029 1 mile 3 miles 5 miles 2023 Households by Income Household Income Base 1,251 8,919 16,097 <$15,000 15.0% 7.2% 6.9% $15,000 - $24,999 9.3% 6.6% 5.7% $25,000 - $34,999 5.0% 4.7% 5.0% $35,000 - $49,999 12.9% 13.8% 13.5% $50,000 - $74,999 15.4% 18.8% 17.7% $75,000 - $99,999 11.3% 19.2% 18.5% $100,000 - $149,999 25.5% 21.4% 21.6% $150,000 - $199,999 3.5% 5.2% 6.6% $200,000+ 2.2% 3.1% 4.5% Average Household Income $76,019 $85,689 $92,503 2028 Households by Income Household Income Base 1,314 9,419 16,972 <$15,000 12.8% 6.2% 5.9% $15,000 - $24,999 5.6% 4.8% 4.1% $25,000 - $34,999 4.3% 3.8% 3.8% $35,000 - $49,999 11.7% 12.2% 11.2% $50,000 - $74,999 16.1% 17.6% 16.1% $75,000 - $99,999 11.0% 19.8% 18.9% $100,000 - $149,999 29.9% 24.2% 24.8% $150,000 - $199,999 5.5% 7.3% 9.3% $200,000+ 2.8% 4.1% 5.8% Average Household Income $89,294 $98,136 $107,317 2023 Owner Occupied Housing Units by Value Total 1,168 5,491 11,045 <$50,000 1.2% 2.7% 2.4% $50,000 - $99,999 0.2% 5.4% 2.9% $100,000 - $149,999 0.0% 1.9% 1.2% $150,000 - $199,999 0.5% 4.5% 2.9% $200,000 - $249,999 0.6% 4.3% 2.7% $250,000 - $299,999 1.1% 6.1% 4.5% $300,000 - $399,999 7.4% 15.5% 11.9% $400,000 - $499,999 40.1% 22.9% 24.7% $500,000 - $749,999 46.1% 32.2% 36.9% $750,000 - $999,999 2.3% 2.9% 6.3% $1,000,000 - $1,499,999 0.3% 0.7% 2.5% $1,500,000 - $1,999,999 0.1% 0.8% 0.9% $2,000,000 + 0.0% 0.1% 0.2% Average Home Value $526,457 $449,526 $516,057 2028 Owner Occupied Housing Units by Value Total 1,229 5,820 11,740 <$50,000 0.0% 0.1% 0.2% $50,000 - $99,999 0.0% 1.4% 0.7% $100,000 - $149,999 0.0% 0.0% 0.0% $150,000 - $199,999 0.0% 0.2% 0.1% $200,000 - $249,999 0.0% 0.4% 0.2% $250,000 - $299,999 0.0% 0.4% 0.2% $300,000 - $399,999 0.4% 16.6% 9.6% $400,000 - $499,999 31.2% 28.0% 27.4% $500,000 - $749,999 64.1% 43.9% 47.7% $750,000 - $999,999 3.2% 5.3% 7.9% $1,000,000 - $1,499,999 0.7% 1.4% 4.0% $1,500,000 - $1,999,999 0.2% 1.9% 1.8% $2,000,000 + 0.0% 0.1% 0.2% Average Home Value $584,426 $564,150 $611,864
©2023 Esri Page 2 of 7
Market Profile
4422 S Highway 97, Redmond, Oregon, 97756 Prepared by Esri Rings: 1, 3, 5 mile radii Latitude: 44.23435 Longitude: -121.20029 1 mile 3 miles 5 miles 2010 Population by Age Total 1,448 16,858 30,277 0 - 4 4.2% 7.8% 7.3% 5 - 9 3.9% 7.3% 7.3% 10 - 14 5.1% 7.1% 7.3% 15 - 24 8.6% 13.5% 12.4% 25 - 34 7.8% 14.6% 13.6% 35 - 44 11.1% 13.5% 13.5% 45 - 54 13.1% 12.3% 12.8% 55 - 64 16.7% 10.6% 11.7% 65 - 74 15.0% 6.6% 7.6% 75 - 84 9.4% 4.2% 4.4% 85 + 5.2% 2.4% 2.1% 18 + 83.5% 73.5% 73.8% 2023 Population by Age Total 2,860 23,062 41,596 0 - 4 4.2% 6.7% 6.4% 5 - 9 4.7% 6.8% 6.6% 10 - 14 4.8% 6.7% 6.6% 15 - 24 8.9% 12.6% 12.1% 25 - 34 10.2% 14.4% 13.2% 35 - 44 9.9% 13.2% 13.2% 45 - 54 11.4% 11.4% 11.9% 55 - 64 13.8% 11.0% 11.9% 65 - 74 16.2% 9.8% 10.7% 75 - 84 11.6% 5.4% 5.4% 85 + 4.2% 2.0% 1.8% 18 + 83.5% 76.0% 76.4% 2028 Population by Age Total 2,998 24,165 43,550 0 - 4 4.3% 6.9% 6.5% 5 - 9 4.6% 6.7% 6.5% 10 - 14 5.1% 6.9% 6.9% 15 - 24 8.5% 12.3% 11.6% 25 - 34 10.0% 14.0% 13.2% 35 - 44 10.6% 13.6% 13.3% 45 - 54 10.6% 11.2% 11.7% 55 - 64 12.7% 10.4% 11.1% 65 - 74 15.4% 9.7% 10.7% 75 - 84 12.9% 6.1% 6.3% 85 + 5.3% 2.2% 2.1% 18 + 82.8% 75.8% 76.3% 2010 Population by Sex Males 715 8,133 14,738 Females 734 8,727 15,540 2023 Population by Sex Males 1,404 11,223 20,392 Females 1,456 11,840 21,203 2028 Population by Sex Males 1,462 11,733 21,295 Females 1,534 12,431 22,254 Source: Esri forecasts for 2023 and 2028 U.S. Census Bureau 2000 and 2010 decennial Census data converted by Esri into 2020 geography. September 13, 2023 ©2023 Esri Page 3 of 7
Market Profile
Data Note: Persons of Hispanic Origin may be of any race The Diversity Index measures the probability that two people from the same area will be from different race/ ethnic groups
data converted by Esri into 2020 geography.
4422 S Highway 97, Redmond, Oregon, 97756 Prepared by Esri Rings: 1, 3, 5 mile radii Latitude: 44.23435 Longitude: -121.20029 1 mile 3 miles 5 miles 2010 Population by Race/Ethnicity Total 1,449 16,859 30,278 White Alone 94.3% 88.7% 90.1% Black Alone 0.1% 0.3% 0.4% American Indian Alone 1.2% 1.4% 1.2% Asian Alone 0.6% 0.6% 0.7% Pacific Islander Alone 0.1% 0.1% 0.2% Some Other Race Alone 1.8% 5.9% 4.7% Two or More Races 2.0% 3.0% 2.8% Hispanic Origin 4.8% 12.7% 11.0% Diversity Index 19.2 38.4 34.5 2020 Population by Race/Ethnicity Total 2,390 21,093 38,105 White Alone 87.4% 81.7% 82.6% Black Alone 0.3% 0.6% 0.5% American Indian Alone 0.8% 1.1% 1.1% Asian Alone 1.3% 1.2% 1.1% Pacific Islander Alone 0.1% 0.2% 0.2% Some Other Race Alone 2.4% 5.5% 5.1% Two or More Races 7.7% 9.7% 9.5% Hispanic Origin 7.6% 13.6% 12.6% Diversity Index 33.7 47.9 46.0 2023 Population by Race/Ethnicity Total 2,860 23,063 41,597 White Alone 87.0% 80.8% 81.7% Black Alone 0.3% 0.6% 0.5% American Indian Alone 0.8% 1.1% 1.1% Asian Alone 1.4% 1.3% 1.2% Pacific Islander Alone 0.1% 0.2% 0.2% Some Other Race Alone 2.4% 5.9% 5.5% Two or More Races 8.1% 10.2% 9.9% Hispanic Origin 8.0% 14.4% 13.5% Diversity Index 34.9 49.8 47.8 2028 Population by Race/Ethnicity Total 2,996 24,163 43,549 White Alone 86.0% 79.6% 80.5% Black Alone 0.3% 0.5% 0.5% American Indian Alone 0.8% 1.2% 1.1% Asian Alone 1.5% 1.4% 1.2% Pacific Islander Alone 0.1% 0.2% 0.2% Some Other Race Alone 2.6% 6.4% 5.9% Two or More Races 8.6% 10.8% 10.6% Hispanic Origin 8.5% 15.4% 14.4% Diversity Index 36.8 52.0 50.1 2010 Population by Relationship and Household Type Total 1,449 16,860 30,278 In Households 95.6% 98.4% 99.0% In Family Households 76.7% 81.9% 83.5% Householder 27.7% 25.8% 26.7% Spouse 24.1% 18.2% 19.8% Child 21.4% 31.1% 30.5% Other relative 1.5% 3.1% 3.0% Nonrelative 2.1% 3.7% 3.4% In Nonfamily Households 18.8% 16.5% 15.5% In Group Quarters 4.4% 1.6% 1.0% Institutionalized Population 3.0% 1.1% 0.6% Noninstitutionalized Population 1.4% 0.5% 0.4%
Source: Esri forecasts for 2023 and 2028 U.S. Census Bureau 2000
2010 decennial Census
September 13, 2023 ©2023 Esri Page 4 of 7
and
Market Profile
4422 S Highway 97, Redmond, Oregon, 97756 Prepared by Esri Rings: 1, 3, 5 mile radii Latitude: 44.23435 Longitude: -121.20029 1 mile 3 miles 5 miles 2023 Population 25+ by Educational Attainment Total 2,216 15,487 28,393 Less than 9th Grade 3.8% 4.1% 3.0% 9th - 12th Grade, No Diploma 5.8% 6.7% 5.4% High School Graduate 34.6% 23.7% 22.8% GED/Alternative Credential 0.6% 3.9% 3.7% Some College, No Degree 26.6% 23.1% 25.3% Associate Degree 8.6% 13.3% 11.7% Bachelor's Degree 17.1% 17.6% 19.9% Graduate/Professional Degree 2.9% 7.7% 8.2% 2023 Population 15+ by Marital Status Total 2,471 18,396 33,428 Never Married 16.0% 30.3% 26.9% Married 57.1% 49.6% 52.3% Widowed 14.1% 6.1% 5.8% Divorced 12.7% 13.9% 15.0% 2023 Civilian Population 16+ in Labor Force Civilian Population 16+ 1,140 12,242 21,233 Population 16+ Employed 91.9% 93.0% 94.3% Population 16+ Unemployment rate 8.1% 7.0% 5.7% Population 16-24 Employed 9.9% 12.7% 12.5% Population 16-24 Unemployment rate 10.3% 22.2% 20.3% Population 25-54 Employed 72.4% 67.9% 67.1% Population 25-54 Unemployment rate 0.8% 3.5% 2.6% Population 55-64 Employed 14.3% 14.2% 14.9% Population 55-64 Unemployment rate 33.0% 8.8% 6.4% Population 65+ Employed 3.4% 5.2% 5.5% Population 65+ Unemployment rate 0.0% 0.2% 0.5% 2023 Employed Population 16+ by Industry Total 1,048 11,391 20,027 Agriculture/Mining 0.4% 1.0% 1.4% Construction 15.8% 15.4% 13.0% Manufacturing 3.2% 6.2% 5.7% Wholesale Trade 1.9% 2.2% 1.8% Retail Trade 21.5% 15.1% 14.6% Transportation/Utilities 0.4% 4.8% 5.9% Information 0.0% 0.6% 0.9% Finance/Insurance/Real Estate 0.4% 1.9% 3.2% Services 53.6% 50.2% 50.6% Public Administration 2.7% 2.5% 2.9% 2023 Employed Population 16+ by Occupation Total 1,048 11,393 20,025 White Collar 49.6% 54.9% 57.9% Management/Business/Financial 17.9% 14.8% 16.2% Professional 19.1% 18.4% 19.5% Sales 8.5% 9.7% 10.0% Administrative Support 4.1% 12.0% 12.2% Services 28.3% 19.3% 18.4% Blue Collar 22.0% 25.8% 23.7% Farming/Forestry/Fishing 0.0% 0.2% 0.2% Construction/Extraction 4.3% 9.5% 7.7% Installation/Maintenance/Repair 1.4% 2.4% 2.7% Production 0.9% 3.5% 3.8% Transportation/Material Moving 15.5% 10.2% 9.3% Source: Esri forecasts for 2023 and 2028 U.S. Census Bureau 2000 and 2010 decennial Census data converted by Esri into 2020 geography. September 13, 2023 ©2023 Esri Page 5 of 7
Market Profile
Data Note: Households with children include any households with people under age 18, related or not. Multigenerational households are families with 3 or more parentchild relationships. Unmarried partner households are usually classified as nonfamily households unless there is another member of the household related to the householder. Multigenerational and unmarried partner households are reported only to the tract level. Esri estimated block group data, which is used to estimate polygons or non-standard geography.
U.S. Census Bureau 2000 and 2010 decennial Census data converted by Esri into 2020 geography.
13, 2023
4422 S Highway 97, Redmond, Oregon, 97756 Prepared by Esri Rings: 1, 3, 5 mile radii Latitude: 44.23435 Longitude: -121.20029 1 mile 3 miles 5 miles 2010 Households by Type Total 679 6,478 11,704 Households with 1 Person 31.4% 25.3% 23.5% Households with 2+ People 68.6% 74.7% 76.5% Family Households 63.5% 67.0% 69.2% Husband-wife Families 55.5% 47.4% 51.4% With Related Children 14.7% 21.4% 22.0% Other Family (No Spouse Present) 8.0% 19.7% 17.8% Other Family with Male Householder 2.4% 5.6% 5.2% With Related Children 1.3% 4.1% 3.8% Other Family with Female Householder 5.6% 14.0% 12.5% With Related Children 3.5% 10.6% 9.3% Nonfamily Households 5.2% 7.7% 7.3% All Households with Children 19.7% 36.8% 35.9% Multigenerational Households 1.9% 3.5% 3.3% Unmarried Partner Households 4.6% 9.0% 8.6% Male-female 4.3% 8.4% 8.0% Same-sex 0.3% 0.6% 0.6% 2010 Households by Size Total 678 6,477 11,702 1 Person Household 31.4% 25.3% 23.5% 2 Person Household 41.9% 34.6% 36.7% 3 Person Household 11.8% 16.3% 16.2% 4 Person Household 9.6% 13.2% 13.1% 5 Person Household 3.5% 6.6% 6.7% 6 Person Household 1.2% 2.6% 2.6% 7 + Person Household 0.6% 1.4% 1.2% 2010 Households by Tenure and Mortgage Status Total 678 6,477 11,704 Owner Occupied 74.5% 54.7% 60.3% Owned with a Mortgage/Loan 49.1% 42.0% 46.1% Owned Free and Clear 25.4% 12.7% 14.2% Renter Occupied 25.5% 45.3% 39.7% 2023 Affordability, Mortgage and Wealth Housing Affordability Index 50 68 64 Percent of Income for Mortgage 49.4% 36.5% 38.4% Wealth Index 64 61 76 2010 Housing Units By Urban/ Rural Status Total Housing Units 745 7,138 13,427 Housing Units Inside Urbanized Area 0.0% 0.0% 0.0% Housing Units Inside Urbanized Cluster 88.6% 91.6% 78.9% Rural Housing Units 11.4% 8.4% 21.1% 2010 Population By Urban/ Rural Status Total Population 1,449 16,860 30,278 Population Inside Urbanized Area 0.0% 0.0% 0.0% Population Inside Urbanized Cluster 90.8% 92.2% 83.6% Rural Population 9.1% 7.8% 16.4%
Source:
2023 and
September
©2023 Esri Page 6 of 7
Esri forecasts for
2028
Market Profile
Data Note: Consumer spending shows the amount spent on a variety of goods and services by households that reside in the area Expenditures are shown by broad budget categories that are not mutually exclusive. Consumer spending does not equal business revenue. Total and Average Amount Spent Per Household represent annual figures The Spending Potential Index represents the amount spent in the area relative to a national average of 100 Source: Consumer Spending data are derived from the 2019 and 2020 Consumer Expenditure Surveys, Bureau of Labor Statistics. Esri.
Bureau 2000 and 2010 decennial Census data converted by Esri into 2020 geography.
4422 S Highway 97, Redmond, Oregon, 97756 Prepared by Esri Rings: 1, 3, 5 mile radii Latitude: 44.23435 Longitude: -121.20029 1 mile 3 miles 5 miles Top 3 Tapestry Segments 1. Midlife Constants (5E) Urban Edge Families (7C) Middleburg (4C) 2. Front Porches (8E) Front Porches (8E) Urban Edge Families (7C) 3. Middleburg (4C) Midlife Constants (5E) Front Porches (8E) 2023 Consumer Spending Apparel & Services: Total $ $1,900,166 $15,782,016 $30,287,528 Average Spent $1,518.92 $1,769.48 $1,881.56 Spending Potential Index 69 80 86 Education: Total $ $1,484,093 $12,286,954 $23,271,860 Average Spent $1,186.33 $1,377.62 $1,445.73 Spending Potential Index 66 77 81 Entertainment/Recreation: Total $ $3,461,133 $26,942,174 $52,845,191 Average Spent $2,766.69 $3,020.76 $3,282.92 Spending Potential Index 73 80 87 Food at Home: Total $ $6,099,821 $49,137,185 $94,728,800 Average Spent $4,875.96 $5,509.27 $5,884.87 Spending Potential Index 72 81 87 Food Away from Home: Total $ $3,204,710 $26,928,868 $52,012,641 Average Spent $2,561.72 $3,019.27 $3,231.20 Spending Potential Index 69 81 87 Health Care: Total $ $7,156,376 $52,959,724 $104,863,023 Average Spent $5,720.52 $5,937.85 $6,514.45 Spending Potential Index 78 81 89 HH Furnishings & Equipment: Total $ $2,646,629 $21,181,593 $41,432,216 Average Spent $2,115.61 $2,374.88 $2,573.91 Spending Potential Index 72 80 87 Personal Care Products & Services: Total $ $843,536 $6,916,237 $13,400,103 Average Spent $674.29 $775.45 $832.46 Spending Potential Index 71 81 87 Shelter: Total $ $21,443,190 $179,615,477 $345,078,006 Average Spent $17,140.84 $20,138.52 $21,437.41 Spending Potential Index 69 81 87 Support Payments/Cash Contributions/Gifts in Kind: Total $ $2,984,100 $22,348,498 $44,702,192 Average Spent $2,385.37 $2,505.72 $2,777.05 Spending Potential Index 76 80 89 Travel: Total $ $1,985,042 $16,042,315 $31,547,326 Average Spent $1,586.76 $1,798.67 $1,959.83 Spending Potential Index 71 80 87 Vehicle Maintenance & Repairs: Total $ $1,190,237 $9,631,200 $18,781,981 Average Spent $951.43 $1,079.85 $1,166.80 Spending Potential Index 73 82 89
2028 U.S.
September 13, 2023 ©2023 Esri Page 7 of 7
Source: Esri forecasts for 2023 and
Census
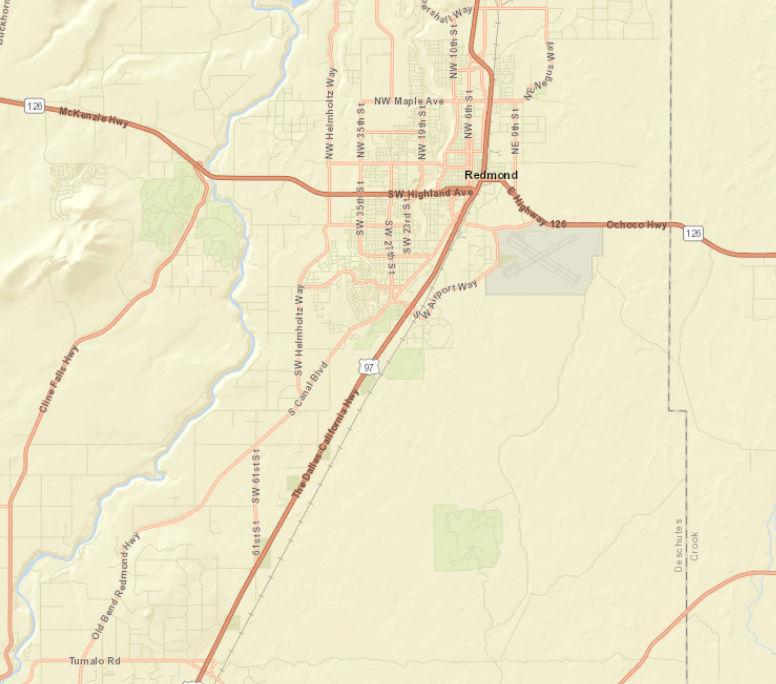
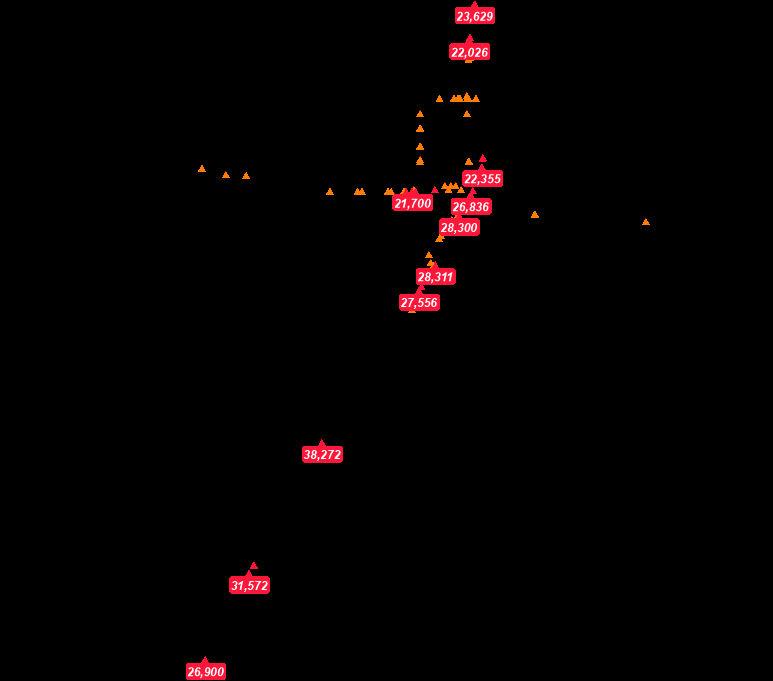
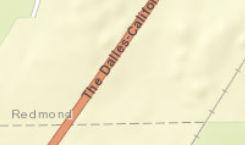
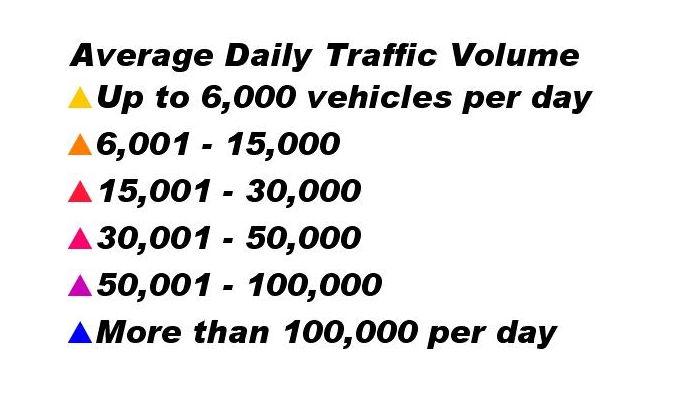
Bureau of Land Management, State of Oregon GEO, State of Oregon, Esri, HERE, Garmin, INCREMENT P, NGA, USGS, U.S. Forest Service 0 0.8 1.6 mi Traffic Count Map 4422 S Highway 97, Redmond, Oregon, 97756 Prepared by Esri Rings: 1, 3, 5 mile radii Latitude: 44.23435 Longitude: -121.20029 Source: ©2023 Kalibrate Technologies (Q2 2023). September 13, 2023 ©2023 Esri Page 1 of 1
Payment made to the City in-lieu of supplying the required off-street parking spaces for a project in the Downtown Overlay District may be provided as follows:
1. By the one-time payment of a non-refundable parking and mobility improvement fee to the City in the amount established in the City’s Fee Schedule, paid prior to the issuance of Certificate of Occupancy. Fees collected shall be used to fund parking, street improvements or facilities to improve mobility or enhance pedestrian connectivity and safety in the Downtown Overlay District.
2. From time to time the City shall establish the value of off-street parking facilities on a per parking space basis, used to establish the above parking and mobility improvement fee.
3. The City Engineering shall evaluate development proposals requesting to pay an in-lieu fee through conducting a Transportation System Analysis or parking study.
4. Any such request for parking in-lieu may be denied or reduced by the Community Development Director, or designee. The Director, or designee, shall determine:
a. Whether there is sufficient alternative parking within a two to fourblock radius of the project location.
b. Whether approval of the request would have an adverse effect on surrounding neighborhoods.
c. Whether the request meets the Purpose and Intent of the Downtown Overlay District Zone.
d. Compliance with the Redmond Comprehensive Plan 2040 and support plans, as amended.
[Section 8.0175 amended by Ord. #2016-17 passed January 31, 2017]
[Section 8.0175 amended by Ord. #2022-04 passed June 28, 2022]
[Section 8.0175 amended by Ord. #2022-09 passed December 13, 2022]
8.0180 Light Industrial (M-1) Zone.
8.0182 General Industrial (M-1.5) Zone.
8.0185 Heavy Industrial (M-2) Zone.
8.0186 Large Lot Industrial (LLI) Zone.
1. LLI Zone Regulations. The following standards and regulations apply in the LLI Zone:
A. The lot shall adhere to the designation as acknowledged by the Central Oregon Intergovernmental Council
B. No property that is zoned LLI can be rezoned to another zone within ten years of the LLI designation.
C. The minimum lot size is 50 acres. Division or separation of lots or parcels within the site to new lots or parcels less than the minimum lot size is not allowed until the site is developed with a primary traded sector use requiring a large lot.
D. Allowed uses are traded sector uses as provided in Section 2.
E. Uses allowed to support a primary user included:
1. Subordinate industrial uses that rely upon and support the primary traded sector use;
2. Service commercial uses that support the traded sector uses if they are limited to 7500 square feet per use; and
CHAPTER 8 DEVELOPMENT REGULATIONS 67
3. Retail uses accessory to a traded sector use and limited to 7500 square feet
F. Conceptual Phased Site Development Plan. A Conceptual Phased Site Development Plan is required for each primary traded-sector use as part of the Site and Design Review process in addition to the criteria and requirements outlined in Article IV of this code. In addition to the requirements outlined in Section 8.3025, the following elements shall be considered as part of the Conceptual Phased Site Development Plan:
1. Open Space. Generally identify land provided for open space on the site.
2. Connectivity and Trail Networks. A conceptual transportation plan for streets, pedestrians connectivity and trail networks. E.g., Connection of bicycle routes and pedestrian network for utility and recreational purposes.
3. Site Design. Describe how the design elements (i.e., streets, open spaces, signage, and architecture) are integrated and coordinated throughout the site.
4. Analysis of Anticipated Utility Consumption by Phase. Analysis of the anticipated utility consumption by phase for wastewater, water, power, natural gas, and other utility infrastructure necessary to support the development.
2. LLI Zone Uses Permitted. The following uses are allowed outright or conditionally in the Large Lot Industrial Zone:
Land Use: Zone: RESTRICTIONS AND REQUIREMENTS:
Traded-Sector Usage
O Per ORS 285B.280, traded sector means industries in which member firms sell their goods or services into markets for which national or international competition exists, as well as uses and services that directly benefit traded sector uses. Allowed uses include manufacturing, processing plants, distribution center, warehousing, research and development, and higher education institutions
Subordinate Industrial Uses
Service Commercial Uses
Retail Uses
O After a primary traded-sector use has been sited, subordinate industrial uses are allowed. Subordinate means industries that rely upon and support a primary traded sector use
C After a primary traded-sector use has been sited, service commercial uses are allowed that support the traded sector uses and shall be limited to 7500 square feet per structure
C After a primary traded-sector use has been sited, retail uses, and eating and drinking establishments are allowed as a conditional use and shall be limited to 7500 square feet per use in the structure.
O = Outright uses, C = Conditional Uses
3. Minimum Standards. See Table D, 8.0195.
[Section 8.0186 added by Ord. #2015-11 passed September 22, 2015]
[Section 8.0186 amended by Ord. #2022-09 passed December 13, 2022]
CHAPTER 8 DEVELOPMENT REGULATIONS 68
8.0190 Table C, Uses Permitted. The following uses identified below are allowed outright or conditionally in each of the Commercial and Industrial zones. Outright or conditional uses in the M-1.5 zone may be permitted Conditionally in the M-1 or M-2 zones; this allowance does not apply for uses Not Allowed (“N”).
69
CHAPTER 8 DEVELOPMENT REGULATIONS
“O” means Permitted Outright “C” means Permitted Conditionally “N” means Not Allowed Commercial/Industrial: C-1 C-2 C-3 C-4 C-4A C-5 M-1 M-1.5 M-2 DOD Restrictions and Requirements: Apartments N N N N N N N N N N See Multi-Family complexes. Assisted Living Facility O O O O O O N N N C Bed and Breakfast C C C C N N N N N C Boarding House O O O O C C N N N O Caretaker C N N C N C C C O N Must live on site. Condominium N N N O N N N N N O State regulated. Dairy N N N N N N N N N O Homeless Shelter O C C C N N O C N N Manufactured Home Park C N N C N N N N N N Multi-Family Complex O O O O O O N N N O* *Residential Use on ground floor restricted to <25% and shall not be in front of building. Planned Unit Development C C C C C C C C C C Residential Use above ground floor O O O O N N N N N O Residential Use on ground floor <25% N O O O N N N N N O Not in front of building. Residential Use on ground floor >25% N N N N N N N N N N Residential care facility O C O C N N N N N C Residential care home O O O O N N N N N O Single Family Detached Dwelling (including ADUs) and Duplexes on ground floor C O* C N N N N N N O* *Only permitted for those uses pre-dating the adoption of the C-2 Zone Amendments and Downtown Overlay District on August 12, 2008. Attached Single Family and triplex and quadplex above ground floor O O O O O O N N N O Resumption of a residential use O O O O O O N N N C Only as previously established. Eating and Drinking: C-1 C-2 C-3 C-4 C-4A C-5 M-1 M-1.5 M-2 DOD Restrictions and Requirements: Bakery (retail/sit-down) O O O O O* O O O O O Bar, Lounge, Tavern, Nightclub O O C O O* O O O O O Café, Restaurant (sitdown), Diner, Brew Pub O O O O O* O O O O O Deli's are listed under "retail uses." Café, Restaurant, Espresso (drivethrough) O O O O O* O O O O O Deli's are listed under "retail uses." Entertainment: C-1 C-2 C-3 C-4 C-4A C-5 M-1 M-1.5 M-2 DOD Restrictions and Requirements:
70 Amusement Park C N N N O O N N N N Arena for Indoor Sports Events O C N C O O N N N C Larger than indoor commercial recreational use. Driving Range O N N N N O N N N N Golf Course N N N N N O N N N N Indoor Commercial Recreation O O O O O O C C C O Miniature Golf, "Pitch & Putt" O N N N N O N N N N Outdoor Commercial Recreation C C N C O C N N N C Walk-in Movie Theater O O O O O O N N N O Automobile, Trucks, RV's: C-1 C-2 C-3 C-4 C-4A C-5 M-1 M-1.5 M-2 DOD Restrictions and Requirements: Auto Detailing O C N O O* N O O N C** No auto body work permitted as "detailing". **Grandfathered as a Conditional Use for existing businesses prior to August 12, 2008. Auto Painting, Auto Body Work O N N N O* N O O O N Auto Repair O C N C O* N O O O C** Defined in part by some onsite auto storage. **Grandfathered as a Conditional Use for existing businesses prior to August 12, 2008. Auto Sales (new and used); Auto Rentals C C N O N N N N N C** **Grandfathered as a Conditional Use for existing businesses prior to August 12, 2008. Auto Service O C N O O* N N N O C** Includes auto lube shops ('same day' service). **Grandfathered as a Conditional Use for existing businesses prior to August 12, 2008. Recreational Vehicle or Boat Sales and Service C N N C C N C C N N Includes motorcycles, ATVs, other recreational vehicles. Car Wash O O O O O O O O O C** Steam cleaning permitted in the industrial zones. **Grandfathered as a Conditional Use for existing businesses prior to August 12, 2008. Gas Stations Including Card Lock O O N O O O O O O C** **Grandfathered as a Conditional Use for existing businesses prior to August 12, 2008. Tire Sales and Service O O N O O N N N N N Truck Stop O N N N O N O O O N Truck Terminal N N N N N N O O O N Automobile and Recreational Vehicle Storage/ Towing Yard N N N N N N C C C N Includes impound yards, auto fleets. Industrially Related Uses: C-1 C-2 C-3 C-4 C-4A C-5 M-1 M-1.5 M-2 DOD Restrictions and Requirements: Aircraft/Airport Service, Parking Lot, Maintenance N N N N N N O N O N
CHAPTER 8 DEVELOPMENT REGULATIONS
CHAPTER 8 DEVELOPMENT REGULATIONS
71 Auto Wrecking, Recycling N N N N N N C C O N Bakery, Wholesale Distribution C N N N N N O O O N Batch Plants (Asphalt/Concrete) N N N N N N N C O N Commercial Manufacturing (Retail Support, Craftsmen) O O O O O O O O O O Must be fully enclosed in "C" zones that permit this use. Concrete & Concrete Products, Stone-cutting N N N N N N C C O N Distribution Center N N N N O N O O O N Dump, Landfill N N N N N N N N C N Enclosed Warehousing and Manufacturing N N N N N N O O O N Up to 50% retail allowed in Industrial Zones. Junkyard N N N N N N N N O N Auto Wrecking Yard' is a separate category Landscaping Supply (Bulk) N N N N N N O O O N Outdoor storage of bulk landscaping material. Lumber Mill N N N N N N N C O N Manufacturing (Heavy Industrial) N N N N N N N C O N Manufacturing (Light Industrial) N N N N N N O O O N Subject to DEQ requirements and neighborhood compatibility. Medical Research Facility O O O O O O O O O O Excludes research using biohazardous material. Precision Machine Shop C N N C N N O O O N Must be fully enclosed in "C" zones that permit this use. Retail Uses in support of primary Industrial Use N N N N N N O O O N Must be less than 50% of the gross floor area. Rock Crushing/Recycling N N N N N N C C O N Slaughterhouse N N N N N N N N O N Tanning, Curing, Storing of Hides N N N N N N N C O N Wholesale Printing and Distribution N N N N N N O O O N Wood Product Manufacturing and Assembly N N N N N N O O O N Offices and Office Products: C-1 C-2 C-3 C-4 C-4A C-5 M-1 M-1.5 M-2 DOD Restrictions and Requirements: Office O O O O O O C C N O Office Service and Supplies O O O O O* O N C N O Offices related to Industrial Use N N N N N N O O O N Printing, Publishing O O O O O O O O N O Telemarketing, Call Center O O O O O O C C N N Public and Semi Public Uses: C-1 C-2 C-3 C-4 C-4A C-5 M-1 M-1.5 M-2 DOD Restrictions and Requirements: Agricultural Uses N N N N N N N N N N Churches, Religious Institutions C C C C C C C C N C Convention Center O O N O N O N N N O Hospital N N O N N N N N N N
CHAPTER 8 DEVELOPMENT REGULATIONS
72 Lodge, Club, Non-profit/frat. Org C C C C C C C C N C Park, Public or Private O O O O O O O O O O Parking Garage, Public or Private O O O O O O O O O O Public Transportation Station O O O O O O O O O O RV Park, Public or Private C N N C N C C C N N Refer to 8.0615(14) Police or Fire Station: Public Safety or Emergency Services O O O O O O O C C C Schools, Public or Private C C C C C C C C N C City Owned Utility or Public Facility O O O O O O O O O O Retail Uses: C-1 C-2 C-3 C-4 C-4A C-5 M-1 M-1.5 M-2 DOD Restrictions and Requirements: Bicycle Sales and Service O O N O O* O N O N O Bulky Retail (including furniture) O O N O O O N O N O Excludes equipment and heavy equipment. Contractor Supplies (enclosed) O O N O O N O O O O Also called Building Supplies (nonlandscaping). Contractor Supplies (outdoors) O C N C O N N O N C Delicatessen O O O O O* O C C N O Drug Store, Pharmacy O O O O O* O N O N O Equipment Sales, Service & Rental O O N O O N N O N C Excludes Heavy Equipment Sales and Service. Florist O O O O O* O N O N O Gallery, Studio O O N O O O N O N O General Retail O O N O O* O N N N O Gift/Card Shop O O O O O* O N N N O Grocery Store, Market O O N O O** O N N N O Hardware Store O O N O O* O N C N O Heavy Equipment Sales O N N N N N O C O N Only permitted w/ primary service use in M Zone. Heavy Equipment Service O N N N N N O C O N Heavy Equipment Storage (outdoor) N N N N N N N C O N Medical Supplies (Retail) O O O O O N N C N O Mobile/Manufactured Home Sales & Service O N N C N N N N N N Novelty, Specialty, Variety Store O O C O O* O N N N O Includes music, art supply, electronic equipment, sporting goods. Outdoor Merchandise Display, Other O C N O O N N C N C Non storage related; for retail sales. Pet Shop O O N O O O N N N O Plant Nursery O N N O O O N C N N Thrift Store-1 O O O O N O N N N O Service Commercial Uses: C-1 C-2 C-3 C-4 C-4A C-5 M-1 M-1.5 M-2 DOD Restrictions and Requirements:
CHAPTER 8 DEVELOPMENT REGULATIONS
[Section 8.0190 amended by Ord. #2012-10 passed August 14, 2012]
[Section 8.0190 amended by Ord. #2015-04 passed May 19, 2015]
[Section 8.0190 amended by Ord. #2016-17 passed January 31, 2017]
[Section 8.0190 amended by Ord. #2017-12 passed December 12, 2017]
[Section 8.0190 amended by Ord. #2018-09 passed September 11, 2018]
[Section 8.0190 amended by Ord. #2020-15 passed November 10, 2020]
[Section 8.0190 amended by Ord. #2022-04 passed June 28, 2022]
[Section 8.0190 amended by Ord. #2022-09 passed December 13, 2022]
73 Appliance and Computer Repair O O N O O* N N N N O Includes stereos, electronic equipment, residential appliances. Bank, Financial Institution O O N O O C N N N O Beauty & Barber Shops & Salons (Including spas) O O O O O* O N N N O Contractor Service O N N O O N O O O N Enclosed within a building (except in M-2 zone); includes equipment rentals and sales. Contractor's Yard C N N N N N C O O N Includes outdoor storage of equipment and building supplies. Child Care Facility O O O O O O C C N O If a facility is part of an industrial development and within the manufacturing structure, a conditional use permit is not required. Dry Cleaner (drop-off only) O O N O O* O N C N O Dry Cleaner (full service) O C N C O* N N C N C Kennel C N N C N N O C O N Laundromat O O N O O O N C N O Mini Storage C N N C N N C C N N See Section 8.0615(17). Mortuary, Funeral Home O O O N N O N C N O Motel, Hotel O O C O O O C N N O Printing and Copying Store O O N O O* O N C N O Veterinarian Services O O O O O O O C O C Fully enclosed in C zones; no outdoor kennels.
O* Maximum size = 10,000 square feet O** Maximum size = 20,000 square feet
CHAPTER 8 DEVELOPMENT REGULATIONS
8.0195 Table D, Minimum Standards. The following minimum standards are required in each of the Commercial and Industrial zones as follows (all distances are measured in feet):
* The minimum lot size shall be determined based on demonstration of the ability to develop the site in accordance with the zone standards, offstreet parking standards, Site & Design Review Standards, landscaping requirements and other applicable Development Code provisions without adverse impact to water and land resource quality and adjoining properties.
* Residential uses permitted in Commercial zones shall be subject to the density standards for the R-5 zone, except for the C-2, C-3 zone and Downtown Overlay District, for which there is no maximum density standard.
A A rear yard abutting an alley shall be 25 feet from the property line to foundation when the alley is used to service the commercial establishment and 10 feet in other cases.
B Maximum building height is limited to 45 feet for all structures within one full city block of a residential zone. Where allowed buildings over 45 feet shall conform the Upper Floor Setback Standards in the Downtown Overlay Zone Site and Design Standards in Section 8.0175(5).
C Rear yards along the north side of Highland Avenue/Highway 126 between SW 23rd and SW 27th Streets shall have a minimum arterial setback of 25 feet. All other rear setbacks adjacent to arterials shall be 50 feet.
D The minimum setback between a structure and an existing use in the C-5 zone shall be 5 feet from the property line and 10 feet from any adjacent structure on the subject site or adjacent property.
74
C-1 C-2 C-3 C-4 C-4A C-5 M-1 & M-1.5 M-2 LLI DOD Minimum Yard Setbacks Front Local Street 10 H 5 10 10 10 10 10 10 10 H 2 Collector 25 25 25 25 25 25 25 25 Arterial 50 50 50 50 50 50 50 50 Interior Side Standard D 5 F 10-15 F 1015 10-15 Adjacent to R-Zone 25 25 25 25 Street Side Local Street 10 10 10 10 50 10 10 10 Collector 25 25 25 25 50 25 25 25 Arterial 50 25 50 50 50 50 50 50 Rear Interior D 5 10 10 10 Local Street 10 10 10 10 50 10 10 10 Collector 25 25 25 25 50 25 25 25 Arterial 50 25 C 25/50 25 50 50 50 50 Adjacent to R-Zone 25 25 25 25 50 Adjacent to alley A 10/25 A 10/25 A 10/25 A 10/25 Maximum Front Yard Setback I 15 I 10 Maximum Building Height 60 B 50/60 60 60 60 60 60 60 60 G 50/60/75 Minimum Street Frontage Standard Street 50 50 50 50 50 50 50 50 50 Cul-de-sac 30 30 30 30 30 30 30 30 30 Minimum Landscaping 15% J 15% 15% 15% 15% 15% 15% 15% 15% 0% Minimum Lot Size* 200 acres for 1st Lot. 50 acres
CHAPTER 8 DEVELOPMENT REGULATIONS
E No use located in an industrial zone adjacent to or across the street from a residential zone shall exceed 60% of the lot area including buildings, storage or facilities, and off-street parking and loading. Most of the landscaping required on industrial lots that abut residential zones is permitted in between the industrial use / residential uses.
F The minimum side yard in an industrial zone shall be 10 feet for 1 and 2 story buildings and 15 feet for 3 story buildings.
G Maximum building height is limited to 50 feet for all structures within one full city block of a residential zone. Where allowed, buildings over 50 feet shall conform the Downtown Overlay District Site and Design Standards in Section 8.0175(5). The maximum building height for structures west of SW 5th Street is 60 feet. The maximum building height for structures east of 5th Street is 75 feet and may be increased above 75 feet if a Conditional Use Permit for the structure is approved by a Hearings and Review Authority.
H Existing zero-lot line structures as of August 12, 2008, shall be exempt from this standard. At the time the front façade of a building or a building is demolished as defined by this Code, then the building shall comply with this standard unless a variance is approved.
I Full block developments require a minimum of 50 percent of the building façade to be developed to the minimum setback Asphalt is prohibited in the front yard setback (concrete, pavers, landscaping are allowed).
J May be met through walkways, play areas, plazas, pocket parks, and picnic areas.
[Section 8.0195 amended by Ord. #2012-10 passed August 14, 2012]
[Section 8.0195 amended by Ord. #2014-12 passed May 27, 2014]
[Section 8.0195 amended by Ord. #2015-11 passed September 22, 2015]
[Section 8.0195 amended by Ord. #2018-09 passed September 11, 2018]
[Section 8.0195 amended by Ord. #2020-15 passed November 10, 2020]
[Section 8.0195 amended by Ord. #2022-04 passed June 28, 2022]
75
