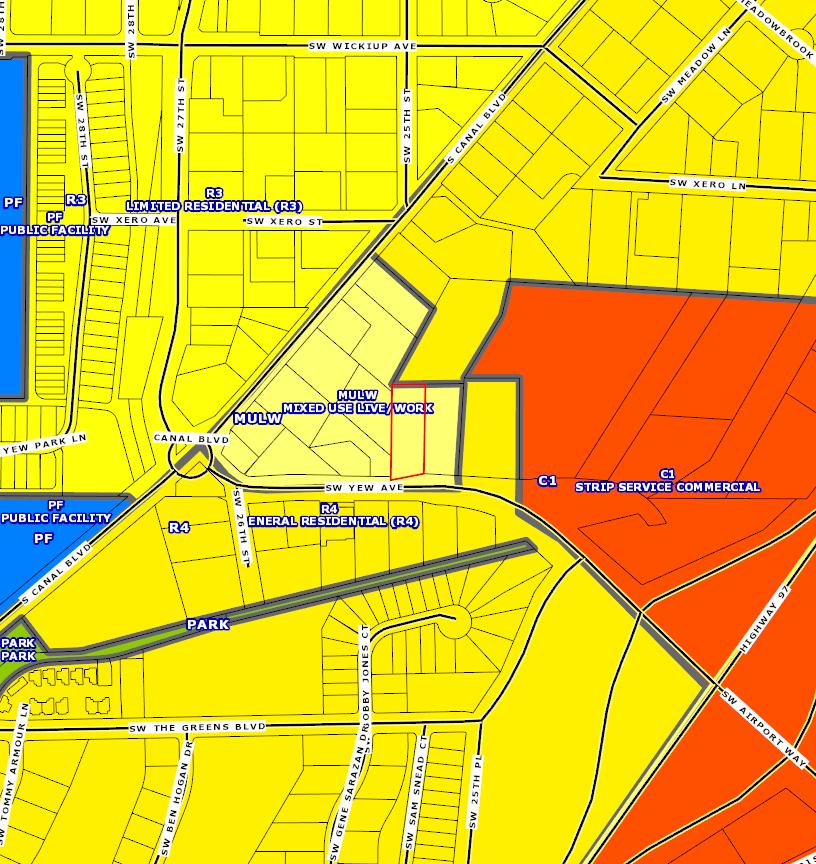
REDMOND CODE
CHAPTER 8
DEVELOPMENT REGULATIONS
The contents of Chapter Development Regulations can be found here:
https://www.redmondoregon.gov/home/showpublisheddocument/3426/638091
082331730000
Deschutes County Code
https://deschutescounty.municipalcodeonline.com/book?type=ordinances#name
=TITLE_18_COUNTY_ZONING
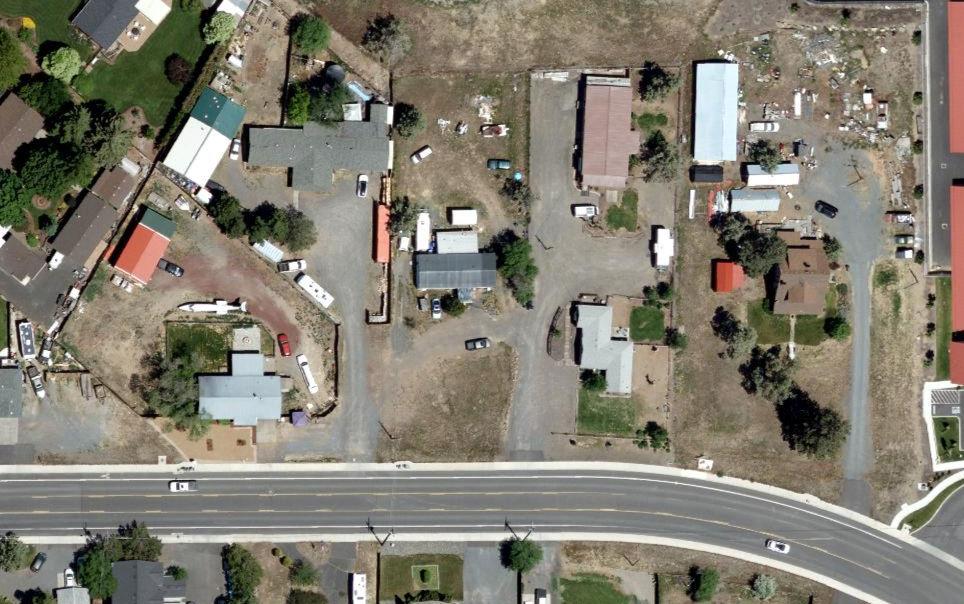
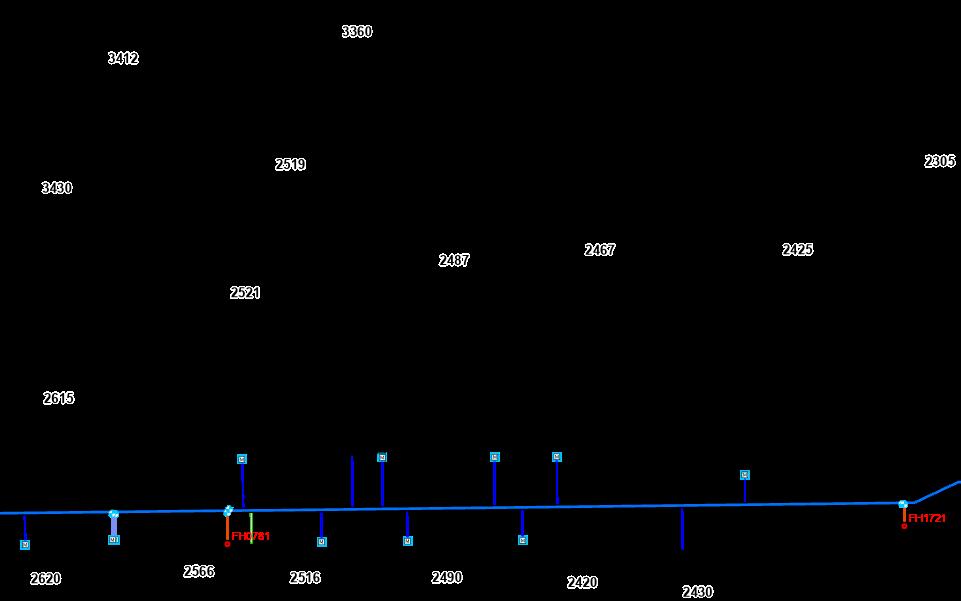
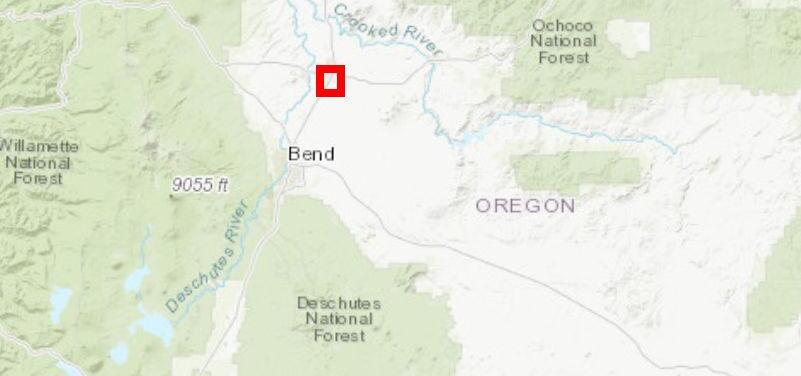
Water Distribution Map - 2487 SW Yew Ave Sources: Esri, Airbus DS, USGS, NGA, NASA, CGIAR, N Robinson, NCEAS, NLS, OS, NMA, Geodatastyrelsen, Rijkswaterstaat, GSA, Geoland, FEMA, WATER LATERAL Commercial Domestic HydrantLaterals System GRAVITY MAIN SYSTEM VALVE METER HYDRANT REDMOND TAXLOTS 3/7/2024, 12:03:33 PM 0 0.01 0.02 0.01 mi 0 0.02 0.04 0.01 km 1:1,128 Web AppBuilder for ArcGIS Esri Community Maps Contributors, Oregon State Parks, State of Oregon GEO, © OpenStreetMap, Microsoft, Esri, TomTom, Garmin, SafeGraph, GeoTechnologies, Inc, METI/NASA, USGS, Bureau of Land Management, EPA, NPS, US Census Bureau, USDA,

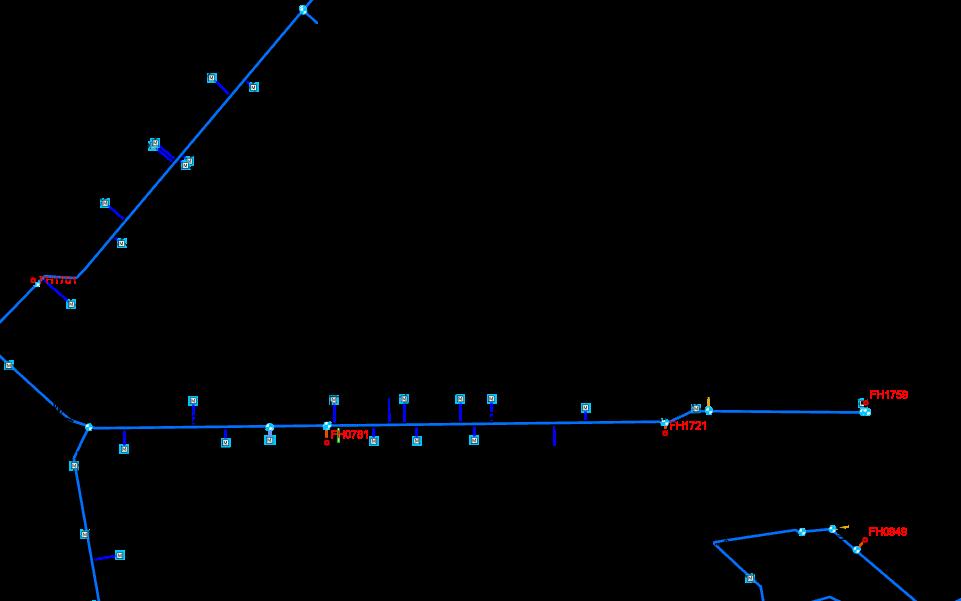
Comfort SW Water Distribution Map No Aerial - 2487 SW Yew Ave Sources: Esri, Airbus DS, USGS, NGA, NASA, CGIAR, N Robinson, NCEAS, NLS, OS, NMA, Geodatastyrelsen, Rijkswaterstaat, GSA, Geoland, FEMA, WATER LATERAL Commercial Domestic Fire HydrantLaterals Irrigation System GRAVITY MAIN SYSTEM VALVE METER HYDRANT REDMOND TAXLOTS 3/7/2024, 12:04:48 PM 0 0.03 0.05 0.01 mi 0 0.04 0.08 0.02 km 1:2,257 Web AppBuilder for ArcGIS Esri Community Maps Contributors, Oregon State Parks, State of Oregon GEO, © OpenStreetMap, Microsoft, Esri, TomTom, Garmin, SafeGraph, GeoTechnologies, Inc, METI/NASA, USGS, Bureau of Land Management, EPA, NPS, US Census Bureau, USDA,
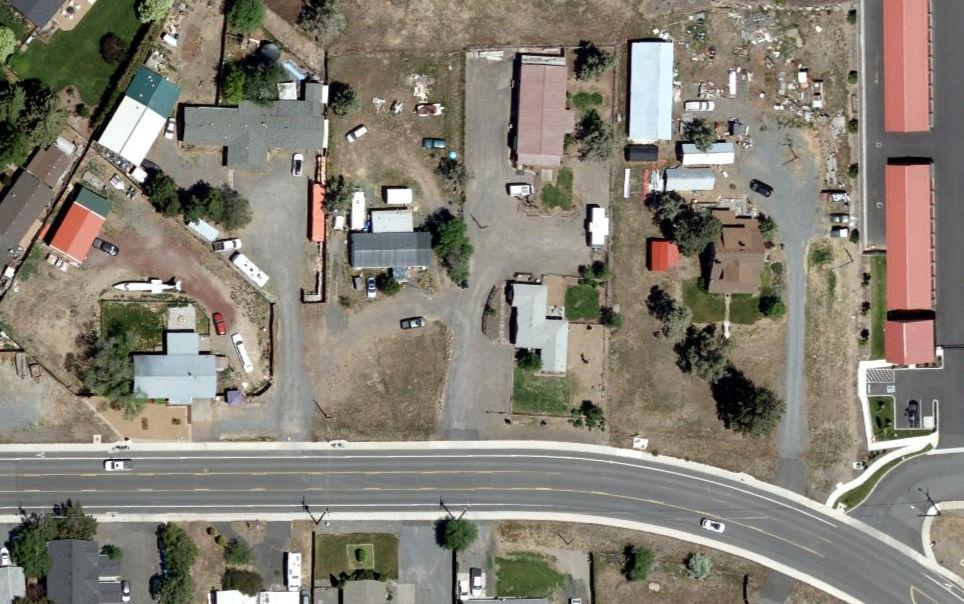
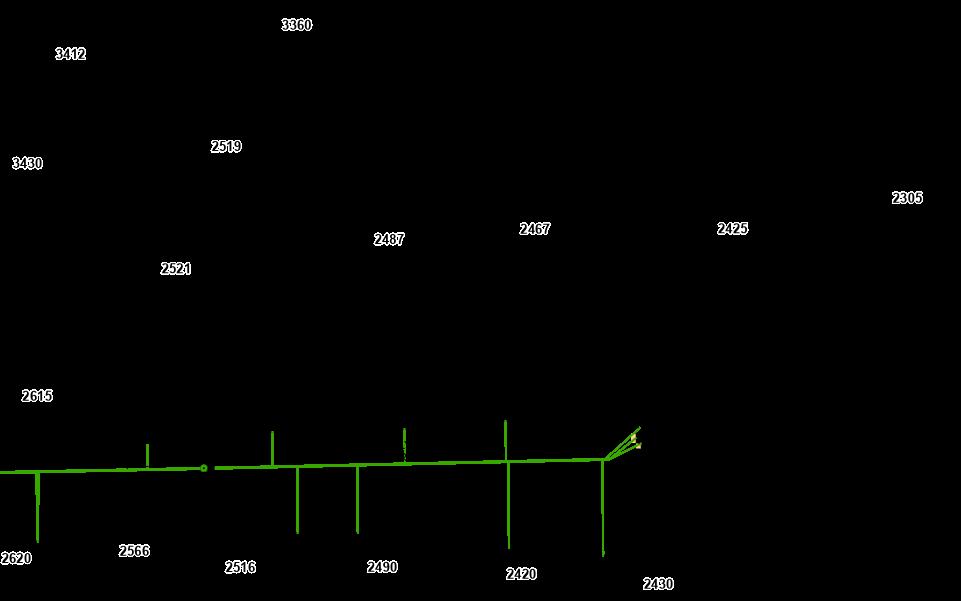
Yew Ave Waste Water Collection - 2487 SW Yew Ave Sources: Esri, Airbus DS, USGS, NGA, NASA, CGIAR, N Robinson, NCEAS, NLS, OS, NMA, Geodatastyrelsen, Rijkswaterstaat, GSA, Geoland, FEMA, COLLECTION MAIN SAMPLING MANHOLES SERVICE LATERAL MANHOLE REDMOND TAXLOTS 3/7/2024, 12:32:59 PM 0 0.01 0.02 0.01 mi 0 0.02 0.04 0.01 km 1:1,128 Web AppBuilder for ArcGIS Esri Community Maps Contributors, Oregon State Parks, State of Oregon GEO, © OpenStreetMap, Microsoft, Esri, TomTom, Garmin, SafeGraph, GeoTechnologies, Inc, METI/NASA, USGS, Bureau of Land Management, EPA, NPS, US Census Bureau, USDA,

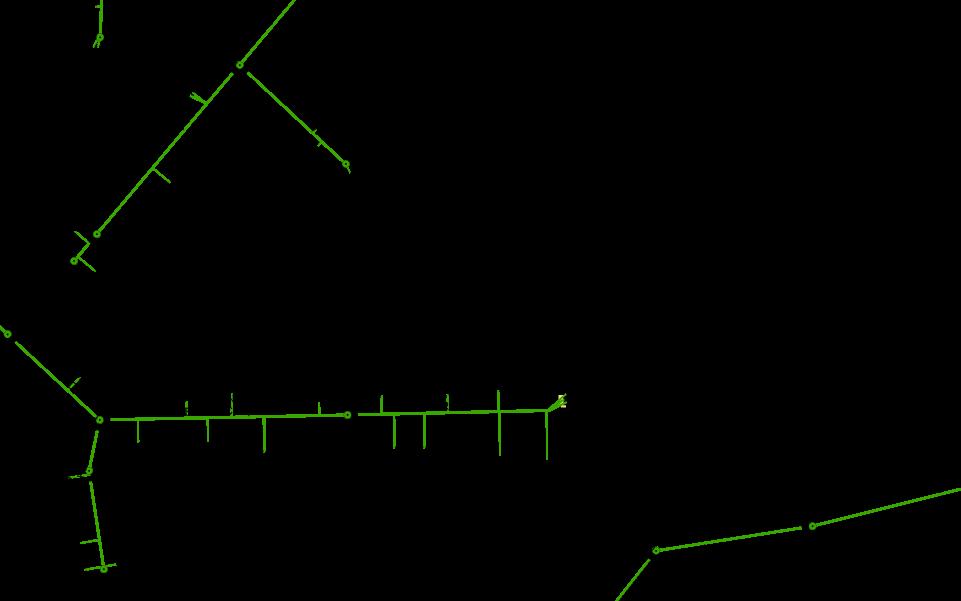
Comfort SW Waste Water Collection No Aerial - 2487 SW Yew Ave Sources: Esri, Airbus DS, USGS, NGA, NASA, CGIAR, N Robinson, NCEAS, NLS, OS, NMA, Geodatastyrelsen, Rijkswaterstaat, GSA, Geoland, FEMA, COLLECTION MAIN SAMPLING MANHOLES SERVICE LATERAL MANHOLE REDMOND TAXLOTS 3/7/2024, 12:32:07 PM 0 0.03 0.05 0.01 mi 0 0.04 0.08 0.02 km 1:2,257 Web AppBuilder for ArcGIS Esri Community Maps Contributors, Oregon State Parks, State of Oregon GEO, © OpenStreetMap, Microsoft, Esri, TomTom, Garmin, SafeGraph, GeoTechnologies, Inc, METI/NASA, USGS, Bureau of Land Management, EPA, NPS, US Census Bureau, USDA,

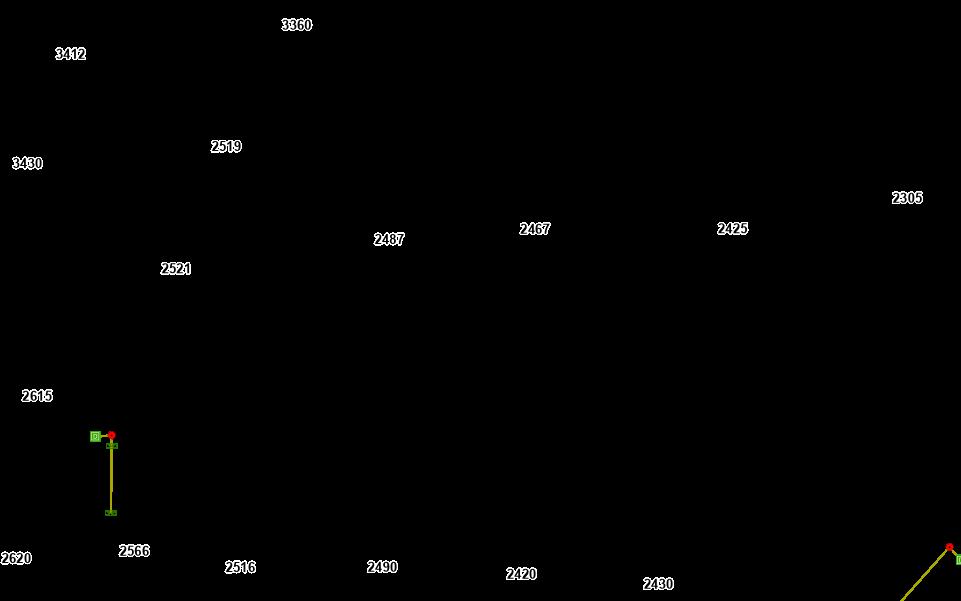
Yew Ave Storm Water - 2487 SW Yew Ave Sources: Esri, Airbus DS, USGS, NGA, NASA, CGIAR, N Robinson, NCEAS, NLS, OS, NMA, Geodatastyrelsen, Rijkswaterstaat, GSA, Geoland, FEMA, STORM PIPE ACCESS POINTS SEDIMENTATION MANHOLE STORM UIC FACILITIES DRYWELL CATCH BASINS CURB INLET REDMOND TAXLOTS 3/7/2024, 12:34:33 PM 0 0.01 0.02 0.01 mi 0 0.02 0.04 0.01 km 1:1,128 Web AppBuilder for ArcGIS Esri Community Maps Contributors, Oregon State Parks, State of Oregon GEO, © OpenStreetMap, Microsoft, Esri, TomTom, Garmin, SafeGraph, GeoTechnologies, Inc, METI/NASA, USGS, Bureau of Land Management, EPA, NPS, US Census Bureau, USDA,

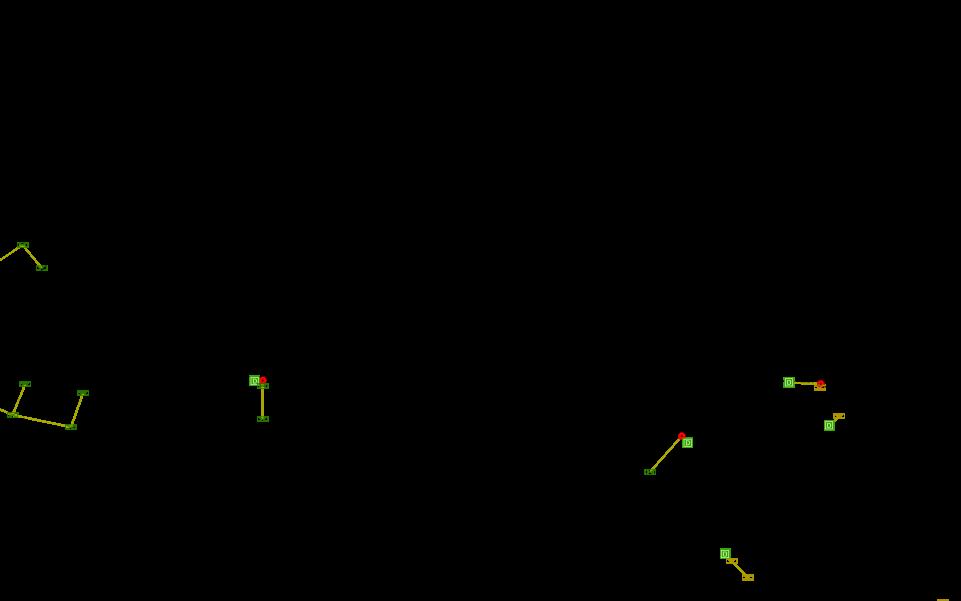
SWY SW rt Suites Storm Water No Aerial - 2487 SW Yew Ave Sources: Esri, Airbus DS, USGS, NGA, NASA, CGIAR, N Robinson, NCEAS, NLS, OS, NMA, Geodatastyrelsen, Rijkswaterstaat, GSA, Geoland, FEMA, STORM PIPE ACCESS POINTS SEDIMENTATION MANHOLE STORM UIC FACILITIES DRYWELL CATCH BASINS CURB INLET DROP INLET REDMOND TAXLOTS 3/7/2024, 12:35:47 PM 0 0.03 0.05 0.01 mi 0 0.04 0.08 0.02 km 1:2,257 Web AppBuilder for ArcGIS Esri Community Maps Contributors, Oregon State Parks, State of Oregon GEO, © OpenStreetMap, Microsoft, Esri, TomTom, Garmin, SafeGraph, GeoTechnologies, Inc, METI/NASA, USGS, Bureau of Land Management, EPA, NPS, US Census Bureau, USDA,
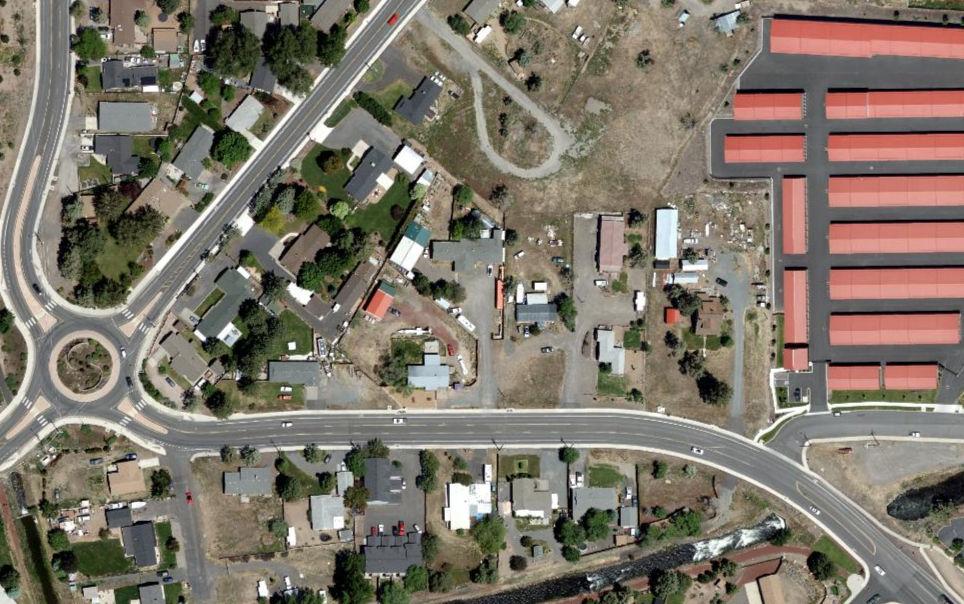

SWC ot Butte Ca e SW Natural Gas - 2487 SW Yew Ave Sources: Esri, Airbus DS, USGS, NGA, NASA, CGIAR, N Robinson, NCEAS, NLS, OS, NMA, Geodatastyrelsen, Rijkswaterstaat, GSA, Geoland, FEMA, NATURAL GAS REDMOND TAXLOTS 3/7/2024, 12:38:29 PM 0 0.03 0.05 0.01 mi 0 0.04 0.08 0.02 km 1:2,257 Web AppBuilder for ArcGIS Esri Community Maps Contributors, Oregon State Parks, State of Oregon GEO, © OpenStreetMap, Microsoft, Esri, TomTom, Garmin, SafeGraph, GeoTechnologies, Inc, METI/NASA, USGS, Bureau of Land Management, EPA, NPS, US Census Bureau, USDA,
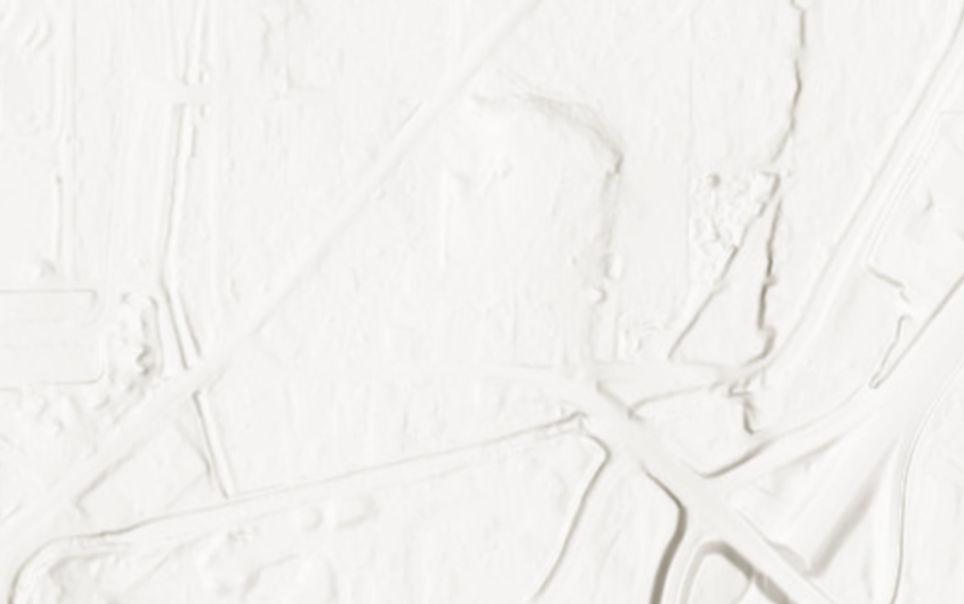

Yew Park lo t B u t t e C a lan Natural Gas No Aerial - 2487 SW Yew Ave Sources: Esri, Airbus DS, USGS, NGA, NASA, CGIAR, N Robinson, NCEAS, NLS, OS, NMA, Geodatastyrelsen, Rijkswaterstaat, GSA, Geoland, FEMA, NATURAL GAS REDMOND TAXLOTS 3/7/2024, 12:37:27 PM 0 0.06 0.11 0.03 mi 0 0.09 0.17 0.04 km 1:4,514 Web AppBuilder for ArcGIS Esri Community Maps Contributors, Oregon State Parks, State of Oregon GEO, © OpenStreetMap, Microsoft, Esri, TomTom, Garmin, SafeGraph, GeoTechnologies, Inc, METI/NASA, USGS, Bureau of Land Management, EPA, NPS, US Census Bureau, USDA,

Site Map
2487 SW Yew Ave, Redmond, Oregon, 97756
Rings: 1, 3, 5 mile radii
Prepared by Esri
Latitude: 44.24442
Longitude: -121.19662
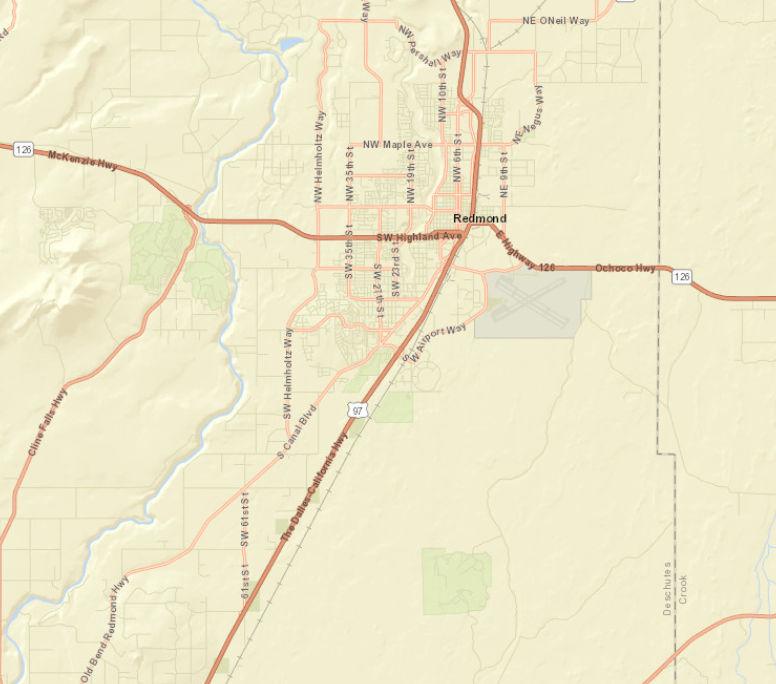
0 mi
March 07, 2024 ©2024 Esri Page 1 of 1

2487 SW Yew Ave, Redmond, Oregon, 97756 Prepared by Esri Ring: 1 mile radius Latitude: 44.24442 Longitude: -121.19662 2017-2021 ACS Estimate Percent MOE(±) Reliability TOTALS Total Population 7,868 481 Total Households 3,040 144 Total Housing Units 3,082 142 POPULATION AGE 3+ YEARS BY SCHOOL ENROLLMENT Total 7,589 100.0% 443 Enrolled in school 1,435 18 9% 205 Enrolled in nursery school, preschool 58 0.8% 96 Public school 33 0.4% 67 Private school 26 0.3% 67 Enrolled in kindergarten 31 0.4% 18 Public school 27 0.4% 22 Private school 4 0.1% 8 Enrolled in grade 1 to grade 4 500 6.6% 254 Public school 244 3.2% 86 Private school 256 3 4% 286 Enrolled in grade 5 to grade 8 296 3.9% 71 Public school 296 3 9% 71 Private school 0 0.0% 0 Enrolled in grade 9 to grade 12 311 4 1% 121 Public school 311 4.1% 121 Private school 0 0 0% 0 Enrolled in college undergraduate years 220 2.9% 47 Public school 189 2.5% 50 Private school 30 0.4% 72 Enrolled in graduate or professional school 18 0 2% 16 Public school 9 0.1% 20 Private school 9 0 1% 24 Not enrolled in school 6,155 81.1% 261 POPULATION AGE 65+ BY RELATIONSHIP AND HOUSEHOLD TYPE Total 1,239 100.0% 253 Living in Households 1,180 95 2% 249 Living in Family Households 779 62.9% 182 Householder 441 35 6% 116 Spouse 273 22 0% 95 Parent 3 0.2% 5 Parent-in-law 0 0 0% 0 Other Relative 41 3.3% 46 Nonrelative 20 1.6% 56 Living in Nonfamily Households 401 32 4% 166 Householder 383 30.9% 168 Nonrelative 18 1.5% 15 Living in Group Quarters 59 4 8% 46 Source: U.S. Census Bureau, 2017-2021 American Community Survey Reliability: high medium low March 07, 2024 ©2024 Esri Page 1 of 24
ACS Population Summary

2487 SW Yew Ave, Redmond, Oregon, 97756 Prepared by Esri Ring: 1 mile radius Latitude: 44.24442 Longitude: -121.19662 2017-2021 ACS Estimate Percent MOE(±) Reliability HOUSEHOLDS BY TYPE AND SIZE Family Households 1,926 63 4% 124 2-Person 840 27.6% 106 3-Person 497 16 3% 161 4-Person 315 10 4% 78 5-Person 75 2.5% 40 6-Person 146 4.8% 142 7+ Person 53 1.7% 67 Nonfamily Households 1,114 36 6% 141 1-Person 807 26 5% 159 2-Person 210 6.9% 52 3-Person 62 2.0% 39 4-Person 34 1.1% 63 5-Person 0 0.0% 0 6-Person 0 0.0% 0 7+ Person 0 0.0% 0 HOUSEHOLDS BY PRESENCE OF PEOPLE UNDER 18 YEARS BY HOUSEHOLD TYPE Households with one or more people under 18 years 872 28.7% 109 Family households 861 28.3% 108 Married-couple family 642 21.1% 112 Male householder, no wife present 115 3.8% 70 Female householder, no husband present 105 3.5% 38 Nonfamily households 10 0.3% 18 Households with no people under 18 years 2,168 71.3% 151 Married-couple family 880 28.9% 93 Other family 185 6.1% 119 Nonfamily households 1,103 36.3% 142 HOUSEHOLDS BY PRESENCE OF PEOPLE 65 YEARS AND OVER, HOUSEHOLD SIZE AND HOUSEHOLD TYPE Households with Pop 65+ 912 30.0% 203 1-Person 388 12.8% 172 2+ Person Family 511 16.8% 107 2+ Person Nonfamily 14 0.5% 17 Households with No Pop 65+ 2,127 70.0% 129 1-Person 419 13.8% 79 2+ Person Family 1,415 46.5% 142 2+ Person Nonfamily 293 9.6% 60 HOUSEHOLD TYPE BY RELATIVES AND NONRELATIVES FOR POPULATION IN HOUSEHOLDS POPULATION IN HOUSEHOLDS Total 7,789 100.0% 481 In Family Households 6,282 80 7% 505 In Married-Couple Family 5,090 65 3% 526 Relatives 5,066 65 0% 521 Nonrelatives 24 0.3% 30 In Male Householder-No Spouse Present-Family 573 7.4% 224 Relatives 307 3 9% 165 Nonrelatives 266 3.4% 190 In Female Householder-No Spouse Present-Family 619 7 9% 176 Relatives 619 7.9% 176 Nonrelatives 0 0.0% 0 In Nonfamily Households 1,507 19 3% 162 Source: U.S. Census Bureau, 2017-2021 American Community Survey Reliability: high medium low March 07, 2024 ©2024 Esri Page 2 of 24
ACS Population Summary

2487 SW Yew Ave, Redmond, Oregon, 97756 Prepared by Esri Ring: 1 mile radius Latitude: 44.24442 Longitude: -121.19662 2017-2021 ACS Estimate Percent MOE(±) Reliability POPULATION AGE 5+ YEARS BY LANGUAGE SPOKEN AT HOME AND ABILITY TO SPEAK ENGLISH Total 7,323 100.0% 412 5 to 17 years Speak only English 961 13 1% 248 Speak Spanish 216 2.9% 105 Speak English "very well" or "well" 216 2.9% 105 Speak English "not well" 0 0.0% 0 Speak English "not at all" 0 0 0% 0 Speak other Indo-European languages 0 0.0% 0 Speak English "very well" or "well" 0 0.0% 0 Speak English "not well" 0 0.0% 0 Speak English "not at all" 0 0 0% 0 Speak Asian and Pacific Island languages 0 0.0% 0 Speak English "very well" or "well" 0 0.0% 0 Speak English "not well" 0 0.0% 0 Speak English "not at all" 0 0 0% 0 Speak other languages 0 0.0% 0 Speak English "very well" or "well" 0 0.0% 0 Speak English "not well" 0 0.0% 0 Speak English "not at all" 0 0 0% 0 18 to 64 years Speak only English 4,230 57.8% 285 Speak Spanish 489 6.7% 222 Speak English "very well" or "well" 242 3 3% 57 Speak English "not well" 162 2.2% 189 Speak English "not at all" 86 1 2% 122 Speak other Indo-European languages 122 1.7% 159 Speak English "very well" or "well" 122 1 7% 158 Speak English "not well" 0 0.0% 0 Speak English "not at all" 0 0 0% 0 Speak Asian and Pacific Island languages 67 0.9% 72 Speak English "very well" or "well" 52 0.7% 59 Speak English "not well" 15 0.2% 27 Speak English "not at all" 0 0 0% 0 Speak other languages 0 0.0% 0 Speak English "very well" or "well" 0 0.0% 0 Speak English "not well" 0 0.0% 0 Speak English "not at all" 0 0 0% 0 65 years and over Speak only English 1,162 15 9% 245 Speak Spanish 48 0.7% 113 Speak English "very well" or "well" 48 0.7% 113 Speak English "not well" 0 0.0% 0 Speak English "not at all" 0 0 0% 0 Speak other Indo-European languages 0 0.0% 0 Speak English "very well" or "well" 0 0.0% 0 Speak English "not well" 0 0.0% 0 Speak English "not at all" 0 0 0% 0 Speak Asian and Pacific Island languages 29 0.4% 76 Speak English "very well" or "well" 29 0.4% 76 Speak English "not well" 0 0.0% 0 Speak English "not at all" 0 0 0% 0 Speak other languages 0 0.0% 0 Speak English "very well" or "well" 0 0.0% 0 Speak English "not well" 0 0.0% 0 Speak English "not at all" 0 0 0% 0 Source: U.S. Census Bureau, 2017-2021 American Community Survey Reliability: high medium low March 07, 2024 ©2024 Esri Page 3 of 24
ACS Population Summary

ACS Population Summary
2487 SW Yew Ave, Redmond, Oregon, 97756 Prepared by Esri Ring: 1 mile radius Latitude: 44.24442 Longitude: -121.19662 2017-2021 ACS Estimate Percent MOE(±) Reliability WORKERS AGE 16+ YEARS BY PLACE OF WORK Total 3,642 100.0% 235 Worked in state and in county of residence 3,338 91.7% 232 Worked in state and outside county of residence 236 6 5% 52 Worked outside state of residence 68 1.9% 44 SEX BY CLASS OF WORKER FOR THE CIVILIAN EMPLOYED POPULATION 16 YEARS AND OVER Total: 3,698 100.0% 237 Male: 1,866 50 5% 133 Employee of private company workers 1,387 37 5% 124 Self-employed in own incorporated business workers 151 4.1% 115 Private not-for-profit wage and salary workers 67 1.8% 47 Local government workers 24 0.6% 28 State government workers 41 1.1% 36 Federal government workers 11 0.3% 21 Self-employed in own not incorporated business workers 185 5 0% 106 Unpaid family workers 0 0.0% 0 Female: 1,833 49 6% 165 Employee of private company workers 1,220 33 0% 165 Self-employed in own incorporated business workers 80 2.2% 77 Private not-for-profit wage and salary workers 149 4.0% 52 Local government workers 205 5.5% 86 State government workers 34 0.9% 92 Federal government workers 12 0.3% 21 Self-employed in own not incorporated business workers 133 3.6% 68 Unpaid family workers 0 0 0% 0 POPULATION IN HOUSEHOLDS AND PRESENCE OF A COMPUTER Total 7,789 100.0% 481 Population <18 in Households 1,721 22 1% 252 Have a Computer 1,709 21 9% 369 Have NO Computer 12 0.2% 22 Population 18-64 in Households 4,889 62 8% 309 Have a Computer 4,811 61 8% 313 Have NO Computer 77 1 0% 49 Population 65+ in Households 1,180 15 1% 249 Have a Computer 965 12.4% 158 Have NO Computer 215 2 8% 264 HOUSEHOLDS AND INTERNET SUBSCRIPTIONS Total 3,040 100.0% 144 With an Internet Subscription 2,738 90.1% 116 Dial-Up Alone 37 1 2% 61 Broadband 2,314 76 1% 118 Satellite Service 133 4.4% 48 Other Service 15 0 5% 28 Internet Access with no Subscription 31 1.0% 48 With No Internet Access 271 8 9% 166 Source: U.S. Census Bureau, 2017-2021 American Community Survey Reliability: high medium low March 07, 2024 ©2024 Esri Page 4 of 24

ACS Population Summary
2487 SW Yew Ave, Redmond, Oregon, 97756 Prepared by Esri Ring: 1 mile radius Latitude: 44.24442 Longitude: -121.19662 2017-2021 ACS Estimate Percent MOE(±) Reliability WORKERS AGE 16+ YEARS BY MEANS OF TRANSPORTATION TO WORK Total 3,642 100.0% 235 Drove alone 2,614 71 8% 202 Carpooled 394 10 8% 115 Public transportation (excluding taxicab) 29 0.8% 76 Bus or trolley bus 29 0.8% 76 Light rail, streetcar or trolley 0 0.0% 0 Subway or elevated 0 0.0% 0 Long-distance/Commuter Train 0 0.0% 0 Ferryboat 0 0.0% 0 Taxicab 23 0.6% 73 Motorcycle 50 1.4% 120 Bicycle 81 2.2% 144 Walked 31 0.9% 34 Other means 29 0.8% 24 Worked at home 391 10 7% 101 WORKERS AGE 16+ YEARS (WHO DID NOT WORK FROM HOME) BY TRAVEL TIME TO WORK Total 3,251 100.0% 207 Less than 5 minutes 245 7.5% 104 5 to 9 minutes 664 20.4% 82 10 to 14 minutes 586 18 0% 95 15 to 19 minutes 216 6 6% 50 20 to 24 minutes 460 14 1% 144 25 to 29 minutes 392 12 1% 104 30 to 34 minutes 425 13.1% 111 35 to 39 minutes 89 2 7% 42 40 to 44 minutes 57 1.8% 68 45 to 59 minutes 59 1 8% 31 60 to 89 minutes 18 0.6% 51 90 or more minutes 40 1 2% 29 Average Travel Time to Work (in minutes) N/A N/A FEMALES AGE 20-64 YEARS BY AGE OF OWN CHILDREN AND EMPLOYMENT STATUS Total 2,549 100.0% 189 Own children under 6 years only 180 7.1% 67 In labor force 153 6 0% 75 Not in labor force 27 1.1% 26 Own children under 6 years and 6 to 17 years 299 11 7% 119 In labor force 137 5.4% 97 Not in labor force 162 6 4% 142 Own children 6 to 17 years only 289 11.3% 56 In labor force 172 6 7% 55 Not in labor force 117 4.6% 44 No own children under 18 years 1,780 69 8% 175 In labor force 1,368 53.7% 165 Not in labor force 412 16 2% 72 Source: U.S. Census Bureau, 2017-2021 American Community Survey Reliability: high medium low March 07, 2024 ©2024 Esri Page 5 of 24

ACS Population Summary
2487 SW Yew Ave, Redmond, Oregon, 97756 Prepared by Esri Ring: 1 mile radius Latitude: 44.24442 Longitude: -121.19662 2017-2021 ACS Estimate Percent MOE(±) Reliability CIVILIAN NONINSTITUTIONALIZED POPULATION BY AGE & TYPES OHEALINSURANCE COVERAGE OF HEALTH INSURANCE COVERAGE Total 7,848 100.0% 479 Under 19 years: 1,874 23 9% 344 One Type of Health Insurance: 1,666 21 2% 360 Employer-Based Health Ins Only 411 5.2% 222 Direct-Purchase Health Ins Only 59 0 8% 63 Medicare Coverage Only 0 0.0% 0 Medicaid Coverage Only 1,196 15 2% 466 TRICARE/Military Hlth Cov Only 0 0.0% 0 VA Health Care Only 0 0.0% 0 2+ Types of Health Insurance 175 2.2% 137 No Health Insurance Coverage 33 0.4% 61 19 to 34 years: 1,425 18.2% 162 One Type of Health Insurance: 1,179 15.0% 147 Employer-Based Health Ins Only 865 11 0% 111 Direct-Purchase Health Ins Only 31 0.4% 58 Medicare Coverage Only 0 0.0% 0 Medicaid Coverage Only 254 3 2% 108 TRICARE/Military Hlth Cov Only 21 0.3% 47 VA Health Care Only 8 0 1% 16 2+ Types of Health Insurance 112 1.4% 42 No Health Insurance Coverage 134 1 7% 64 35 to 64 years: 3,330 42 4% 255 One Type of Health Insurance: 2,112 26 9% 155 Employer-Based Health Ins Only 1,464 18 7% 165 Direct-Purchase Health Ins Only 256 3 3% 125 Medicare Coverage Only 37 0.5% 46 Medicaid Coverage Only 298 3 8% 67 TRICARE/Military Hlth Cov Only 15 0.2% 45 VA Health Care Only 42 0 5% 60 2+ Types of Health Insurance 652 8.3% 118 No Health Insurance Coverage 566 7.2% 210 65+ years: 1,219 15.5% 256 One Type of Health Insurance: 553 7.0% 316 Employer-Based Health Ins Only 15 0.2% 38 Direct-Purchase Health Ins Only 0 0.0% 0 Medicare Coverage Only 538 6.9% 314 TRICARE/Military Hlth Cov Only 0 0 0% 0 VA Health Care Only 0 0.0% 0 2+ Types of Health Insurance: 666 8 5% 98 Employer-Based & Direct-Purchase Health Insurance 0 0.0% 0 Employer-Based Health & Medicare Insurance 98 1.2% 84 Direct-Purchase Health & Medicare Insurance 168 2.1% 69 Medicare & Medicaid Coverage 78 1.0% 31 Other Private Health Insurance Combos 0 0.0% 0 Other Public Health Insurance Combos 39 0.5% 25 Other Health Insurance Combinations 283 3.6% 72 No Health Insurance Coverage 0 0.0% 0 Source: U.S. Census Bureau, 2017-2021 American Community Survey Reliability: high medium low March 07, 2024 ©2024 Esri Page 6 of 24

ACS Population Summary
SW Yew Ave, Redmond, Oregon, 97756
Ring: 1 mile radius Latitude:
Longitude:
2017-2021 ACS Estimate Percent MOE(±) Reliability POPULATION BY RATIO OF INCOME TO POVERTY LEVEL Total 7,765 100.0% 476 Under 50 252 3.2% 63 50 to 99 297 3 8% 169 1 00 to 1 24 373 4.8% 157 1 25 to 1 49 389 5 0% 184 1 50 to 1 84 836 10 8% 554 1 85 to 1 99 81 1 0% 45 2 00 and over 5,537 71 3% 391 CIVILIAN POPULATION AGE 18 OR OLDER BY VETERAN STATUS Total 6,147 100.0% 287 Veteran 535 8.7% 93 Nonveteran 5,612 91.3% 273 Male 2,708 44 1% 149 Veteran 503 8 2% 94 Nonveteran 2,205 35 9% 147 Female 3,439 55 9% 188 Veteran 32 0.5% 85 Nonveteran 3,407 55 4% 186 CIVILIAN VETERANS AGE 18 OR OLDER BY PERIOD OF MILITARY SERVICE Total 535 100.0% 93 Gulf War (9/01 or later), no Gulf War (8/90 to 8/01), no Vietnam Era 178 33 3% 87 Gulf War (9/01 or later) and Gulf War (8/90 to 8/01), no Vietnam Era 19 3.6% 15 Gulf War (9/01 or later), and Gulf War (8/90 to 8/01), and Vietnam Era 0 0.0% 0 Gulf War (8/90 to 8/01), no Vietnam Era 12 2.2% 21 Gulf War (8/90 to 8/01) and Vietnam Era 0 0.0% 0 Vietnam Era, no Korean War, no World War II 241 45 0% 72 Vietnam Era and Korean War, no World War II 0 0.0% 0 Vietnam Era and Korean War and World War II 0 0.0% 0 Korean War, no Vietnam Era, no World War II 15 2.8% 37 Korean War and World War II, no Vietnam Era 0 0 0% 0 World War II, no Korean War, no Vietnam Era 21 3.9% 60 Between Gulf War and Vietnam Era only 19 3.6% 14 Between Vietnam Era and Korean War only 30 5.6% 54 Between Korean War and World War II only 0 0.0% 0 Pre-World War II only 0 0.0% 0 HOUSEHOLDS BY POVERTY STATUS Total 3,040 100.0% 144 Income in the past 12 months below poverty level 207 6.8% 58 Married-couple family 43 1.4% 29 Other family - male householder (no wife present) 0 0.0% 0 Other family - female householder (no husband present) 60 2.0% 28 Nonfamily household - male householder 21 0.7% 16 Nonfamily household - female householder 83 2.7% 42 Income in the past 12 months at or above poverty level 2,833 93 2% 149 Married-couple family 1,479 48 7% 114 Other family - male householder (no wife present) 147 4.8% 75 Other family - female householder (no husband present) 197 6.5% 98 Nonfamily household - male householder 318 10.5% 82 Nonfamily household - female householder 692 22 8% 124 Poverty Index 55 Source: U.S. Census Bureau, 2017-2021 American Community Survey Reliability: high medium low March 07, 2024 ©2024 Esri Page 7 of 24
2487
Prepared by Esri
44.24442
-121.19662

44.24442
Data Note: N/A means not available Population by Ratio of Income to Poverty Level represents persons for whom poverty status is determined. Household income represents income in 2021, adjusted for inflation
2017-2021 ACS Estimate: The American Community Survey (ACS) replaces census sample data. Esri is releasing the 2017-2021 ACS estimates, five-year period data collected monthly from January 1, 2017 through December 31, 2021. Although the ACS includes many of the subjects previously covered by the decennial census sample, there are significant differences between the two surveys including fundamental differences in survey design and residency rules
Margin of error (MOE): The MOE is a measure of the variability of the estimate due to sampling error. MOEs enable the data user to measure the range of uncertainty for each estimate with 90 percent confidence. The range of uncertainty is called the confidence interval, and it is calculated by taking the estimate +/- the MOE. For example, if the ACS reports an estimate of 100 with an MOE of +/- 20, then you can be 90 percent certain the value for the whole population falls between 80 and 120.
Reliability: These symbols represent threshold values that Esri has established from the Coefficients of Variation (CV) to designate the usability of the estimates. The CV measures the amount of sampling error relative to the size of the estimate, expressed as a percentage
High Reliability: Small CVs (less than or equal to 12 percent) are flagged green to indicate that the sampling error is small relative to the estimate and the estimate is reasonably reliable.
Medium Reliability: Estimates with CVs between 12 and 40 are flagged yellow-use with caution.
Low Reliability: Large CVs (over 40 percent) are flagged red to indicate that the sampling error is large relative to the estimate. The estimate is considered very unreliable.
Source: U.S. Census Bureau, 2017-2021 American Community Survey
Reliability: high medium low
Ring:
Latitude:
Longitude:
2017-2021 ACS Estimate Percent MOE(±) Reliability HOUSEHOLDS BY OTHER INCOME Social Security Income 1,075 35 4% 181 No Social Security Income 1,965 64.6% 118 Retirement Income 533 17 5% 80 No Retirement Income 2,507 82 5% 142 GROSS RENT AS A PERCENTAGE OF HOUSEHOLD INCOME IN THE PAST 12 MONTHS <10% of Income 54 4.3% 104 10-14 9% of Income 214 17 1% 87 15-19 9% of Income 95 7 6% 39 20-24 9% of Income 148 11 9% 54 25-29.9% of Income 116 9.3% 49 30-34 9% of Income 80 6.4% 60 35-39 9% of Income 35 2 8% 42 40-49 9% of Income 130 10 4% 72 50+% of Income 335 26 8% 191 Gross Rent % Inc Not Computed 41 3.3% 46 HOUSEHOLDS BY PUBLIC ASSISTANCE INCOME IN THE PAST 12 MONTHS Total 3,040 100.0% 144 With public assistance income 101 3.3% 57 No public assistance income 2,939 96.7% 144 HOUSEHOLDS BY FOOD STAMPS/SNAP STATUS Total 3,040 100.0% 144 With Food Stamps/SNAP 576 18.9% 70 With No Food Stamps/SNAP 2,464 81.1% 156 HOUSEHOLDS BY DISABILITY STATUS Total 3,040 100.0% 144 With 1+ Persons w/Disability 1,059 34.8% 148 With No Person w/Disability 1,981 65.2% 119
ACS Population Summary 2487 SW Yew Ave, Redmond, Oregon, 97756 Prepared by Esri
1 mile radius
-121.19662
March 07, 2024 ©2024 Esri Page 8 of 24

ACS Population Summary
2487 SW Yew Ave, Redmond, Oregon, 97756 Prepared by Esri Ring: 3 mile radius Latitude: 44.24442 Longitude: -121.19662 2017-2021 ACS Estimate Percent MOE(±) Reliability TOTALS Total Population 28,478 2,115 Total Households 10,770 763 Total Housing Units 10,969 689 POPULATION AGE 3+ YEARS BY SCHOOL ENROLLMENT Total 27,305 100.0% 2,052 Enrolled in school 6,041 22 1% 887 Enrolled in nursery school, preschool 376 1 4% 222 Public school 251 0.9% 178 Private school 125 0 5% 132 Enrolled in kindergarten 235 0.9% 178 Public school 225 0 8% 178 Private school 10 0.0% 18 Enrolled in grade 1 to grade 4 1,516 5.6% 478 Public school 1,088 4.0% 364 Private school 428 1 6% 318 Enrolled in grade 5 to grade 8 1,663 6.1% 418 Public school 1,522 5 6% 399 Private school 142 0.5% 109 Enrolled in grade 9 to grade 12 1,459 5 3% 413 Public school 1,372 5.0% 405 Private school 87 0.3% 82 Enrolled in college undergraduate years 673 2.5% 229 Public school 569 2.1% 207 Private school 104 0.4% 100 Enrolled in graduate or professional school 118 0 4% 60 Public school 45 0.2% 38 Private school 74 0.3% 52 Not enrolled in school 21,265 77.9% 1,232 POPULATION AGE 65+ BY RELATIONSHIP AND HOUSEHOLD TYPE Total 3,764 100.0% 503 Living in Households 3,654 97 1% 499 Living in Family Households 2,322 61 7% 455 Householder 1,270 33 7% 264 Spouse 824 21 9% 214 Parent 11 0.3% 14 Parent-in-law 77 2.0% 102 Other Relative 90 2.4% 80 Nonrelative 51 1.4% 65 Living in Nonfamily Households 1,332 35 4% 265 Householder 1,248 33.2% 246 Nonrelative 84 2.2% 73 Living in Group Quarters 110 2 9% 69 Source: U.S. Census Bureau, 2017-2021 American Community Survey Reliability: high medium low March 07, 2024 ©2024 Esri Page 9 of 24

ACS Population Summary
2487 SW Yew Ave, Redmond, Oregon, 97756 Prepared by Esri Ring: 3 mile radius Latitude: 44.24442 Longitude: -121.19662 2017-2021 ACS Estimate Percent MOE(±) Reliability HOUSEHOLDS BY TYPE AND SIZE Family Households 6,827 63 4% 644 2-Person 2,443 22.7% 458 3-Person 2,120 19 7% 453 4-Person 1,264 11 7% 390 5-Person 529 4 9% 191 6-Person 363 3.4% 212 7+ Person 108 1.0% 91 Nonfamily Households 3,943 36 6% 608 1-Person 2,757 25 6% 522 2-Person 916 8.5% 338 3-Person 231 2 1% 134 4-Person 40 0.4% 64 5-Person 0 0.0% 0 6-Person 0 0.0% 0 7+ Person 0 0.0% 0 HOUSEHOLDS BY PRESENCE OF PEOPLE UNDER 18 YEARS BY HOUSEHOLD TYPE Households with one or more people under 18 years 3,712 34.5% 540 Family households 3,697 34.3% 539 Married-couple family 2,507 23.3% 497 Male householder, no wife present 516 4.8% 207 Female householder, no husband present 674 6.3% 350 Nonfamily households 16 0.1% 20 Households with no people under 18 years 7,058 65.5% 669 Married-couple family 2,442 22.7% 398 Other family 688 6.4% 280 Nonfamily households 3,928 36.5% 608 HOUSEHOLDS BY PRESENCE OF PEOPLE 65 YEARS AND OVER, HOUSEHOLD SIZE AND HOUSEHOLD TYPE Households with Pop 65+ 2,795 26.0% 464 1-Person 1,167 10.8% 381 2+ Person Family 1,534 14.2% 309 2+ Person Nonfamily 94 0.9% 73 Households with No Pop 65+ 7,975 74.0% 722 1-Person 1,590 14.8% 386 2+ Person Family 5,292 49.1% 629 2+ Person Nonfamily 1,093 10.1% 362 HOUSEHOLD TYPE BY RELATIVES AND NONRELATIVES FOR POPULATION IN HOUSEHOLDS POPULATION IN HOUSEHOLDS Total 28,291 100.0% 2,114 In Family Households 22,723 80 3% 2,113 In Married-Couple Family 16,776 59 3% 2,131 Relatives 16,523 58 4% 2,114 Nonrelatives 253 0.9% 251 In Male Householder-No Spouse Present-Family 2,152 7.6% 780 Relatives 1,526 5 4% 548 Nonrelatives 626 2.2% 362 In Female Householder-No Spouse Present-Family 3,794 13 4% 1,252 Relatives 3,435 12.1% 1,094 Nonrelatives 359 1 3% 273 In Nonfamily Households 5,568 19 7% 865 Source: U.S. Census Bureau, 2017-2021 American Community Survey Reliability: high medium low March 07, 2024 ©2024 Esri Page 10 of 24

2487 SW Yew Ave, Redmond, Oregon, 97756 Prepared by Esri Ring: 3 mile radius Latitude: 44.24442 Longitude: -121.19662 2017-2021 ACS Estimate Percent MOE(±) Reliability POPULATION AGE 5+ YEARS BY LANGUAGE SPOKEN AT HOME AND ABILITY TO SPEAK ENGLISH Total 26,692 100.0% 1,997 5 to 17 years Speak only English 4,101 15 4% 799 Speak Spanish 951 3.6% 462 Speak English "very well" or "well" 845 3.2% 430 Speak English "not well" 106 0.4% 107 Speak English "not at all" 0 0 0% 0 Speak other Indo-European languages 2 0.0% 8 Speak English "very well" or "well" 2 0.0% 8 Speak English "not well" 0 0.0% 0 Speak English "not at all" 0 0 0% 0 Speak Asian and Pacific Island languages 19 0.1% 35 Speak English "very well" or "well" 0 0.0% 0 Speak English "not well" 19 0.1% 35 Speak English "not at all" 0 0 0% 0 Speak other languages 0 0.0% 0 Speak English "very well" or "well" 0 0.0% 0 Speak English "not well" 0 0.0% 0 Speak English "not at all" 0 0 0% 0 18 to 64 years Speak only English 15,714 58.9% 1,356 Speak Spanish 1,783 6.7% 564 Speak English "very well" or "well" 1,125 4 2% 439 Speak English "not well" 560 2.1% 336 Speak English "not at all" 98 0 4% 122 Speak other Indo-European languages 258 1.0% 189 Speak English "very well" or "well" 258 1 0% 188 Speak English "not well" 0 0.0% 0 Speak English "not at all" 0 0 0% 0 Speak Asian and Pacific Island languages 100 0.4% 84 Speak English "very well" or "well" 83 0.3% 73 Speak English "not well" 17 0.1% 27 Speak English "not at all" 0 0 0% 0 Speak other languages 0 0.0% 0 Speak English "very well" or "well" 0 0.0% 0 Speak English "not well" 0 0.0% 0 Speak English "not at all" 0 0 0% 0 65 years and over Speak only English 3,377 12 7% 464 Speak Spanish 131 0.5% 103 Speak English "very well" or "well" 79 0.3% 112 Speak English "not well" 0 0.0% 0 Speak English "not at all" 52 0 2% 78 Speak other Indo-European languages 179 0.7% 203 Speak English "very well" or "well" 179 0 7% 209 Speak English "not well" 0 0.0% 0 Speak English "not at all" 0 0 0% 0 Speak Asian and Pacific Island languages 77 0.3% 60 Speak English "very well" or "well" 53 0.2% 67 Speak English "not well" 24 0.1% 38 Speak English "not at all" 0 0 0% 0 Speak other languages 0 0.0% 0 Speak English "very well" or "well" 0 0.0% 0 Speak English "not well" 0 0.0% 0 Speak English "not at all" 0 0 0% 0 Source: U.S. Census Bureau, 2017-2021 American Community Survey Reliability: high medium low March 07, 2024 ©2024 Esri Page 11 of 24
ACS Population Summary

ACS Population Summary
2487 SW Yew Ave, Redmond, Oregon, 97756 Prepared by Esri Ring: 3 mile radius Latitude: 44.24442 Longitude: -121.19662 2017-2021 ACS Estimate Percent MOE(±) Reliability WORKERS AGE 16+ YEARS BY PLACE OF WORK Total 14,143 100.0% 1,295 Worked in state and in county of residence 13,035 92.2% 1,289 Worked in state and outside county of residence 949 6 7% 344 Worked outside state of residence 160 1.1% 96 SEX BY CLASS OF WORKER FOR THE CIVILIAN EMPLOYED POPULATION 16 YEARS AND OVER Total: 14,451 100.0% 1,295 Male: 7,452 51 6% 775 Employee of private company workers 5,389 37 3% 762 Self-employed in own incorporated business workers 533 3.7% 178 Private not-for-profit wage and salary workers 265 1.8% 160 Local government workers 146 1.0% 71 State government workers 162 1 1% 94 Federal government workers 168 1.2% 74 Self-employed in own not incorporated business workers 789 5 5% 398 Unpaid family workers 0 0.0% 0 Female: 6,999 48 4% 781 Employee of private company workers 4,609 31 9% 739 Self-employed in own incorporated business workers 336 2 3% 148 Private not-for-profit wage and salary workers 774 5.4% 253 Local government workers 702 4.9% 267 State government workers 112 0.8% 103 Federal government workers 56 0.4% 72 Self-employed in own not incorporated business workers 395 2.7% 191 Unpaid family workers 15 0 1% 23 POPULATION IN HOUSEHOLDS AND PRESENCE OF A COMPUTER Total 28,291 100.0% 2,114 Population <18 in Households 6,858 24 2% 972 Have a Computer 6,744 23 8% 972 Have NO Computer 114 0.4% 149 Population 18-64 in Households 17,779 62 8% 1,453 Have a Computer 17,470 61 8% 1,462 Have NO Computer 309 1.1% 168 Population 65+ in Households 3,654 12 9% 499 Have a Computer 3,217 11.4% 481 Have NO Computer 437 1 5% 227 HOUSEHOLDS AND INTERNET SUBSCRIPTIONS Total 10,770 100.0% 763 With an Internet Subscription 9,763 90.6% 711 Dial-Up Alone 64 0 6% 77 Broadband 7,889 73 2% 730 Satellite Service 1,065 9 9% 316 Other Service 41 0 4% 41 Internet Access with no Subscription 117 1.1% 81 With No Internet Access 890 8 3% 379 Source: U.S. Census Bureau, 2017-2021 American Community Survey Reliability: high medium low March 07, 2024 ©2024 Esri Page 12 of 24

ACS Population Summary
2487 SW Yew Ave, Redmond, Oregon, 97756 Prepared by Esri Ring: 3 mile radius Latitude: 44.24442 Longitude: -121.19662 2017-2021 ACS Estimate Percent MOE(±) Reliability WORKERS AGE 16+ YEARS BY MEANS OF TRANSPORTATION TO WORK Total 14,143 100.0% 1,295 Drove alone 11,181 79 1% 1,235 Carpooled 1,096 7 7% 324 Public transportation (excluding taxicab) 134 0.9% 131 Bus or trolley bus 134 0 9% 131 Light rail, streetcar or trolley 0 0.0% 0 Subway or elevated 0 0.0% 0 Long-distance/Commuter Train 0 0.0% 0 Ferryboat 0 0.0% 0 Taxicab 52 0.4% 75 Motorcycle 80 0.6% 117 Bicycle 128 0.9% 147 Walked 259 1 8% 137 Other means 196 1.4% 231 Worked at home 1,016 7 2% 309 WORKERS AGE 16+ YEARS (WHO DID NOT WORK FROM HOME) BY TRAVEL TIME TO WORK Total 13,127 100.0% 1,258 Less than 5 minutes 795 6.1% 243 5 to 9 minutes 2,338 17.8% 494 10 to 14 minutes 2,262 17 2% 555 15 to 19 minutes 891 6 8% 277 20 to 24 minutes 1,947 14 8% 551 25 to 29 minutes 1,888 14 4% 693 30 to 34 minutes 1,920 14.6% 414 35 to 39 minutes 297 2 3% 146 40 to 44 minutes 253 1.9% 139 45 to 59 minutes 232 1 8% 99 60 to 89 minutes 154 1.2% 128 90 or more minutes 149 1 1% 112 Average Travel Time to Work (in minutes) N/A N/A FEMALES AGE 20-64 YEARS BY AGE OF OWN CHILDREN AND EMPLOYMENT STATUS Total 8,913 100.0% 829 Own children under 6 years only 1,083 12.2% 401 In labor force 905 10 2% 381 Not in labor force 177 2.0% 134 Own children under 6 years and 6 to 17 years 558 6 3% 276 In labor force 317 3.6% 210 Not in labor force 241 2 7% 180 Own children 6 to 17 years only 1,812 20.3% 454 In labor force 1,488 16 7% 421 Not in labor force 324 3.6% 167 No own children under 18 years 5,460 61 3% 716 In labor force 4,477 50.2% 686 Not in labor force 983 11 0% 267 Source: U.S. Census Bureau, 2017-2021 American Community Survey Reliability: high medium low March 07, 2024 ©2024 Esri Page 13 of 24

ACS Population Summary
2487 SW Yew Ave, Redmond, Oregon, 97756 Prepared by Esri Ring: 3 mile radius Latitude: 44.24442 Longitude: -121.19662 2017-2021 ACS Estimate Percent MOE(±) Reliability CIVILIAN NONINSTITUTIONALIZED POPULATION BY AGE & TYPES OHEALINSURANCE COVERAGE OF HEALTH INSURANCE COVERAGE Total 28,440 100.0% 2,114 Under 19 years: 7,348 25 8% 1,016 One Type of Health Insurance: 6,708 23 6% 972 Employer-Based Health Ins Only 1,789 6.3% 513 Direct-Purchase Health Ins Only 667 2 3% 418 Medicare Coverage Only 0 0.0% 0 Medicaid Coverage Only 4,203 14 8% 857 TRICARE/Military Hlth Cov Only 48 0.2% 96 VA Health Care Only 0 0.0% 0 2+ Types of Health Insurance 518 1.8% 276 No Health Insurance Coverage 122 0.4% 90 19 to 34 years: 6,021 21.2% 944 One Type of Health Insurance: 4,666 16.4% 711 Employer-Based Health Ins Only 2,911 10 2% 532 Direct-Purchase Health Ins Only 436 1 5% 311 Medicare Coverage Only 0 0.0% 0 Medicaid Coverage Only 1,255 4 4% 409 TRICARE/Military Hlth Cov Only 54 0.2% 50 VA Health Care Only 9 0 0% 16 2+ Types of Health Insurance 719 2.5% 348 No Health Insurance Coverage 636 2 2% 318 35 to 64 years: 11,338 39 9% 1,179 One Type of Health Insurance: 7,847 27 6% 1,005 Employer-Based Health Ins Only 5,069 17 8% 880 Direct-Purchase Health Ins Only 1,115 3 9% 445 Medicare Coverage Only 164 0.6% 106 Medicaid Coverage Only 1,326 4 7% 329 TRICARE/Military Hlth Cov Only 86 0.3% 75 VA Health Care Only 87 0 3% 74 2+ Types of Health Insurance 1,929 6.8% 481 No Health Insurance Coverage 1,561 5.5% 494 65+ years: 3,734 13.1% 500 One Type of Health Insurance: 1,492 5.2% 369 Employer-Based Health Ins Only 65 0.2% 51 Direct-Purchase Health Ins Only 0 0.0% 0 Medicare Coverage Only 1,427 5.0% 368 TRICARE/Military Hlth Cov Only 0 0 0% 0 VA Health Care Only 0 0.0% 0 2+ Types of Health Insurance: 2,235 7 9% 408 Employer-Based & Direct-Purchase Health Insurance 0 0.0% 0 Employer-Based Health & Medicare Insurance 279 1 0% 120 Direct-Purchase Health & Medicare Insurance 901 3.2% 321 Medicare & Medicaid Coverage 193 0 7% 93 Other Private Health Insurance Combos 0 0.0% 0 Other Public Health Insurance Combos 53 0.2% 39 Other Health Insurance Combinations 810 2.8% 231 No Health Insurance Coverage 7 0.0% 13 Source: U.S. Census Bureau, 2017-2021 American Community Survey Reliability: high medium low March 07, 2024 ©2024 Esri Page 14 of 24

ACS Population Summary
44.24442
-121.19662
2487 SW Yew Ave, Redmond, Oregon, 97756
Ring: 3 mile radius Latitude:
Longitude:
2017-2021 ACS Estimate Percent MOE(±) Reliability POPULATION BY RATIO OF INCOME TO POVERTY LEVEL Total 28,221 100.0% 2,115 Under 50 975 3.5% 346 50 to 99 1,377 4 9% 505 1 00 to 1 24 1,336 4.7% 590 1 25 to 1 49 2,232 7 9% 1,012 1 50 to 1 84 2,322 8.2% 940 1 85 to 1 99 514 1 8% 518 2 00 and over 19,464 69 0% 1,983 CIVILIAN POPULATION AGE 18 OR OLDER BY VETERAN STATUS Total 21,617 100.0% 1,451 Veteran 1,757 8.1% 357 Nonveteran 19,860 91.9% 1,378 Male 9,972 46 1% 822 Veteran 1,619 7 5% 331 Nonveteran 8,353 38 6% 789 Female 11,645 53.9% 882 Veteran 138 0.6% 122 Nonveteran 11,507 53 2% 879 CIVILIAN VETERANS AGE 18 OR OLDER BY PERIOD OF MILITARY SERVICE Total 1,757 100.0% 357 Gulf War (9/01 or later), no Gulf War (8/90 to 8/01), no Vietnam Era 459 26 1% 285 Gulf War (9/01 or later) and Gulf War (8/90 to 8/01), no Vietnam Era 55 3.1% 45 Gulf War (9/01 or later), and Gulf War (8/90 to 8/01), and Vietnam Era 0 0.0% 0 Gulf War (8/90 to 8/01), no Vietnam Era 189 10.8% 111 Gulf War (8/90 to 8/01) and Vietnam Era 0 0.0% 0 Vietnam Era, no Korean War, no World War II 634 36 1% 173 Vietnam Era and Korean War, no World War II 0 0.0% 0 Vietnam Era and Korean War and World War II 0 0.0% 0 Korean War, no Vietnam Era, no World War II 34 1.9% 28 Korean War and World War II, no Vietnam Era 0 0 0% 0 World War II, no Korean War, no Vietnam Era 35 2.0% 60 Between Gulf War and Vietnam Era only 301 17 1% 129 Between Vietnam Era and Korean War only 50 2.8% 52 Between Korean War and World War II only 0 0.0% 0 Pre-World War II only 0 0.0% 0 HOUSEHOLDS BY POVERTY STATUS Total 10,770 100.0% 763 Income in the past 12 months below poverty level 947 8.8% 257 Married-couple family 88 0.8% 71 Other family - male householder (no wife present) 137 1.3% 123 Other family - female householder (no husband present) 184 1 7% 103 Nonfamily household - male householder 199 1.8% 119 Nonfamily household - female householder 338 3.1% 151 Income in the past 12 months at or above poverty level 9,823 91 2% 778 Married-couple family 4,861 45 1% 623 Other family - male householder (no wife present) 468 4.3% 205 Other family - female householder (no husband present) 1,089 10.1% 435 Nonfamily household - male householder 1,175 10.9% 312 Nonfamily household - female householder 2,231 20 7% 521 Poverty Index 71 Source: U.S. Census Bureau, 2017-2021 American Community Survey Reliability: high medium low March 07, 2024 ©2024 Esri Page 15 of 24
Prepared by Esri

ACS Population Summary
Data Note: N/A means not available Population by Ratio of Income to Poverty Level represents persons for whom poverty status is determined. Household income represents income in 2021, adjusted for inflation
2017-2021 ACS Estimate: The American Community Survey (ACS) replaces census sample data. Esri is releasing the 2017-2021 ACS estimates, five-year period data collected monthly from January 1, 2017 through December 31, 2021. Although the ACS includes many of the subjects previously covered by the decennial census sample, there are significant differences between the two surveys including fundamental differences in survey design and residency rules
Margin of error (MOE): The MOE is a measure of the variability of the estimate due to sampling error. MOEs enable the data user to measure the range of uncertainty for each estimate with 90 percent confidence. The range of uncertainty is called the confidence interval, and it is calculated by taking the estimate +/- the MOE. For example, if the ACS reports an estimate of 100 with an MOE of +/- 20, then you can be 90 percent certain the value for the whole population falls between 80 and 120.
Reliability: These symbols represent threshold values that Esri has established from the Coefficients of Variation (CV) to designate the usability of the estimates. The CV measures the amount of sampling error relative to the size of the estimate, expressed as a percentage
High Reliability: Small CVs (less than or equal to 12 percent) are flagged green to indicate that the sampling error is small relative to the estimate and the estimate is reasonably reliable.
Medium Reliability: Estimates with CVs between 12 and 40 are flagged yellow-use with caution.
Low Reliability: Large CVs (over 40 percent) are flagged red to indicate that the sampling error is large relative to the estimate. The estimate is considered very unreliable.
Source: U.S. Census Bureau, 2017-2021 American Community Survey
Reliability: high medium low
SW Yew Ave, Redmond,
97756
Ring:
mile radius Latitude:
Longitude:
2017-2021 ACS Estimate Percent MOE(±) Reliability HOUSEHOLDS BY OTHER INCOME Social Security Income 3,448 32 0% 541 No Social Security Income 7,323 68.0% 697 Retirement Income 1,701 15 8% 309 No Retirement Income 9,069 84 2% 786 GROSS RENT AS A PERCENTAGE OF HOUSEHOLD INCOME IN THE PAST 12 MONTHS <10% of Income 88 2.3% 106 10-14 9% of Income 350 9.2% 207 15-19 9% of Income 553 14 5% 244 20-24 9% of Income 456 11 9% 213 25-29.9% of Income 430 11.3% 205 30-34 9% of Income 288 7.5% 145 35-39 9% of Income 392 10 3% 276 40-49 9% of Income 368 9.6% 208 50+% of Income 823 21 6% 351 Gross Rent % Inc Not Computed 72 1.9% 70 HOUSEHOLDS BY PUBLIC ASSISTANCE INCOME IN THE PAST 12 MONTHS Total 10,770 100.0% 763 With public assistance income 311 2.9% 142 No public assistance income 10,459 97.1% 764 HOUSEHOLDS BY FOOD STAMPS/SNAP STATUS Total 10,770 100.0% 763 With Food Stamps/SNAP 1,802 16.7% 356 With No Food Stamps/SNAP 8,968 83.3% 770 HOUSEHOLDS BY DISABILITY STATUS Total 10,770 100.0% 763 With 1+ Persons w/Disability 3,023 28.1% 550 With No Person w/Disability 7,747 71.9% 751
2487
Oregon,
Prepared by Esri
3
44.24442
-121.19662
March 07, 2024 ©2024 Esri Page 16 of 24

ACS Population Summary
2487 SW Yew Ave, Redmond, Oregon, 97756 Prepared by Esri Ring: 5 mile radius Latitude: 44.24442 Longitude: -121.19662 2017-2021 ACS Estimate Percent MOE(±) Reliability TOTALS Total Population 38,472 2,430 Total Households 15,035 857 Total Housing Units 15,714 869 POPULATION AGE 3+ YEARS BY SCHOOL ENROLLMENT Total 37,181 100.0% 2,366 Enrolled in school 7,781 20 9% 976 Enrolled in nursery school, preschool 524 1 4% 234 Public school 326 0.9% 192 Private school 198 0 5% 137 Enrolled in kindergarten 268 0.7% 179 Public school 236 0 6% 179 Private school 32 0.1% 23 Enrolled in grade 1 to grade 4 1,930 5.2% 510 Public school 1,481 4.0% 405 Private school 450 1 2% 320 Enrolled in grade 5 to grade 8 2,132 5.7% 462 Public school 1,911 5 1% 442 Private school 221 0.6% 130 Enrolled in grade 9 to grade 12 1,790 4 8% 448 Public school 1,648 4.4% 439 Private school 142 0 4% 93 Enrolled in college undergraduate years 994 2.7% 277 Public school 881 2.4% 259 Private school 113 0.3% 100 Enrolled in graduate or professional school 143 0 4% 83 Public school 55 0.1% 50 Private school 88 0.2% 66 Not enrolled in school 29,400 79.1% 1,474 POPULATION AGE 65+ BY RELATIONSHIP AND HOUSEHOLD TYPE Total 6,609 100.0% 716 Living in Households 6,488 98 2% 710 Living in Family Households 4,501 68 1% 601 Householder 2,344 35 5% 337 Spouse 1,760 26 6% 279 Parent 43 0.7% 38 Parent-in-law 126 1 9% 129 Other Relative 144 2.2% 98 Nonrelative 85 1.3% 82 Living in Nonfamily Households 1,987 30 1% 458 Householder 1,873 28.3% 443 Nonrelative 113 1.7% 88 Living in Group Quarters 121 1 8% 97 Source: U.S. Census Bureau, 2017-2021 American Community Survey Reliability: high medium low March 07, 2024 ©2024 Esri Page 17 of 24

2487 SW Yew Ave, Redmond, Oregon, 97756 Prepared by Esri Ring: 5 mile radius Latitude: 44.24442 Longitude: -121.19662 2017-2021 ACS Estimate Percent MOE(±) Reliability HOUSEHOLDS BY TYPE AND SIZE Family Households 9,783 65 1% 728 2-Person 4,229 28.1% 503 3-Person 2,584 17 2% 515 4-Person 1,603 10 7% 416 5-Person 826 5 5% 253 6-Person 398 2.6% 216 7+ Person 143 1.0% 92 Nonfamily Households 5,252 34 9% 679 1-Person 3,765 25 0% 580 2-Person 1,156 7.7% 365 3-Person 262 1 7% 168 4-Person 68 0.5% 73 5-Person 0 0.0% 0 6-Person 0 0.0% 0 7+ Person 0 0.0% 0 HOUSEHOLDS BY PRESENCE OF PEOPLE UNDER 18 YEARS BY HOUSEHOLD TYPE Households with one or more people under 18 years 4,512 30.0% 578 Family households 4,458 29.7% 577 Married-couple family 3,103 20.6% 534 Male householder, no wife present 565 3.8% 215 Female householder, no husband present 789 5.2% 355 Nonfamily households 54 0.4% 48 Households with no people under 18 years 10,523 70.0% 757 Married-couple family 4,352 28.9% 487 Other family 973 6.5% 309 Nonfamily households 5,198 34.6% 679 HOUSEHOLDS BY PRESENCE OF PEOPLE 65 YEARS AND OVER, HOUSEHOLD SIZE AND HOUSEHOLD TYPE Households with Pop 65+ 4,728 31.4% 535 1-Person 1,686 11.2% 430 2+ Person Family 2,836 18.9% 370 2+ Person Nonfamily 206 1.4% 136 Households with No Pop 65+ 10,306 68.5% 806 1-Person 2,079 13.8% 420 2+ Person Family 6,947 46.2% 703 2+ Person Nonfamily 1,280 8.5% 383 HOUSEHOLD TYPE BY RELATIVES AND NONRELATIVES FOR POPULATION IN HOUSEHOLDS POPULATION IN HOUSEHOLDS Total 38,248 100.0% 2,423 In Family Households 30,971 81 0% 2,412 In Married-Couple Family 23,624 61 8% 2,415 Relatives 23,254 60 8% 2,390 Nonrelatives 370 1.0% 267 In Male Householder-No Spouse Present-Family 2,465 6.4% 819 Relatives 1,818 4 8% 587 Nonrelatives 647 1.7% 368 In Female Householder-No Spouse Present-Family 4,882 12 8% 1,339 Relatives 4,450 11.6% 1,186 Nonrelatives 432 1 1% 279 In Nonfamily Households 7,277 19 0% 1,073 Source: U.S. Census Bureau, 2017-2021 American Community Survey Reliability: high medium low March 07, 2024 ©2024 Esri Page 18 of 24
ACS Population Summary

2487 SW Yew Ave, Redmond, Oregon, 97756 Prepared by Esri Ring: 5 mile radius Latitude: 44.24442 Longitude: -121.19662 2017-2021 ACS Estimate Percent MOE(±) Reliability POPULATION AGE 5+ YEARS BY LANGUAGE SPOKEN AT HOME AND ABILITY TO SPEAK ENGLISH Total 36,487 100.0% 2,313 5 to 17 years Speak only English 5,458 15 0% 896 Speak Spanish 957 2.6% 464 Speak English "very well" or "well" 845 2.3% 430 Speak English "not well" 112 0.3% 113 Speak English "not at all" 0 0 0% 0 Speak other Indo-European languages 7 0.0% 8 Speak English "very well" or "well" 7 0.0% 8 Speak English "not well" 0 0.0% 0 Speak English "not at all" 0 0 0% 0 Speak Asian and Pacific Island languages 19 0.1% 35 Speak English "very well" or "well" 0 0.0% 0 Speak English "not well" 19 0.1% 35 Speak English "not at all" 0 0 0% 0 Speak other languages 0 0.0% 0 Speak English "very well" or "well" 0 0.0% 0 Speak English "not well" 0 0.0% 0 Speak English "not at all" 0 0 0% 0 18 to 64 years Speak only English 20,763 56.9% 1,606 Speak Spanish 2,178 6.0% 631 Speak English "very well" or "well" 1,520 4 2% 522 Speak English "not well" 560 1.5% 336 Speak English "not at all" 98 0 3% 122 Speak other Indo-European languages 381 1.0% 230 Speak English "very well" or "well" 381 1 0% 229 Speak English "not well" 0 0.0% 0 Speak English "not at all" 0 0 0% 0 Speak Asian and Pacific Island languages 114 0.3% 84 Speak English "very well" or "well" 97 0.3% 73 Speak English "not well" 17 0.0% 27 Speak English "not at all" 0 0 0% 0 Speak other languages 0 0.0% 0 Speak English "very well" or "well" 0 0.0% 0 Speak English "not well" 0 0.0% 0 Speak English "not at all" 0 0 0% 0 65 years and over Speak only English 6,139 16 8% 683 Speak Spanish 202 0.6% 148 Speak English "very well" or "well" 114 0 3% 117 Speak English "not well" 37 0.1% 49 Speak English "not at all" 52 0 1% 78 Speak other Indo-European languages 191 0.5% 204 Speak English "very well" or "well" 190 0 5% 210 Speak English "not well" 1 0.0% 5 Speak English "not at all" 0 0 0% 0 Speak Asian and Pacific Island languages 77 0.2% 86 Speak English "very well" or "well" 53 0.1% 77 Speak English "not well" 24 0.1% 38 Speak English "not at all" 0 0 0% 0 Speak other languages 0 0.0% 0 Speak English "very well" or "well" 0 0.0% 0 Speak English "not well" 0 0.0% 0 Speak English "not at all" 0 0 0% 0 Source: U.S. Census Bureau, 2017-2021 American Community Survey Reliability: high medium low March 07, 2024 ©2024 Esri Page 19 of 24
ACS Population Summary

ACS Population Summary
2487 SW Yew Ave, Redmond, Oregon, 97756 Prepared by Esri Ring: 5 mile radius Latitude: 44.24442 Longitude: -121.19662 2017-2021 ACS Estimate Percent MOE(±) Reliability WORKERS AGE 16+ YEARS BY PLACE OF WORK Total 18,553 100.0% 1,467 Worked in state and in county of residence 17,180 92.6% 1,449 Worked in state and outside county of residence 1,180 6 4% 370 Worked outside state of residence 193 1.0% 114 SEX BY CLASS OF WORKER FOR THE CIVILIAN EMPLOYED POPULATION 16 YEARS AND OVER Total: 18,961 100.0% 1,488 Male: 9,727 51 3% 900 Employee of private company workers 6,778 35 7% 837 Self-employed in own incorporated business workers 910 4.8% 295 Private not-for-profit wage and salary workers 347 1.8% 168 Local government workers 286 1.5% 142 State government workers 230 1 2% 123 Federal government workers 250 1.3% 146 Self-employed in own not incorporated business workers 924 4 9% 406 Unpaid family workers 3 0.0% 23 Female: 9,234 48 7% 890 Employee of private company workers 5,675 29 9% 817 Self-employed in own incorporated business workers 573 3 0% 191 Private not-for-profit wage and salary workers 1,227 6.5% 306 Local government workers 886 4.7% 316 State government workers 192 1.0% 121 Federal government workers 102 0 5% 84 Self-employed in own not incorporated business workers 564 3.0% 215 Unpaid family workers 15 0 1% 23 POPULATION IN HOUSEHOLDS AND PRESENCE OF A COMPUTER Total 38,248 100.0% 2,423 Population <18 in Households 8,427 22 0% 1,073 Have a Computer 8,313 21 7% 1,073 Have NO Computer 114 0.3% 149 Population 18-64 in Households 23,334 61 0% 1,705 Have a Computer 23,015 60 2% 1,714 Have NO Computer 319 0.8% 191 Population 65+ in Households 6,488 17 0% 710 Have a Computer 6,000 15.7% 638 Have NO Computer 488 1 3% 341 HOUSEHOLDS AND INTERNET SUBSCRIPTIONS Total 15,035 100.0% 857 With an Internet Subscription 13,809 91.8% 804 Dial-Up Alone 84 0 6% 82 Broadband 11,087 73 7% 813 Satellite Service 1,472 9 8% 365 Other Service 78 0 5% 59 Internet Access with no Subscription 170 1.1% 88 With No Internet Access 1,055 7 0% 407 Source: U.S. Census Bureau, 2017-2021 American Community Survey Reliability: high medium low March 07, 2024 ©2024 Esri Page 20 of 24

ACS Population Summary
2487 SW Yew Ave, Redmond, Oregon, 97756 Prepared
Esri Ring: 5 mile radius Latitude: 44.24442 Longitude: -121.19662 2017-2021 ACS Estimate Percent MOE(±) Reliability WORKERS AGE 16+ YEARS BY MEANS OF TRANSPORTATION TO WORK Total 18,553 100.0% 1,467 Drove alone 14,004 75 5% 1,349 Carpooled 1,726 9 3% 361 Public transportation (excluding taxicab) 134 0.7% 131 Bus or trolley bus 134 0 7% 131 Light rail, streetcar or trolley 0 0.0% 0 Subway or elevated 0 0.0% 0 Long-distance/Commuter Train 0 0.0% 0 Ferryboat 0 0.0% 0 Taxicab 57 0.3% 81 Motorcycle 99 0.5% 124 Bicycle 144 0.8% 167 Walked 312 1 7% 149 Other means 223 1.2% 232 Worked at home 1,853 10 0% 433 WORKERS AGE 16+ YEARS (WHO DID NOT WORK FROM HOME) BY TRAVEL TIME TO WORK Total 16,700 100.0% 1,391 Less than 5 minutes 902 5.4% 305 5 to 9 minutes 2,712 16.2% 551 10 to 14 minutes 2,902 17 4% 622 15 to 19 minutes 1,453 8 7% 329 20 to 24 minutes 2,312 13 8% 578 25 to 29 minutes 2,175 13 0% 721 30 to 34 minutes 2,646 15.8% 470 35 to 39 minutes 403 2 4% 170 40 to 44 minutes 441 2.6% 157 45 to 59 minutes 370 2 2% 154 60 to 89 minutes 194 1.2% 136 90 or more minutes 191 1 1% 120 Average Travel Time to Work (in minutes) N/A N/A FEMALES AGE 20-64 YEARS BY AGE OF OWN CHILDREN AND EMPLOYMENT STATUS Total 11,825 100.0% 967 Own children under 6 years only 1,192 10.1% 414 In labor force 992 8 4% 387 Not in labor force 200 1.7% 153 Own children under 6 years and 6 to 17 years 689 5 8% 291 In labor force 433 3.7% 226 Not in labor force 256 2 2% 185 Own children 6 to 17 years only 2,282 19.3% 498 In labor force 1,877 15 9% 464 Not in labor force 405 3.4% 179 No own children under 18 years 7,662 64 8% 848 In labor force 5,938 50.2% 799 Not in labor force 1,724 14 6% 329 Source: U.S. Census Bureau, 2017-2021 American Community Survey Reliability: high medium low March 07, 2024 ©2024 Esri Page 21 of 24
by

ACS Population Summary
2487 SW Yew Ave, Redmond, Oregon, 97756 Prepared by Esri Ring: 5 mile radius Latitude: 44.24442 Longitude: -121.19662 2017-2021 ACS Estimate Percent MOE(±) Reliability CIVILIAN NONINSTITUTIONALIZED POPULATION BY AGE & TYPES OHEALINSURANCE COVERAGE OF HEALTH INSURANCE COVERAGE Total 38,422 100.0% 2,429 Under 19 years: 9,017 23 5% 1,116 One Type of Health Insurance: 8,288 21 6% 1,073 Employer-Based Health Ins Only 2,835 7.4% 654 Direct-Purchase Health Ins Only 694 1 8% 430 Medicare Coverage Only 0 0.0% 0 Medicaid Coverage Only 4,582 11 9% 880 TRICARE/Military Hlth Cov Only 177 0.5% 159 VA Health Care Only 0 0.0% 0 2+ Types of Health Insurance 585 1.5% 290 No Health Insurance Coverage 143 0.4% 114 19 to 34 years: 7,520 19.6% 1,049 One Type of Health Insurance: 5,999 15.6% 831 Employer-Based Health Ins Only 3,964 10 3% 679 Direct-Purchase Health Ins Only 536 1 4% 323 Medicare Coverage Only 0 0.0% 0 Medicaid Coverage Only 1,397 3 6% 411 TRICARE/Military Hlth Cov Only 90 0.2% 64 VA Health Care Only 13 0 0% 19 2+ Types of Health Insurance 781 2.0% 361 No Health Insurance Coverage 739 1 9% 324 35 to 64 years: 15,310 39 8% 1,369 One Type of Health Insurance: 11,079 28 8% 1,170 Employer-Based Health Ins Only 7,203 18 7% 1,029 Direct-Purchase Health Ins Only 1,670 4 3% 476 Medicare Coverage Only 215 0.6% 112 Medicaid Coverage Only 1,790 4 7% 439 TRICARE/Military Hlth Cov Only 107 0.3% 78 VA Health Care Only 93 0 2% 74 2+ Types of Health Insurance 2,414 6.3% 574 No Health Insurance Coverage 1,817 4.7% 535 65+ years: 6,576 17.1% 714 One Type of Health Insurance: 2,397 6.2% 526 Employer-Based Health Ins Only 98 0.3% 69 Direct-Purchase Health Ins Only 3 0.0% 20 Medicare Coverage Only 2,297 6.0% 523 TRICARE/Military Hlth Cov Only 0 0 0% 0 VA Health Care Only 0 0.0% 0 2+ Types of Health Insurance: 4,172 10 9% 528 Employer-Based & Direct-Purchase Health Insurance 0 0.0% 0 Employer-Based Health & Medicare Insurance 684 1 8% 205 Direct-Purchase Health & Medicare Insurance 1,829 4.8% 427 Medicare & Medicaid Coverage 321 0 8% 160 Other Private Health Insurance Combos 0 0.0% 0 Other Public Health Insurance Combos 90 0.2% 58 Other Health Insurance Combinations 1,247 3.2% 274 No Health Insurance Coverage 7 0.0% 13 Source: U.S. Census Bureau, 2017-2021 American Community Survey Reliability: high medium low March 07, 2024 ©2024 Esri Page 22 of 24

ACS Population Summary
2487 SW Yew Ave, Redmond, Oregon, 97756
Ring: 5 mile radius Latitude:
Longitude:
2017-2021 ACS Estimate Percent MOE(±) Reliability POPULATION BY RATIO OF INCOME TO POVERTY LEVEL Total 38,162 100.0% 2,427 Under 50 1,455 3.8% 440 50 to 99 1,892 5 0% 555 1 00 to 1 24 1,529 4.0% 720 1 25 to 1 49 2,903 7 6% 1,164 1 50 to 1 84 2,602 6.8% 950 1 85 to 1 99 738 1 9% 534 2 00 and over 27,043 70 9% 2,233 CIVILIAN POPULATION AGE 18 OR OLDER BY VETERAN STATUS Total 30,035 100.0% 1,758 Veteran 2,624 8.7% 446 Nonveteran 27,411 91.3% 1,653 Male 13,872 46 2% 980 Veteran 2,398 8 0% 424 Nonveteran 11,474 38 2% 929 Female 16,163 53.8% 1,089 Veteran 226 0.8% 132 Nonveteran 15,937 53 1% 1,086 CIVILIAN VETERANS AGE 18 OR OLDER BY PERIOD OF MILITARY SERVICE Total 2,625 100.0% 446 Gulf War (9/01 or later), no Gulf War (8/90 to 8/01), no Vietnam Era 503 19 2% 301 Gulf War (9/01 or later) and Gulf War (8/90 to 8/01), no Vietnam Era 65 2.5% 45 Gulf War (9/01 or later), and Gulf War (8/90 to 8/01), and Vietnam Era 0 0.0% 0 Gulf War (8/90 to 8/01), no Vietnam Era 257 9.8% 137 Gulf War (8/90 to 8/01) and Vietnam Era 7 0.3% 20 Vietnam Era, no Korean War, no World War II 935 35 6% 230 Vietnam Era and Korean War, no World War II 3 0.1% 20 Vietnam Era and Korean War and World War II 0 0.0% 0 Korean War, no Vietnam Era, no World War II 106 4.0% 54 Korean War and World War II, no Vietnam Era 0 0 0% 0 World War II, no Korean War, no Vietnam Era 35 1.3% 60 Between Gulf War and Vietnam Era only 541 20 6% 199 Between Vietnam Era and Korean War only 173 6.6% 72 Between Korean War and World War II only 0 0.0% 0 Pre-World War II only 0 0.0% 0 HOUSEHOLDS BY POVERTY STATUS Total 15,035 100.0% 857 Income in the past 12 months below poverty level 1,361 9.1% 321 Married-couple family 211 1 4% 85 Other family - male householder (no wife present) 137 0.9% 123 Other family - female householder (no husband present) 220 1 5% 111 Nonfamily household - male householder 278 1.8% 173 Nonfamily household - female householder 514 3.4% 202 Income in the past 12 months at or above poverty level 13,674 90 9% 862 Married-couple family 7,245 48 2% 706 Other family - male householder (no wife present) 573 3.8% 217 Other family - female householder (no husband present) 1,397 9.3% 455 Nonfamily household - male householder 1,605 10.7% 363 Nonfamily household - female householder 2,856 19 0% 552 Poverty Index 73 Source: U.S. Census Bureau, 2017-2021 American Community Survey Reliability: high medium low March 07, 2024 ©2024 Esri Page 23 of 24
Prepared by Esri
44.24442
-121.19662

ACS Population Summary
44.24442
Data Note: N/A means not available Population by Ratio of Income to Poverty Level represents persons for whom poverty status is determined. Household income represents income in 2021, adjusted for inflation
2017-2021 ACS Estimate: The American Community Survey (ACS) replaces census sample data. Esri is releasing the 2017-2021 ACS estimates, five-year period data collected monthly from January 1, 2017 through December 31, 2021. Although the ACS includes many of the subjects previously covered by the decennial census sample, there are significant differences between the two surveys including fundamental differences in survey design and residency rules
Margin of error (MOE): The MOE is a measure of the variability of the estimate due to sampling error. MOEs enable the data user to measure the range of uncertainty for each estimate with 90 percent confidence. The range of uncertainty is called the confidence interval, and it is calculated by taking the estimate +/- the MOE. For example, if the ACS reports an estimate of 100 with an MOE of +/- 20, then you can be 90 percent certain the value for the whole population falls between 80 and 120.
Reliability: These symbols represent threshold values that Esri has established from the Coefficients of Variation (CV) to designate the usability of the estimates. The CV measures the amount of sampling error relative to the size of the estimate, expressed as a percentage
High Reliability: Small CVs (less than or equal to 12 percent) are flagged green to indicate that the sampling error is small relative to the estimate and the estimate is reasonably reliable.
Medium Reliability: Estimates with CVs between 12 and 40 are flagged yellow-use with caution.
Low Reliability: Large CVs (over 40 percent) are flagged red to indicate that the sampling error is large relative to the estimate. The estimate is considered very unreliable.
Source: U.S. Census Bureau, 2017-2021 American Community Survey
Reliability: high medium low
SW Yew Ave, Redmond,
97756
Ring: 5 mile radius Latitude:
Longitude:
2017-2021 ACS Estimate Percent MOE(±) Reliability HOUSEHOLDS BY OTHER INCOME Social Security Income 5,413 36 0% 612 No Social Security Income 9,622 64.0% 779 Retirement Income 3,246 21 6% 397 No Retirement Income 11,789 78 4% 868 GROSS RENT AS A PERCENTAGE OF HOUSEHOLD INCOME IN THE PAST 12 MONTHS <10% of Income 158 3 3% 125 10-14 9% of Income 439 9.2% 226 15-19 9% of Income 629 13 2% 246 20-24 9% of Income 489 10 2% 214 25-29.9% of Income 517 10.8% 224 30-34 9% of Income 324 6.8% 152 35-39 9% of Income 446 9 3% 277 40-49 9% of Income 499 10 4% 251 50+% of Income 1,156 24 2% 396 Gross Rent % Inc Not Computed 124 2.6% 78 HOUSEHOLDS BY PUBLIC ASSISTANCE INCOME IN THE PAST 12 MONTHS Total 15,035 100.0% 857 With public assistance income 470 3.1% 177 No public assistance income 14,565 96.9% 858 HOUSEHOLDS BY FOOD STAMPS/SNAP STATUS Total 15,035 100.0% 857 With Food Stamps/SNAP 2,168 14.4% 393 With No Food Stamps/SNAP 12,867 85.6% 859 HOUSEHOLDS BY DISABILITY STATUS Total 15,035 100.0% 857 With 1+ Persons w/Disability 4,341 28.9% 624 With No Person w/Disability 10,694 71.1% 846
2487
Oregon,
Prepared by Esri
-121.19662
March 07, 2024 ©2024 Esri Page 24 of 24

Market Profile
Data Note: Household population includes persons not residing in group quarters Average Household Size is the household population divided by total households Persons in families include the householder and persons related to the householder by birth, marriage, or adoption. Per Capita Income represents the income received by all persons aged 15 years and over divided by the total population.
Source: Esri forecasts for 2023 and 2028. U.S. Census Bureau 2000 and 2010 decennial Census data converted by Esri into 2020 geography.
2487 SW Yew Ave, Redmond, Oregon, 97756 Prepared by Esri Rings: 1, 3, 5 mile radii Latitude: 44.24442 Longitude: -121.19662 1 mile 3 miles 5 miles Population Summary 2010 Total Population 5,803 21,546 30,721 2020 Total Population 7,226 27,411 38,712 2020 Group Quarters 26 79 157 2023 Total Population 7,793 30,047 42,308 2023 Group Quarters 26 79 157 2028 Total Population 8,223 31,460 44,292 2023-2028 Annual Rate 1.08% 0.92% 0.92% 2023 Total Daytime Population 6,290 27,645 39,529 Workers 1,898 12,244 17,273 Residents 4,392 15,401 22,256 Household Summary 2010 Households 2,306 8,339 11,852 2010 Average Household Size 2.45 2.55 2.57 2020 Total Households 2,906 10,571 14,942 2020 Average Household Size 2.48 2.59 2.58 2023 Households 3,115 11,648 16,357 2023 Average Household Size 2.49 2.57 2.58 2028 Households 3,312 12,286 17,244 2028 Average Household Size 2.47 2.55 2.56 2023-2028 Annual Rate 1.23% 1.07% 1.06% 2010 Families 1,520 5,574 8,217 2010 Average Family Size 2.93 3.03 3.00 2023 Families 1,977 7,578 11,022 2023 Average Family Size 3.05 3.10 3.06 2028 Families 2,090 7,946 11,561 2028 Average Family Size 3.03 3.08 3.04 2023-2028 Annual Rate 1.12% 0.95% 0.96% Housing Unit Summary 2000 Housing Units 1,737 5,908 8,190 Owner Occupied Housing Units 58.8% 60.4% 63.8% Renter Occupied Housing Units 35.7% 34.1% 29.3% Vacant Housing Units 5.5% 5.5% 6.9% 2010 Housing Units 2,531 9,210 13,600 Owner Occupied Housing Units 49.9% 49.7% 52.5% Renter Occupied Housing Units 41.2% 40.9% 34.7% Vacant Housing Units 8.9% 9.5% 12.9% 2020 Housing Units 3,087 11,139 16,159 Owner Occupied Housing Units 56.1% 58.0% 61.4% Renter Occupied Housing Units 38.1% 36.9% 31.1% Vacant Housing Units 6.1% 5.2% 7.4% 2023 Housing Units 3,397 12,306 17,647 Owner Occupied Housing Units 56.9% 60.6% 63.5% Renter Occupied Housing Units 34.8% 34.0% 29.2% Vacant Housing Units 8.3% 5.3% 7.3% 2028 Housing Units 3,576 12,867 18,456 Owner Occupied Housing Units 56.9% 61.6% 64.6% Renter Occupied Housing Units 35.7% 33.9% 28.9% Vacant Housing Units 7.4% 4.5% 6.6%
March 07, 2024 ©2024 Esri Page 1 of 8

Market Profile
2487 SW Yew Ave, Redmond, Oregon, 97756
Rings: 1, 3, 5 mile
Prepared by Esri
Latitude: 44.24442
Longitude: -121.19662
Data Note: Income represents the preceding year, expressed in current dollars Household income includes wage and salary earnings, interest dividends, net rents, pensions, SSI and welfare payments, child support, and alimony.
Source: Esri forecasts for 2023 and 2028. U.S. Census Bureau 2000 and 2010 decennial Census data converted by Esri into 2020 geography.
radii
1 mile 3 miles 5 miles 2023 Households by Income Household Income Base 3,115 11,648 16,357 <$15,000 10.2% 7.2% 6.8% $15,000 - $24,999 7.4% 6.3% 5.6% $25,000 - $34,999 5.5% 5.1% 5.1% $35,000 - $49,999 11.4% 12.9% 13.6% $50,000 - $74,999 16.5% 18.7% 17.9% $75,000 - $99,999 23.1% 19.3% 18.4% $100,000 - $149,999 18.9% 22.0% 21.8% $150,000 - $199,999 4.0% 6.0% 6.5% $200,000+ 3.0% 2.4% 4.3% Average Household Income $81,875 $85,071 $91,764 2028 Households by Income Household Income Base 3,312 12,286 17,244 <$15,000 8.8% 6.3% 5.9% $15,000 - $24,999 5.2% 4.5% 4.1% $25,000 - $34,999 4.5% 4.0% 3.8% $35,000 - $49,999 10.3% 11.4% 11.3% $50,000 - $74,999 15.7% 17.2% 16.2% $75,000 - $99,999 24.0% 19.7% 18.8% $100,000 - $149,999 21.9% 25.2% 25.1% $150,000 - $199,999 5.7% 8.5% 9.2% $200,000+ 3.9% 3.2% 5.6% Average Household Income $94,165 $97,566 $106,542 2023 Owner Occupied Housing Units by Value Total 1,934 7,460 11,211 <$50,000 4.8% 2.5% 2.4% $50,000 - $99,999 1.8% 4.2% 2.9% $100,000 - $149,999 0.5% 1.6% 1.2% $150,000 - $199,999 1.7% 3.8% 2.9% $200,000 - $249,999 1.4% 3.5% 2.7% $250,000 - $299,999 3.5% 5.2% 4.5% $300,000 - $399,999 8.2% 13.6% 12.1% $400,000 - $499,999 34.7% 22.5% 24.9% $500,000 - $749,999 40.7% 37.2% 37.2% $750,000 - $999,999 2.1% 4.8% 6.1% $1,000,000 - $1,499,999 0.4% 0.5% 2.2% $1,500,000 - $1,999,999 0.3% 0.5% 0.8% $2,000,000 + 0.0% 0.0% 0.1% Average Home Value $485,554 $474,534 $512,248 2028 Owner Occupied Housing Units by Value Total 2,034 7,923 11,917 <$50,000 0.1% 0.1% 0.2% $50,000 - $99,999 0.0% 1.0% 0.7% $100,000 - $149,999 0.0% 0.0% 0.0% $150,000 - $199,999 0.0% 0.2% 0.1% $200,000 - $249,999 0.0% 0.3% 0.2% $250,000 - $299,999 0.0% 0.3% 0.2% $300,000 - $399,999 1.0% 12.4% 9.6% $400,000 - $499,999 33.9% 25.8% 27.5% $500,000 - $749,999 60.3% 49.9% 48.4% $750,000 - $999,999 3.0% 7.2% 7.7% $1,000,000 - $1,499,999 0.8% 1.1% 3.6% $1,500,000 - $1,999,999 0.9% 1.5% 1.7% $2,000,000 + 0.0% 0.1% 0.1% Average Home Value $585,491 $580,262 $606,597
March 07, 2024 ©2024 Esri Page 2 of 8

Market Profile
2487 SW Yew Ave, Redmond, Oregon, 97756
Rings: 1, 3, 5 mile radii
Prepared by Esri
Latitude: 44.24442
Longitude: -121.19662
Source: Esri forecasts for 2023 and 2028. U.S. Census Bureau 2000 and 2010 decennial Census data converted by Esri into 2020 geography.
1 mile 3 miles
Median Household Income 2023 $72,824 $74,500 $75,964 2028 $79,065 $81,512 $84,469 Median Home Value 2023 $480,999 $469,272 $485,561 2028 $562,449 $549,564 $559,410 Per Capita Income 2023 $32,498 $32,937 $35,427 2028 $37,651 $38,055 $41,421 Median Age 2010 37.7 34.6 36.4 2020 39.0 37.2 39.1 2023 39.6 37.1 38.5 2028 39.4 37.4 38.7 2020 Population by Age Total 7,226 27,411 38,712 0 - 4 5.8% 6.4% 5.9% 5 - 9 6.4% 6.6% 6.3% 10 - 14 6.8% 6.8% 6.6% 15 - 24 11.1% 11.8% 11.4% 25 - 34 14.3% 15.0% 13.9% 35 - 44 12.6% 13.5% 13.1% 45 - 54 11.0% 11.4% 11.2% 55 - 64 12.0% 11.6% 12.2% 65 - 74 11.9% 10.1% 11.6% 75 - 84 5.7% 4.9% 5.9% 85 + 2.3% 1.8% 1.9% 18 + 77.6% 76.4% 77.3% 2023 Population by Age Total 7,794 30,047 42,308 0 - 4 6.2% 6.7% 6.4% 5 - 9 6.3% 6.9% 6.7% 10 - 14 6.1% 6.7% 6.7% 15 - 24 11.7% 12.4% 12.1% 25 - 34 14.0% 14.3% 13.3% 35 - 44 12.1% 13.6% 13.3% 45 - 54 11.1% 11.7% 11.8% 55 - 64 11.5% 11.1% 11.8% 65 - 74 11.4% 9.7% 10.6% 75 - 84 6.9% 5.2% 5.4% 85 + 2.7% 1.9% 1.8% 18 + 78.0% 75.9% 76.3%
Population by Age Total 8,222 31,460 44,293 0 - 4 6.4% 6.8% 6.5% 5 - 9 6.3% 6.8% 6.6% 10 - 14 6.4% 7.0% 6.9% 15 - 24 10.9% 12.1% 11.7% 25 - 34 13.8% 13.9% 13.3% 35 - 44 13.0% 13.9% 13.3% 45 - 54 10.9% 11.4% 11.7% 55 - 64 10.8% 10.4% 11.0% 65 - 74 10.8% 9.6% 10.6% 75 - 84 7.7% 6.0% 6.3% 85 + 3.0% 2.1% 2.1% 18 + 77.5% 75.6% 76.1%
by
5 miles
2028
2020 Population
Sex
March
©2024 Esri Page 3 of 8
07, 2024

Market Profile
2487 SW Yew Ave, Redmond, Oregon, 97756
Rings: 1, 3, 5 mile radii
Prepared by Esri
Latitude: 44.24442
Longitude: -121.19662
Data Note: Persons of Hispanic Origin may be of any race. The Diversity Index measures the probability that two people from the same area will be from different race/ethnic groups
Source: Esri forecasts for 2023 and 2028. U.S. Census Bureau 2000 and 2010 decennial Census data converted by Esri into 2020 geography.
1 mile 3 miles 5 miles Males 3,562 13,395 18,959 Females 3,664 14,016 19,753
Population by
Males 3,760 14,693 20,734 Females 4,033 15,354 21,574 2028 Population by Sex Males 3,948 15,349 21,650 Females 4,275 16,111 22,642 2010 Population by Race/Ethnicity Total 5,803 21,546 30,719 White Alone 88.6% 89.1% 90.0% Black Alone 0.3% 0.4% 0.4% American Indian Alone 1.2% 1.3% 1.2% Asian Alone 0.5% 0.7% 0.7% Pacific Islander Alone 0.1% 0.2% 0.2% Some Other Race Alone 6.4% 5.4% 4.8% Two or More Races 2.8% 3.0% 2.8% Hispanic Origin 12.6% 12.3% 11.1% Diversity Index 38.4 37.4 34.6 2020 Population by Race/Ethnicity Total 7,226 27,411 38,712 White Alone 82.1% 81.5% 82.5% Black Alone 0.6% 0.6% 0.5% American Indian Alone 0.9% 1.1% 1.1% Asian Alone 1.5% 1.2% 1.1% Pacific Islander Alone 0.1% 0.2% 0.2% Some Other Race Alone 5.0% 5.5% 5.2% Two or More Races 9.7% 10.0% 9.5% Hispanic Origin 13.1% 13.7% 12.7% Diversity Index 47.0 48.3 46.1 2023 Population by Race/Ethnicity Total 7,793 30,047 42,308 White Alone 81.4% 80.6% 81.6% Black Alone 0.6% 0.5% 0.5% American Indian Alone 0.9% 1.2% 1.1% Asian Alone 1.5% 1.3% 1.2% Pacific Islander Alone 0.1% 0.2% 0.2% Some Other Race Alone 5.3% 5.9% 5.5% Two or More Races 10.2% 10.4% 10.0% Hispanic Origin 13.8% 14.6% 13.6% Diversity Index 48.5 50.1 48.0 2028 Population by Race/Ethnicity Total 8,224 31,460 44,293 White Alone 80.2% 79.3% 80.4% Black Alone 0.5% 0.5% 0.5% American Indian Alone 1.0% 1.2% 1.1% Asian Alone 1.6% 1.3% 1.2% Pacific Islander Alone 0.1% 0.2% 0.2% Some Other Race Alone 5.7% 6.4% 6.0% Two or More Races 10.8% 11.1% 10.6% Hispanic Origin 14.8% 15.6% 14.5% Diversity Index 50.8 52.4 50.2
2023
Sex
March
2024 ©2024 Esri Page 4 of 8
07,

Market Profile
2487 SW Yew Ave, Redmond, Oregon, 97756
Rings: 1, 3, 5 mile radii
Prepared by Esri
Latitude: 44.24442
Longitude: -121.19662
1 mile 3 miles 5 miles
Population by Relationship and Household Type Total 7,226 27,411 38,712 In Households 99.6% 99.7% 99.6% Householder 40.0% 38.6% 38.6% Opposite-Sex Spouse 18.8% 18.5% 19.9% Same-Sex Spouse 0.2% 0.2% 0.2% Opposite-Sex Unmarried Partner 3.3% 3.6% 3.2% Same-Sex Unmarried Partner 0.1% 0.1% 0.1% Biological Child 24.5% 26.0% 25.2% Adopted Child 0.6% 0.6% 0.7% Stepchild 1.4% 1.4% 1.3% Grandchild 1.8% 1.9% 2.0% Brother or Sister 1.0% 1.0% 0.9% Parent 1.0% 1.0% 1.1% Parent-in-law 0.4% 0.3% 0.4% Son-in-law or Daughter-in-law 0.5% 0.5% 0.5% Other Relatives 1.1% 1.1% 1.1% Foster Child 0.1% 0.1% 0.1% Other Nonrelatives 4.9% 4.7% 4.4% In Group Quaters 0.4% 0.3% 0.4% Institutionalized 0.3% 0.1% 0.2% Noninstitutionalized 0.1% 0.1% 0.2% 2023 Population 25+ by Educational Attainment Total 5,426 20,214 28,806 Less than 9th Grade 6.2% 3.7% 3.0% 9th - 12th Grade, No Diploma 5.5% 6.0% 5.3% High School Graduate 29.2% 23.5% 22.8% GED/Alternative Credential 3.6% 3.8% 3.7% Some College, No Degree 24.6% 24.1% 25.4% Associate Degree 11.6% 12.9% 11.7% Bachelor's Degree 15.6% 18.4% 20.1% Graduate/Professional Degree 3.8% 7.6% 8.0% 2023 Population 15+ by Marital Status Total 6,341 23,950 33,944 Never Married 24.2% 30.0% 26.6% Married 53.7% 48.8% 52.3% Widowed 9.5% 6.1% 5.9% Divorced 12.6% 15.1% 15.2% 2023 Civilian Population 16+ in Labor Force Civilian Population 16+ 3,884 15,965 21,592 Population 16+ Employed 89.3% 93.4% 94.4% Population 16+ Unemployment rate 10.8% 6.6% 5.6% Population 16-24 Employed 10.5% 12.7% 12.6% Population 16-24 Unemployment rate 39.9% 22.3% 20.0% Population 25-54 Employed 68.8% 68.1% 67.2% Population 25-54 Unemployment rate 3.9% 3.2% 2.5% Population 55-64 Employed 14.9% 14.1% 14.7% Population 55-64 Unemployment rate 13.1% 7.6% 6.2% Population 65+ Employed 5.7% 5.1% 5.4% Population 65+ Unemployment rate 0.0% 0.6% 0.5%
2020
March 07, 2024 ©2024 Esri Page 5 of 8
Source: Esri forecasts for 2023 and 2028. U.S. Census Bureau 2000 and 2010 decennial Census data converted by Esri into 2020 geography.

Market
Prepared by Esri Rings: 1, 3, 5
Latitude: 44.24442
Longitude: -121.19662
Source: Esri forecasts for 2023 and 2028. U.S. Census Bureau 2000 and 2010 decennial Census data converted by Esri into 2020 geography.
Ave,
Profile 2487 SW Yew
Redmond, Oregon, 97756
mile radii
1 mile 3 miles 5 miles 2023 Employed Population 16+ by Industry Total 3,467 14,908 20,388 Agriculture/Mining 1.4% 1.0% 1.4% Construction 14.2% 13.7% 12.9% Manufacturing 11.7% 6.1% 5.7% Wholesale Trade 0.8% 2.2% 1.8% Retail Trade 19.0% 15.3% 14.5% Transportation/Utilities 2.1% 5.5% 5.9% Information 0.2% 0.8% 1.0% Finance/Insurance/Real Estate 1.7% 2.7% 3.3% Services 46.9% 49.8% 50.5% Public Administration 2.1% 2.9% 2.9% 2023 Employed Population 16+ by Occupation Total 3,467 14,911 20,389 White Collar 51.8% 56.0% 57.8% Management/Business/Financial 14.2% 15.4% 15.9% Professional 17.3% 18.5% 19.6% Sales 9.0% 9.6% 10.0% Administrative Support 11.3% 12.5% 12.4% Services 20.8% 20.0% 18.5% Blue Collar 27.4% 24.0% 23.7% Farming/Forestry/Fishing 0.3% 0.2% 0.2% Construction/Extraction 7.4% 7.9% 7.6% Installation/Maintenance/Repair 3.4% 2.1% 2.8% Production 5.7% 3.7% 3.8% Transportation/Material Moving 10.7% 10.0% 9.3% 2020 Households by Type Total 2,906 10,571 14,942 Married Couple Households 48.3% 48.4% 52.2% With Own Children <18 16.5% 19.0% 18.9% Without Own Children <18 31.8% 29.4% 33.3% Cohabitating Couple Households 8.5% 9.5% 8.6% With Own Children <18 3.0% 3.3% 2.9% Without Own Children <18 5.5% 6.2% 5.7% Male Householder, No Spouse/Partner 16.9% 16.1% 15.2% Living Alone 10.8% 9.9% 9.3% 65 Years and over 4 7% 3 9% 3 7% With Own Children <18 1.3% 1.7% 1.6% Without Own Children <18, With Relatives 2.3% 2.4% 2.4% No Relatives Present 2.3% 2.1% 1.9% Female Householder, No Spouse/Partner 26.3% 26.0% 24.0% Living Alone 14.8% 14.0% 13.0% 65 Years and over 9.0% 7.9% 7.6% With Own Children <18 5.0% 5.0% 4.4% Without Own Children <18, With Relatives 5.2% 5.6% 5.3% No Relatives Present 1.3% 1.4% 1.3% 2020 Households by Size Total 2,906 10,571 14,942 1 Person Household 25.6% 23.9% 22.3% 2 Person Household 36.5% 35.1% 37.8% 3 Person Household 16.3% 16.4% 16.1% 4 Person Household 11.5% 13.8% 13.4% 5 Person Household 6.7% 6.7% 6.4% 6 Person Household 2.2% 2.6% 2.6% 7 + Person Household 1.2% 1.4% 1.5%
March 07, 2024 ©2024 Esri Page 6 of 8

Data Note: Households with children include any households with people under age 18, related or not. Multigenerational households are families with 3 or more parent-child relationships. Unmarried partner households are usually classified as nonfamily households unless there is another member of the household related to the householder. Multigenerational and unmarried partner households are reported only to the tract level. Esri estimated block group data, which is used to estimate polygons or non-standard geography.
Source: Esri forecasts for 2023 and 2028. U.S. Census Bureau 2000 and 2010 decennial Census data converted by Esri into 2020 geography.
2487 SW Yew Ave, Redmond, Oregon, 97756 Prepared
Esri Rings: 1, 3, 5 mile radii Latitude: 44.24442 Longitude: -121.19662 1 mile 3 miles 5 miles 2020 Households by Tenure and Mortgage Status Total 2,906 10,571 14,942 Owner Occupied 59.6% 61.1% 66.3% Owned with a Mortgage/Loan 44.3% 46.8% 49.7% Owned Free and Clear 15.3% 14.3% 16.6% Renter Occupied 40.4% 38.9% 33.7% 2023 Affordability, Mortgage and Wealth Housing Affordability Index 62 65 64 Percent of Income for Mortgage 39.7% 37.9% 38.4% Wealth Index 60 59 74 2020 Housing Units By Urban/ Rural Status Total 3,087 11,139 16,159 Urban Housing Units 97.9% 93.7% 81.3% Rural Housing Units 2.1% 6.3% 18.7% 2020 Population By Urban/ Rural Status Total 7,226 27,411 38,712 Urban Population 98.3% 93.5% 84.8% Rural Population 1.7% 6.5% 15.2%
Market Profile
by
March 07, 2024 ©2024 Esri Page 7 of 8

Market Profile
2487 SW Yew Ave, Redmond, Oregon, 97756
Rings: 1, 3, 5 mile radii
Prepared by Esri
Latitude: 44.24442
Longitude: -121.19662 1 mile 3 miles 5 miles
1.
2.
3.
Top 3 Tapestry Segments
Front Porches
Middleburg
Middleburg
(8E)
(4C)
(4C)
Midlife
Urban
Urban
Constants (5E)
Edge Families (7C)
Edge Families (7C)
Middleburg
Front Porches
Front Porches (8E) 2023 Consumer Spending Apparel & Services: Total $ $5,231,244 $20,438,879 $30,567,506 Average Spent $1,679.37 $1,754.71 $1,868.77 Spending Potential Index 76 80 85 Education: Total $ $4,288,493 $15,662,671 $23,436,871 Average Spent $1,376.72 $1,344.67 $1,432.83 Spending Potential Index 77 75 80 Entertainment/Recreation: Total $ $9,053,761 $35,045,794 $53,256,932 Average Spent $2,906.50 $3,008.74 $3,255.91 Spending Potential Index 77 80 86 Food at Home: Total $ $16,440,347 $63,444,276 $95,435,327 Average Spent $5,277.80 $5,446.80 $5,834.53 Spending Potential Index 78 80 86 Food Away from Home: Total $ $8,813,102 $34,903,380 $52,465,719 Average Spent $2,829.25 $2,996.51 $3,207.54 Spending Potential Index 76 80 86 Health Care: Total $ $17,857,552 $69,210,306 $105,700,973 Average Spent $5,732.76 $5,941.82 $6,462.12 Spending Potential Index 78 81 88 HH Furnishings & Equipment: Total $ $7,025,649 $27,549,022 $41,780,680 Average Spent $2,255.43 $2,365.13 $2,554.30 Spending Potential Index 76 80 86 Personal Care Products & Services: Total $ $2,294,486 $8,954,945 $13,513,159 Average Spent $736.59 $768.80 $826.14 Spending Potential Index 77 80 86 Shelter: Total $ $59,574,410 $230,957,123 $347,508,350 Average Spent $19,125.01 $19,828.05 $21,245.24 Spending Potential Index 77 80 86 Support Payments/Cash Contributions/Gifts in Kind: Total $ $7,551,818 $29,197,247 $45,055,133 Average Spent $2,424.34 $2,506.63 $2,754.49 Spending Potential Index 77 80 88 Travel: Total $ $5,329,032 $20,874,598 $31,808,607 Average Spent $1,710.76 $1,792.12 $1,944.65 Spending Potential Index 76 80 86 Vehicle Maintenance & Repairs: Total $ $3,162,796 $12,520,775 $18,928,276 Average Spent $1,015.34 $1,074.93 $1,157.20 Spending Potential Index 77 82 88 Data Note: Consumer spending shows the amount spent on a variety of goods and services by households that reside in the area. Expenditures are shown by broad budget categories that are not mutually exclusive Consumer spending does not equal business revenue. Total and Average Amount Spent Per Household represent annual figures. The Spending Potential Index represents the amount spent in the area relative to a national average of 100 Source: Consumer Spending data are derived from the 2019 and 2020 Consumer Expenditure Surveys, Bureau of Labor Statistics. Esri. Source: Esri forecasts for 2023 and 2028. U.S. Census Bureau 2000 and 2010 decennial Census data converted by Esri into 2020 geography. March 07, 2024 ©2024 Esri Page 8 of 8
(4C)
(8E)

Traffic Count Map
2487 SW Yew Ave, Redmond, Oregon, 97756
Rings: 1, 3, 5 mile radii
Prepared by Esri
Latitude: 44.24442
Longitude: -121.19662
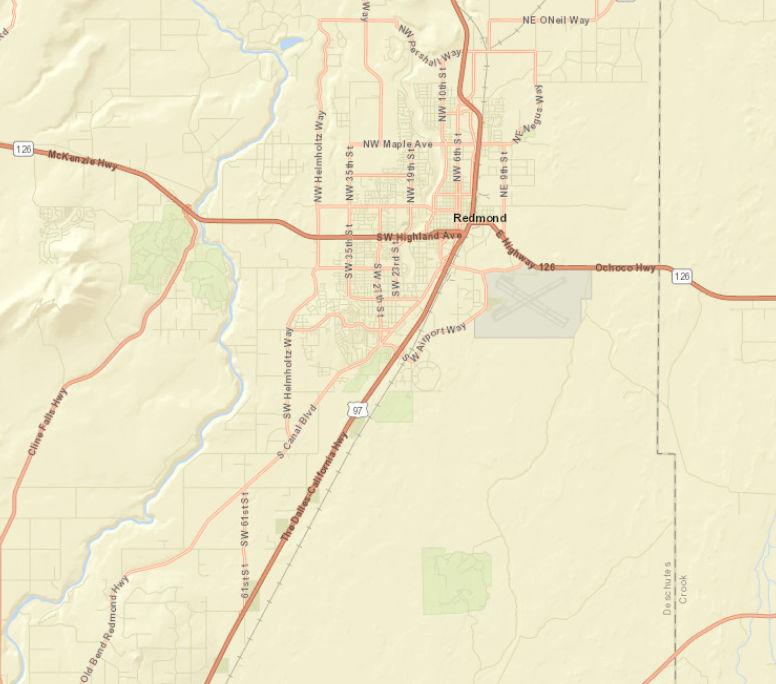
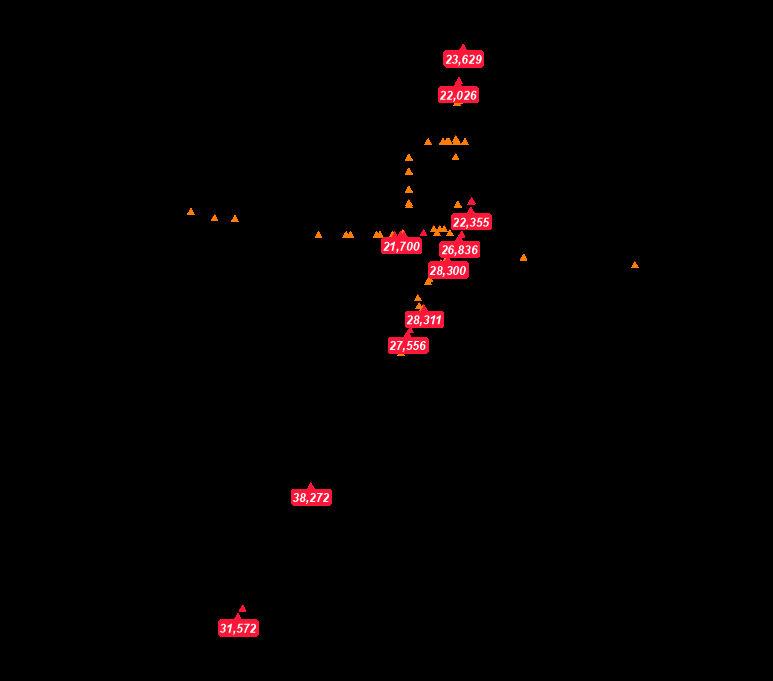
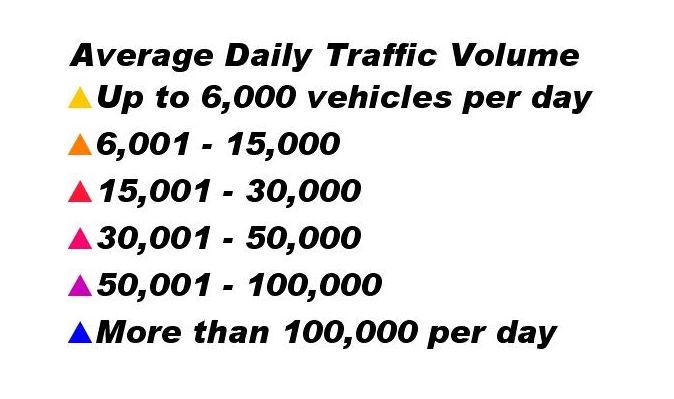
Source:
0 mi
©2023 Kalibrate Technologies (Q4 2023). March 07, 2024 ©2024 Esri Page 1 of 1
and two story buildings and 15 feet from the foundation for three story buildings; and front and rear yards shall be a minimum of 10feet or as approved by the Hearings Body.
6. Height of Buildings. In an Airport Zone or Airport Compatibility Zone, all building shall meet the requirements set forth in the Airport Layout Plan Drawing Set, as amended.
7. Off-Street Parking and Loading. In an Airport Zone or Airport Compatibility Zone, offstreet parking and loading shall be provided subject tothe parking provisions of 8.0500.
[Section 8.0235 amended by Ord. #2020-15 passed November 10, 2020]
[Section 8.0235 amended by Ord. #2023-07 passed December 19, 2023]
MIXED-USE ZONES
8.0250Mixed-Use Neighborhood MUN Zone.
[Section 8.0250 added by Ord. #2009-03 passedMay 26, 2009]
8.0255Mixed-Use Employment MUE Zone.
[Section 8.0255 added by Ord. #2009-14 passedDecember 8, 2009]
8.0256Mixed Use Live/Work Zone (MULW). In a MULW Zone, the following restrictions shall apply:
1. Purpose. The purpose of the MULW zone is to:
A. Provide a mixed-use area that is appropriate for development which may include both living units and workspace;
B. Provide flexibility for the development of live/work units; and,
C. Provide locations, where appropriate, for new businesses to start up and existing businesses to continue and potentially expand.
2. Intent of the Live/Work unit. The Live/Work unit is a combined form of living unit which can provide the necessities and comforts of home and provide a business venue for a source of income to promote the success of the owner and the surrounding area. Tothe extent that they include new construction, the new construction shall be well-designed, architecturally interesting, and made of quality products.
[Section 8.0256 added by Ord. #2011-09 passedNovember 8, 2011]
[Section 8.0256 amended by Ord. #2020-15 passed November 10, 2020]
85
CHAPTER 8 DEVELOPMENT REGULATIONS
8.0260TableG, Uses Permitted. The following land uses are permitted outright or conditionally in each respective Zone as follows:
“O”meansPermittedOutright “C”meansPermittedConditionally “N”meansNotAllowed
86
CHAPTER 8 DEVELOPMENT REGULATIONS
Standard MUN MUE Reference/Standards: Residential Uses:** All stand-aloneresidential
listed
G
MUN. AssistedLivingFacility O O AffordableHousing,containing100% affordabledwellingunits O O BedandBreakfast C N MixedUseWorkforceHousing,containing groundfloorcommercialand100% workforceoraffordabledwellingunits O O Multi-FamilyComplex (5+units) O O SeeRDCSection8.3035,DesignReviewCriteria Residentialuseabovegroundflood(mixeduseunit) O O Live/WorkDwelling O O Seedefinitionsoflive/workhouses,townhousesand apartments,andstandardsinRDCSection8.3035, DesignReviewCriteria. Public-OwnedAffordableHousing Development O O SeeSection8.0145 ResidentialCareFacility C C ResidentialConversionofExisting CommercialStructure O O SeeSection8.0144 Townhouse O O SeeSection8.0142,TownhouseDevelopmentand DesignStandards PlannedUnitDevelopment C C Eating and Drinking: Bakery(retail/sit-down) O O Bar/tavern(wherefoodisalsoserved),Brew Pub O O Café,sit-downrestaurant,diner O O MobileFoodPod N N MobileFoodUnit N O PermittedthroughaTemporaryUsePermit,Section 8.0380. Notallowedonlotswithdwellingunit(s) MobileFoodVendoronprivateproperty O O PermittedthroughBusinessLicensingprovisionsin CityCode,Section7.005etseq. Canonlyoperatebetween8AMand9PMforno morethantwoconsecutivedayswithina90-day periodandmustbelocatedonrealpropertyin associationwithanevent. MobileFoodVendoronpublicproperty O O PermittedthroughSpecialEventsprovisionsinCity Code,Section7.350etseq.orParksReservation Permit. Entertainment: Indoorcommercialrecreation O O SeebuildingarearestrictionsinTableH, MinimumStandards
uses
inTable
may not occupymore than 20%of the netland area on thesubject propertyzoned
CHAPTER 8 DEVELOPMENT REGULATIONS 87 Walk-inmovietheater C O Automobiles/Trucks/RV Uses: Gasstations C C Autoservices C C Includesautolubeshops(samedayservice) Industrial Uses: LightIndustrialUsesincluding manufacturing,fabrication,andassembly C O Includes“craftsman”suchasglassblowing,etc. MedicalResearchFacility O O Precisionmachineshop N O Retailusesinsupportofprimaryindustrial use O O Office and Office Products: Office O O Includesmedicalofficesandprofessionalservices CorporateHeadquarters O O Lessthan50,000sqftfootprint Officeserviceandsupplies O O Printing,publishing O O Telemarketing,callcenter O/C O Outrightalloweduseonupperfloorsofamulti-story buildingorallowedasaconditionaluseonground floorandlimitedto50%oftotalfloorareaonground floorintheMUNzone. Public and Semi Public Uses: Churches,religiousinstitutions C C EmergencyShelter O O ReviewedunderORS197.782.Emergencyshelters fornaturaldisasterresponsearenotsubjectto review. Lodge,club,non-profit/fraternalorganization C C Park(publicorprivate) O O Publictransportationstationorpublicutility facility O O Seedefinitions. Schools(publicorprivate) C C RecreationFacility(publicorprivate) O O Privateutilityfacility C C SupportiveShelter O N SeeSection8.0370,SupportiveShelterStandards Commercial Uses: ChildCareFacilities C C RetailUses O/C C*** IntheMUNzone,singleretailusesarepermitted outrightupto25,000squarefeetinfloorarea;single retailusesbetween25,000and40,000squarefeetin floorarearequireaConditionalUsePermit. ServicesCommercialUses O O VeterinarianServices O O
CHAPTER 8 DEVELOPMENT REGULATIONS
Drivethrough/upfacilitiesaspartofan approveduse(facilitiesmustincludean insideusecomponentsuchasseatingora servicearea,exceptforvotingdropoffsand postaldropboxes)
**Anyresidentialuseisprohibitedwithin1mileoftheRedmondAirportRunwayProtectionZone.
***IntheMUEzone,commercialusesmustbeofatypeandscalethatisdesignedtosupportsurroundingindustrial,and employmentusesandmaynotbeusedforcommercialdevelopmentthatservesaprimarilyregionalretailfunction.
Live/WorkDwelling
andstandardsinRDCSection8.3035,DesignReviewCriteria.
MobileFoodVendoronprivateproperty
Section7.005etseq.
Canonlyoperatebetween8AMand9PMfornomorethantwo consecutivedayswithina90-dayperiodandmustbelocatedon realpropertyinassociationwithanevent. MobileFoodVendoronpublicproperty
7.350etseq.orParksReservationPermit. Entertainment:
Industrial
88
O O
Standard MULW Reference/Standards: ExistingSingle-FamilyResidentialUseprior toMay2011 O AnADUispermittedtoaccompanyexistingsingle-familydetached
AffordableHousing,containing100% affordabledwellingunits O MixedUseWorkforceHousing,containing groundfloorcommercialand100% workforceoraffordabledwellingunits O ResidentialConversionofExisting CommercialStructure O SeeSection8.0144 Public-OwnedAffordableHousing Development O SeeSection8.0145 Live/WorkDwelling
dwelling.
O Seedefinitionsoflive/workhouses,townhousesandapartments,
Eating and Drinking: Bakery(retail/sit-down) O Bar/tavern(wherefoodisalsoserved)Brew Pub O Café,sit-downrestaurant,diner O MobileFoodPod N MobileFoodUnit N
PermittedthroughBusinessLicensingprovisionsinCityCode,
O
O PermittedthroughSpecialEventsprovisionsinCityCode,Section
Indoorcommercialrecreation O SeebuildingarearestrictionsinTableH, MinimumStandards Automobiles: Gasstations C Autoserviceandrepair C Includesautolubeshops(samedayservice)
Uses: LightIndustrialUsesincluding manufacturing,fabrication,andassembly O Includes“craftsman”suchasglassblowing,etc.
Drivethrough/upfacilitiesaspartofan approveduse(facilitiesmustincludean insideusecomponentsuchasseatingora servicearea,exceptforvotingdropoffsand postaldropboxes)
C
accessorytoanoutrightpermittedorconditionaluseandshallbe limitedto2,500squarefeetperuse.
neighborhood(suchasbeautyandbarbershops,daycare,dry cleaners)andshallbelimitedto2,500squarefeetperuse.
within600feetofanyarterialorcollectorintersectionwithastate highway,within400feetofalocalstreetintersectionwithastate highway,andnotadjacenttoorhaveaccesstoastatehighway. Otherwise,drivethroughordriveupfacilitiesmaybelocatedwithin 100feetofacollectororarterialstreetintersectionandshallbe separatedfromotherdrivethroughanddriveupfacilitiesbya minimumof300feet.
8 DEVELOPMENT REGULATIONS 89 Office O DistributionCenter O Wholesaler O Precisionmachineshop O Researchanddevelopmentfacility O ContractorServiceandSupply O Retailassociatedwiththisuseislimitedto5,000squarefeet. Shoporstudio(includingwoodworkingand otherartisans) O Warehousingandmanufacturing O Office-TypeUses: Officeserviceandsupplies N Includesmedicalofficesandprofessionalservices Printing,publishing O Telemarketing,callcenter O Public and Semi Public Uses: Churches,religiousinstitutions C EmergencyShelter O ReviewedunderORS197.782.Emergencysheltersfornatural disasterresponsearenotsubjecttoreview. Lodge,club,non-profit/fraternalorganization C Park(publicorprivate) O Publictransportationstationorpublicutility facility O Seedefinitions. Schools(publicorprivate) O RecreationFacility(publicorprivate) O Privateutilityfacility C SupportiveShelter O SeeSection8.0370,SupportiveShelterStandards Commercial Uses: ChildCareFacilities C RetailUses
IntheMULWzone,retailuseshallbeonlyallowedasan
ConvenienceStore O Limitedto2,500squarefeetinsize ServicesCommercialUses O IntheMULWzone,servicecommercialusesshallsupportthe
CHAPTER
O
InMULWdrivethroughordriveupfacilitiesshallnotbelocated
[Section 8.0260 added by Ord. #2009-03 passedMay 26, 2009]
[Section 8.0260 amended by Ord. #2009-14 passed December 8, 2009]
[Section 8.0260 amended by Ord. #2011-09 passed November 8, 2011]
[Section 8.0260 amended by Ord. #2015-04 passed May 19, 2015]
[Section 8.0260 amended by Ord. #2020-15 passed November 10, 2020]
[Section 8.0260 amended by Ord. #2022-04 passed June 28, 2022]
[Section 8.0260 amended by Ord. #2022-09 passed December 13, 2022]
[Section 8.0260 amended by Ord. #2023-07 passed December 19, 2023]
8.0261MULW Special District Overlay.
1. The purpose of this Special District Overlay is to allow uses within a portion of the MULW Zone that exist at the time of the effective date of the adoption of this ordinance to be permitted as outright permitted uses. The Special District Overlay will allow existing uses and businesses to continue their operations in perpetuity, subject to the requirements of this Section.
2. In addition to the uses allowed in Section 8.0260, the following list of uses is allowed as permitted use for properties located in the Special District Overlay.
O Includes,butisnotlimitedto,antiquestores, equestrianequipmentsalesandservice,meat market,drive-thrufoodandcoffeekiosk,metal productssales,landscapingsupplyandservices.
3. Valid evidence of the presence of an existing legal use in this overlay, if required, may include the following:
A. City Business License (specific to an address in the overlay)
B. Other City, County or State Licensing
C. Past advertising spaces or phone book listings
D. Photographic evidence of past use
E. Utility billing information
F. Other evidenceas approved by the Community Development Director
4. Existing businesses present at the time of the effective date of this adoption of this ordinance may be permitted to expand their use up to 50% of the existing operational footprint onto adjoining properties.
5. Cessation of a business in this overlay for a period of one-year voids the special use as an existing permitted use.
[Section 8.0261 added by Ord. #2011-09 passedNovember 8, 2011]
8.0265Table H, Minimum Standards. The following minimum standards are required in each respective zone (all distances aremeasured infeet):
8 DEVELOPMENT REGULATIONS 90
CHAPTER
Standard MULW -SD Reference/Standards
Uses: ExistingRetailUses
ExistingSaleandServiceofRecreational Vehicles O Includesmotorcycles,golfcarts,RVs ExistingTowingYards O ExistingAutoServiceandRepair O Includingbodyshops ExistingFuelingStation O
Special
Front
InteriorSide
Street
Outdoor Storage Notallowedasa permanentuse
building
Onlyappliestononresidentialuses.
Onlypermittedthrough sitedesignreview. Maximumsizeofstorage areashallnotexceed 40,000squarefeetforany singleuse.
Note: Residential uses permitted in Mixed-Use zones shall be subject to the density standardsfor the R-5zone.
**Buildingsshallbebuilttoaminimumof0feetandamaximumof15feetofthefrontpropertyline.Agreaterfrontyardsetback maybeapprovedthroughSiteandDesignReviewifthesetbackareaincorporatesenhancedpublicspacesandpedestrian amenitiessuchasplazas,arcades,outdoorcafe,benches,streetfurniture,publicart,kiosks,oradditionallandscaping.
***Tofostercompatibilitybetweennewmulti-storybuildingsandexistingsingle-storydwellings,multi-storybuildingsand structuresinMixedUseNeighborhood(MUN)districtshall“step-down”tocreateabuildingheighttransitiontoadjacentsinglestorybuilding(s)inlow-densityresidentialdistricts(R-1andR-2),asprovidedinsubsections1-3,below:
1.ThisstandardappliestonewandverticallyexpandedbuildingsandstructuresintheMUNdistrictthatarewithin[25]feet(as measuredhorizontally)ofanexistingsingle-storybuildinginlow-densityresidential(R-1andR-2)districtswithaheightof[20] feetorless,asshowninthefigurebelow.
2.Thetransitionstandardismetwhentheheightofthetallerstructure(“x”)doesnotexceedone(1)footofheightforevery one(1)footseparatingthetwostructures(“y”),asshowninthefigurebelow
3.Exception:Theprovisionsofsubsections1-2donotapplywhentheapprovalbodyfindsthatthesubjectsingle-story buildingslocatedwithin[25]ofthesubjectsiteareredevelopable.“Redevelopable,”forthepurposesofthisSection,meansa loteitherhasanassessedmarketvaluethatexceedstheassessedmarketvalueofallimprovementsonthelot,basedonthe mostrecentdatafromDeschutesCountyAssessor’sOffice;orthefrontyardofthesubjectlotislargeenoughthatitcouldbe subdividedbasedontheresidentialdistrictstandards
91 Standard: MUN MUE MULW and MULW-SD Reference/Standards: Minimum Yard Setbacks
CHAPTER 8 DEVELOPMENT REGULATIONS
LocalStreet 0ft.** 10ft. 10ft. Collector 0ft.** 15ft. 15ft. Arterial 0ft.** 25ft. 25ft.
Standard 0ft. 0ft. 0ft. AdjacenttoRzone 25ft. 25ft. 0ft.
Side LocalStreet 0ft. 10ft. 10ft. Collector 0ft. 15ft. 15ft. Arterial 0ft. 25ft. 25ft. Rear Interior 0ft. 10ft. 10ft. Adjacenttoalley 0ft. 25ft. 10ft. Maximum Building Height 45ft.*** 45ft.*** 45ft. Minimum Street Frontage 25ft. 25ft. 25ft. Maximum Lot Coverage 80% 80% N/A Minimum Lot Size 2,500sq.ft 6,000sq.ft. 5,000sq.ft.
Maximum Building FootprintPer Single Use 40,000sq.ft. 60,000sq.ft
Onlyappliestononresidentialuses.
80%ofprimary
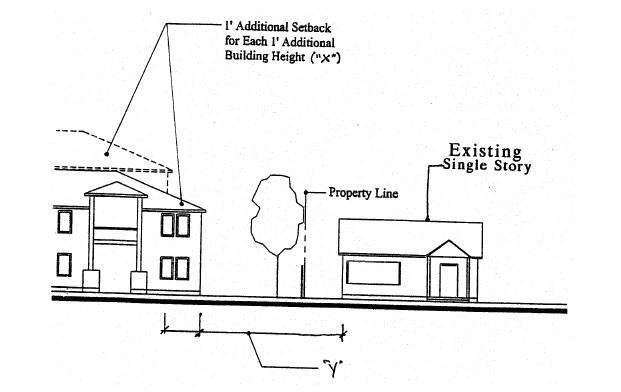
[Section 8.0265 added by Ord. #2009-03 passedMay 26, 2009]
[Section 8.0265 amended by Ord. #2009-14 passed December 8, 2009]
[Section 8.0265 amended by Ord. #2011-09 passed November 8, 2011]
[Section 8.0265 amended by Ord. #2020-15 passed November 10, 2020]
[Section 8.0265 amended by Ord. #2023-07 passed December 19, 2023]
CHAPTER 8 DEVELOPMENT REGULATIONS 92
Figure for Section 8.0265 Table H: Maximum Building Height StepDown/Transition
Q. Location of existing canals and laterals including easements and right-of-way.
R. Location of existing drainage on-site.
S. Location of all utility and access easements on the property.
T. Location, size, and use of all contemplated and existing public areas within the proposed development.
U. All fire hydrants proposed to be located withinthe site.
V. A topographic map of the site at a contour interval not to exceed five(5) feet.
W. Location of all parking areas and dimensions of all parking spaces.
X. Locations of all existing natural features including, but not limited to, any existing trees having a six (6) inch trunk diameter or greater, three (3) feet above grade, and any natural drainage ways existing on the site, and all significant natural features including (but not limited to) outcroppings of rocks, boulders, etc. Indicate any contemplated changes that would affect a natural feature.
3. Landscape Plan. See Section 8.0520 through 8.0540 for applicable landscaping standards.
4. Lighting Plan. A lighting plan showing the type, placement, wattage, and method of shielding all exterior lights from adjacent sites shall be submitted.
5. Neighborhood Compatibility Statement. A statement shall be submitted that addresses the applicable neighborhood compatibility criteria within 8.3035(3).
[Section 8.3025 amended by Ord. #2022-04 passed June 28, 2022]
[Section 8.3025 amended by Ord. #2022-04 passed June 28, 2022]
[Section 8.3025 amended by Ord. #2023-07 passed December 19, 2023]
8.3030Special Studies, Investigations and Reports. Special studies, investigations and reports may be required to ensure that the proposed development of a particular site does not adversely affect the surrounding community, does not create hazardous conditions for persons or improvements on the site. These may include Traffic Impact Analysis, trip generation or parking studies/reports, impact of contaminated soils, soil conditions, flooding of waters and excessive storm water runoff, tree preservation, and other concerns of the development’s impact on adjacent properties or public facilities.
1. An approved Transportation Impact Analysis (TIA) will be required prior to land use application completeness acceptance. A TIA approval memorandum, issued by the City Engineer, shall be included with the application submittal per Section 8.1015.
[Section 8.3030 amended by Ord. #2020-15 passed November 10, 2020]
[Section 8.3030 amended by Ord. #2022-09 passed December 13, 2022]
[Section 8.3030 amended by Ord. #2023-07 passed December 19, 2023]
8.3035Design Review Criteria. Prior to issuance of a building permit, the following applicable criteriashall be met.
1. Installation of Utilities. Allnew service lines and relocated transmission lines shall be placed underground. Existing overhead transmission lines or utility lines shall be relocated underground unless otherwise approved by the CDDDirector, City Engineer, or Hearings Body.
2. Right-of-Way Dedication & PublicImprovements. Adequate right-of-way dedication and improvements to streets, alleys, sidewalks, bikeways, and other public ways shall be provided by the Owner that conform to City of Redmond adopted Transportation Plan, Transportation Impact Analysis & Access Management Standards, Public Works Standards & Specification, and the local service street policies, including the gridpolicy. In lieu of
CHAPTER 8 DEVELOPMENT REGULATIONS 264
actual construction of improvements, the City may chooseto accept financial payment, contribution, other approved security, or agreement for the purpose of providing the needed improvements. The City may requirethat no building permit be issued until public improvements are completed; this shall be clearly identified (if applicable) within the Site Improvement Agreement.
3. Neighborhood Compatibility. This standard shallnot apply to any development that requires aconditional use permit. Subsections B. and D. do not apply to needed housing (ORS 197.307).
A. The proposal will be consistent with applicable zoning standards.
B. The location, size, design, and physical characteristics of the proposal (such as setbacks, height, position of structure on the site) will have minimal adverse impact on the livability or valueof abutting properties.
C. The project will not exceed the operational capacity of public facilities, and which arerequired to serve the development unless theCity Engineer determines that sufficient capacity can be provided. The capacity of public facilities and services shall be based primarily on the City’s Water andWastewater Master Plan and the Transportation System Plan.
D. The proposal is consistent with the applicable Great Neighborhood Planning Principles described in Section 8.0270(3)(C)(13) and adopted Area Plans.
4. Architectural Requirements.
A. Architectural theme. A specific architectural theme is required for any structure that is a candidate for Site and Design review. The theme used shall be carried out completely inthe design and not mixed with conflicting themes. The theme used shall be consistent with allbuildings on the subject site.
B. False front design. A false front design of a building shall be avoided, except for the Downtown (C-2) Commercial District.
C. Historical Buildings. Compliance with the preservation of historic buildings and sites pursuant to section 8.0855 and 8.0860 where applicable.
D. Commercial and Industrial buildings.
1. BuildingOrientation. The City may require the applicant to position buildings to have their architectural orientation toward the primary focal point on the site (typically thehigher ordered street). However, the City may also require the applicant to orient the building in any position on the site if the perceived focal point is internal tothe site. At notimeshall unbroken spans of side or rear walls of buildings be visible from any street without architectural treatmentsand screening added. Orientation of the building shall consider compatibility with neighboring structures in terms of setbacks, height of building, architectural treatment, and entrances of neighboring buildings.
2. Buildings shall comply withthe City’s access policies regarding vehicle access and provide adequate pedestrian ways tosafely navigatethe parking areas and to connect to the public sidewalks. Adequate internal vehicle access shall be designed to minimize or eliminate vehicle/vehicle or vehicle/pedestrian conflicts.
3. Commercial Drive-up windows and drive-throughs should be oriented away from the principal street.
4. Industrial Building Basic Architecture. To avoid the effect of single, long, or massive walls with no relation to human size, industrial buildings shall provide features of architectural interest for all street-facing facades.
a. Defined Building Entrance and Orientation. At least one entrance (not including emergency exit) of any building shall be oriented
CHAPTER 8 DEVELOPMENT REGULATIONS 265
toward the street. A primary building entrance shallbe clearly defined and recessed or framed by a sheltering element such as an awning, canopy, or portico.
b. Street-facing facades shall include a change of material (such as a wainscot or similar architectural features) along the façade(s).
c. Awnings, canopies, or structural overhangs of at least 3 feet indepth shall be provided over doors and windows along the primary streetfacing façade. This requirement does not apply to roll up doors.
E. Multi-Family Complexes. This section establishes a process for the review of multi-family complexes development proposals inorder to promote functional, safe, innovative, and attractivedevelopment that is compatible with the natural and manmade environment. Theintent is to promote compatible development, foster the attractiveness and functional utility of multi-family development, protect public and private investments in the area, raise the level of community expectations for the quality of its environment.
1. Table A. Minimum Standards. The following minimum standards apply in each of the Residential zones:
2. BuildingOrientation. All buildings facing a public street right of way shall have a functional primary entrance oriented to each public street frontage, except for buildings fronting along and facing a Major Arterial Street as designated on the City of Redmond Transportation System Plan. Additional primary entrances, if provided, or, in cases where buildings are internal to the development and donot front on the public street right of way, shall be oriented to aprivate common area (common areas include private streets, courtyards, or open spaces). A hard-surfaced pedestrian sidewalk or pathway connecting the building entrances to the public streets right of way shall be provided.
3. Building Form. In order to preclude large expanses of uninterrupted building surfaces, each floor of the building shall include at least three of the following features withinevery 30 lineal feet or portion thereof along all elevations of the structure:
a. Recess (e.g., deck, patio, courtyard, entrance, or similar feature) that has aminimum depth of 4 feet;
b. Extension (e.g., floor area, deck, patio, entrance, or similar feature) that projects aminimum of 2 feet and runs horizontally for a minimum length of 4feet; and/or
c. Offsets or breaks in roof elevations of twofeet or greater in height.
d. Offset or breaks in building façade elevations of 2 feet or greater in relief.
CHAPTER 8 DEVELOPMENT REGULATIONS 266
Multi-FamilyComplexStandards: R-4 R-5 Minimum SetbackDistance Front 15 15 Side 15 15 Rear 20 15 Garage 20 20 Maximum Building Height 45 45 Maximum Density(Units/Net Acre) 14.5 17.4
4. DetailedArchitectural Features. All buildings shall provide detailed design along all elevations (e.g., front, rear, and sides). Detailed design requires use of at least fiveof thefollowing architectural features on all front and exterior side (corner lot) elevations and at least three of the following architectural features on all interior and rear yard elevations, at aminimum of every 30 lineal feet of horizontal wall. Architectural features shall be varied on the different building elevations. The standard applies to each full and partial building story.
a. Dormers
b. Gables
c. Recessed and covered porch entries of at least 4feet in depth
d. Towers, at least 2, minimum 2-foot elevation change to roof ridge.
e. Eaves (minimum 12-inch projection)
f. Off-sets in building faceor roof (minimum 16 inches)
g. Window trim on all windows on the façade
h. Bay or oriel windows
i. Balconies
j. Decorative patterns on exterior finishes (e.g., paint scheme, scales/shingles, wainscoting, ornamentation, andsimilar features)
k. An alternative feature providing visual relief anddetail, similar to option a-j above, may be approved through the development review process.
5. Exterior Finish. The exterior finish on all vertical surfaces shall be comprised primarily of materials such as masonry/wood lap siding, shingles, brick, or stucco. The use of sheetmetal, plywood, T1-11 siding, smooth face cinder block and other similar materials is not permitted except as minor accents. Textured cinder blocks are permitted on side and rear façades but shallnot exceed 40% of the total exterior wall area of the ground/bottom floor.
6. BuildingAlignment. There shall be no window to adjoining window alignment when adjacent buildings are less than 30 feet apart. Frosted windows or similar are exempt from this standard.
7. Trash Receptacles. Acommon trash enclosureshall be required and is subject to the following standards.
a. Trash enclosures shall be oriented away from adjacent residences and shall be screened by use of brick or stone walls.
b. Trash enclosures shall be accessibletotrash pick-up vehicles and shall provide an unobstructed, straight on approach a minimum of 40 feet in length.
c. Trash enclosures, aminimum of six feet in height, shall be constructed of masonry, durable and attractive walls, with solid screen doors and shall be visually consistent withproject architecture. Gate opening shall be a minimum of 10 feet wide and shall not include a center pole or other obstruction preventing access to the enclosure. Gates must swing open 180 degrees and shall include a gate stop to hold it open.
d. Enclosure areas shall contain sufficient space toaccommodate both refuse disposal and recycling containers adequate to accommodate the degree of development. Disposal needs shallbe calculated at 0.3 yards per dwelling unit for refuse and 0.2 yards per dwelling unit for recycling. Thefollowing construction specifications shall be used
CHAPTER 8 DEVELOPMENT REGULATIONS 267
as a guide for enclosuredesign based on the calculation requirements listed herein:

e. The area standards for trash enclosures listed insubsection (d.) above shall be met unless documentation is submitted from the applicable trash collection company indicating that an alternative design will be adequate to accommodatethe amount of refuse and recycling that is anticipated to be generated on an ordinary basis.
8. Mechanical Equipment. External mechanical equipment, such as heating or cooling equipment, pumps, or generators, that is located on the ground or on the roof of buildings, must be entirely screened from view at ground level by sight obscuring walls, fences, parapet, or other similar means consistent with the overall architecture of the development. Landscaping is not an acceptable alternative for such screening as specified herein. Screening shall be compliant with all applicable codes No heating or cooling equipment shall be placed on exterior walls unless completely screened from view.
9. Common Open Space. Common open space(s) shall be incorporated into the site plan for multi-family complexes as a primary design feature. All multi-family complex developments shall provide either 3,000 squarefeet or 15 percent of site area for open space, whichever is greater. The open space may include required setbacks areas but may not include dedicated street rights-of-way and land dedicated toother public uses like parks and schools. The Community Development Director, or designee, may require this area tobe protectedfrom streets, parking areas, or the like, by a fence or the equivalent. Sensitive lands and historic buildings or landmarks open to the public and designated by the Comprehensive Plan may be counted toward meeting the common open space requirements.
The open space provided must be landscaped inthe active or passive park style, shall include amenities such as pedestrian paths, lighting, and trash receptacles. If the common open space is landscaped as an active style park, it may be of any size provided it meets the requirements of this subsection and shall notbe subject tothe irrigated turf restrictions of Section 8.0530(G). Additionally, all multi-family complexes with 20 or more units shall provide twoor more amenities for the residents as listed below. Such amenities shall be centrally located for amajorityof the residents.
a. Tot lot/play structure
b. Community garden
CHAPTER 8 DEVELOPMENT REGULATIONS 268
c. Picnic tables/barbecue areas
d. Swimming pool, splash pad, or other water feature
e. Indoor recreation facility
f. Sports courts (i.e., basketball, tennis, volleyball)
g. Other active or passive recreation area that meets the intent of this standard as approved through the development review process.
10. Private Open Space. Private open space accessible from interior shall be required for all triplexes and quadplexes based on the following standards:
a. Ground/bottom floor housing units shall havefront or rear patios or decks at least 4 feet deep and measuring at least 48 square feet in area.
b. A minimum of 50% of allupper floor (second floorand above) housing units shall havebalconies or porches at least 4 feet deep and measuring at least 48 squarefeet in area.
c. To the maximum extent possible, private open space areas shall be oriented toward common open space areas and away from adjacent single family residences, parking areas and driveways and trash enclosures.
11. Special Yards. In order to allow air circulation and light, the distance between buildings on the same lot shall be as follows:
a. All front and rear walls, and all walls with a primary entrance shallbe separated from all other walls on all other buildings on the same lot by a minimum of 20 feet.
b. The distance between side walls on buildings on the same lot shall be no less than 12 feet.
12. Storage. Allmultifamily dwellings and complexes shall provide for storage of furniture, tools, equipment, building materials or supplies belonging to the occupants or management of the complex. Eachdwelling unit shall have one assigned, securablestorage area, aminimum 18 square feet, but shall be of a minimum size and dimension that is suitable to accommodate one bicycle of average size. Storage areas may be indoor, such as attached or detached garages, or within specific areas what are internal to each dwelling unit. Storage areas may also be within outdoor structures such as within a separate storage building located on premises. The City may exempt or reduce the storage space requirement for “specialty housing”, such as senior housing or for housing for long-term infirm care.
13. Off-Street Parking. Alloff-street parking provisions addressed herein (including: number of spaces; loading areas; and design and improvement standards) shall be provided in conformance withSection 8.0500 through 8.0515. Plexes shall comply with the City’s access policies regarding vehicle access and provide adequate pedestrian ways tosafely navigatethe parking areas and to connect to the public sidewalks. Adequate internal vehicle access shall be designed to minimize or eliminate vehicle/vehicle or vehicle/pedestrian conflicts in off-street parking areas. If off-street parking areas are proposed to be placed between the primary building elevations and public streets, the application shall be subject to apublic hearing pursuant to Article II – Land Use Procedures, Sections 8.1000 through 8.1720.
F. Exterior Mechanical Equipment. These shall be screened so as not to be visible from public streets or residences and not placed on exterior walls unless fully screened.
CHAPTER 8 DEVELOPMENT REGULATIONS 269
G. Surfacing. Gravel is prohibited as a surfacing material in the commercial or mixed use zones. Areas that are not part of the required landscaped areas shall be surfaced with asphalt or concrete unless natural, undisturbed open areas.
H. Building Design for Automotive Service Stations. The entrance to the service bays shall not be open to the street but shall be so designed to face the rear or interior side property line.
I. Retail, Office, Commercial and Mixed Use Buildings in the MUN and MUE zones.
1. Building Entrances and Orientation. At least one entrance (not including emergency exit) of any building shall be oriented toward the street and the main entrance shall be accessed directly from a public sidewalk. Primary building entrances shall be clearly defined and recessed or framed by a sheltering element such as an awning, arcade, or portico for weather protection.
2. Entries to retail, office, and mixed-use buildings in the MUN zone shall be at sidewalk level.
3. Entryways. Retail, office, commercial and mixed-use buildings in the MUN zone shall have clearly defined, highly visible customer entrances that include at leastthree of the following elements, listed below.
a. Recesses/projections;
b. Arcades;
c. Raisedcornicedparapetsoverthedoor;
d. Peakedroofforms;
e. Arches;
f. Outdoorpatios;
g. Architectural details such as tile work and moldings that are integrated intothebuildingstructureanddesign;
h. Integral planters or wing walls that incorporate landscaped areas and/or placesforsitting.
4. For buildings located at the corner of street intersections, one of the three treatmentsisrequiredtoemphasizetheimportanceofthislocationinthedistrict.
a. Locate the primary entry to the building at the corner of the building or within25feetofthecornerofthebuilding.
b. Incorporateprominentarchitecturalelements,suchasincreasedbuilding height or massing, a cupola, a turret, or a pitched roof, at the corner of thebuildingorwithin25feetofthecornerofthebuilding.
c. Chamfer the corner of the building (i.e., cut the corner at a 45-degree angle and a minimum of 10 feet from the sidewalk corner) and incorporate include extended weather protection (arcade or awning), specialpavingmaterials,streetfurnishings,orplantingsinthecut.
5. Facade Transparency. The main front (street-facing) elevation(s) shall provide at least 50% windows or transparency at the pedestrian level. The side elevations shall provide at least 25% transparency. The transparency is measured in lineal fashion (For example, 100-foot-long building elevation shall have at least 50 feet (50% of 100 feet) of transparency in length).
6. Minimum wall articulation, side or rear walls that face walkways may only include false windows and door openings defined by frames, sills and lintels, or similarly proportioned modulations of the wall, only when actual doors and windows are not feasible because of the nature of the use of the building.
7. Facade Treatment
a. Minimum Wall Articulation.
CHAPTER 8 DEVELOPMENT REGULATIONS 270
i. Facades shall add architectural interest and variety and avoid the effect of a single, long, or massive wall with no relation to human size. No wall that faces a street or connecting walkway shall have a blank, uninterrupted length exceeding 30 feet in the MUN Zone without including, but not be limited to, at least two of the following:
(a) Change in plane,
(b) Change in texture or masonry pattern,
(c) Windows, trellises withvines, or
(d) An equivalent element that subdivides the wall into human scale proportions.
ii. Facades greater than 100 feet in length, measured horizontally, shall incorporate wall plane projections or recesses having a depth of at least 3% of the length of the facade and extending at least 20% of the length of the facade. No uninterrupted length of any facade shall exceed 100 horizontalfeet.
iii. Ground floor facades that face public streets shall have arcades, display windows, entry areas, awnings, or other such features along no less than 50% of their horizontal length.
iv. Ground floor facades that face public streets shall incorporate at least twoof thefollowing elements:
(a) Canopies or overhangs (5’-0” minimum, measured from either the face of the column or the street-facing elevation) for the width of the building;
(b) Transom window;
(c) Storefront frieze, horizontal sign band, or a belt course above the transom window or mezzanine level;
(d) Window plant box (minimum of one per window);
(e) Projected window sill (12” to 24” above grade).
v. Building facades must include a repeating pattern that includes any one or more of the following elements:
(a) Color change;
(b) Texture change;
(c) Material modulechange.
vi. Facades shall have at least one of elements subsections (8)(a)(ii), (iii) or (iv) of this section repeat horizontally. All elements shall repeat at intervals of no more than 30 feet, either horizontally or vertically.
b. Common concrete masonry unit (CMU) is prohibited (textured CMU is allowed).
c. All sides of the building shall include materials and design characteristics consistent with those on the front. Use of inferior or lesser quality materials for side or rear facades shall be prohibited.
d. Trellises, canopies, and fabric awnings may project up to five feet into front setbacks and public rights-of-way, provided that the base is not less than eight feet at the lowest point and no higher than ten feet above the sidewalk. Awnings shall be no longer than a single storefront unless multiple storefronts exist. If multiple storefronts exist, trellises, canopies, and fabric awnings shall create uniform
CHAPTER 8 DEVELOPMENT REGULATIONS 271
cover without breaks.
8. Roof Treatments
a. All facades shall have a recognizable “top” consisting of, but not limited to:
i. Cornice treatments, other than just colored “stripes” or “bands,” with integrally textured materials such as stone or other masonry or differently colored materials; or
ii. Sloping roof withoverhangs and brackets; or
iii. Stepped parapets;
iv. Special architectural features, such as bay windows, decorative roofs and entry features may project up to three feet into street rights-of-way, provided that they are at least nine feet above the sidewalk.
5. Landscaping. See Section 8.0520 through 8.0540 for applicable landscaping standards.
6. Mobile Food Pods.
A. Applicability. Mobile Food Pod Site and Design review shall be required for any new Mobile Food Pod development. An alteration to a site of, or an addition of a Mobile Food Unit to an existing Mobile Food Pod, is subject to a Minor Alteration pursuant to Section 8.1400(2). Theseprovisions do not apply to:
1. A Mobile Food Unit approved and permitted through a Temporary Use Permit, Section 8.0380.
2. A Mobile Food Vendor on private or public property.
B. General Requirements. The following provisions apply to all Mobile Food Units within a Mobile Food Pod. Mobile Food Units shall:
1. Obtain a valid City business license and operational permit from Redmond Fire and Rescue.
2. Sell primarily food and/or beverage items.
3. Be maintained in a neat and clean condition including but not limitedto:
a. Regular maintenance and cleaning of the exterior of the Mobile Food Unit to avoid rust and peeling paint.
b. Repair of broken or sagging awnings, canopies, platforms, counters, benches, tables, seating, umbrellas, and other structures.
4. Not dump wastewater onto the ground, onto the streets, or into a storm drainage facility. All liquid waste from the waste tank or from cleaning activities such as cleaning the Mobile Food Unit, shall be captured, and properly disposed, except as approved by the City Engineer. Discharge or leakage draining intothe stormwater system is prohibited.
5. Be placed on an impervious surface such as asphalt, concrete, pavers, or other surface as approved by the City Engineer. Spills shall be cleaned and disposed of properly.
6. Provide vehicular access pursuant to Section 8.2820, Access Management Standards, and per Public Works Standards andSpecifications.
7. Provide permanent restrooms with hand-washing stations and located within 250 feet of the Mobile Food Pod. No portable bathrooms are allowed onsite.
8. Connect to a public water and sewer or other approved permanent source, as required in City Code, Chapter 4, and conforming to Public Works Standards and Specifications, unless exempted by the City Engineer.
9. Connect to a permanentpower source:
a. Power connections may not be connected by overhead wires or extension cords toindividual Mobile Food Units.
C. Design Standards. The following provisions apply to all Mobile Food Units within a
272
CHAPTER 8 DEVELOPMENT REGULATIONS
Mobile Food Pods.
1. Mobile Food Units shall not be located in the right-of-way and are only permitted on the subject property. Equipment, customer queue, or any accompanying items shall not be located within the right-of-way, clear vision areas, or sight distanceareas.
2. Mobile Food Units shall ingress and egress from an approved access point conforming to Public Works Standards and Specifications and must be kept clear and free from obstructions.
3. Mobile Food Units shall be a minimum of five feet from other Mobile Food Units and all structures.
4. Mobile Food Units shall have a minimum setback of 10 feet from all property lines or comply with theunderlying zone setback, whichever is greater.
5. A Mobile Food Pod containing more than eight Mobile Food Units, at any time, shall have a designated loading area. The loading area shall be provided with paved access, driveways and surfacing in the same manner as for off-street parking, except that each space shall be 10 feet wide and 22 feet long with a height clearance of at least 14 feet. A sight-obscuring screen shall conceal the loading area from view from public streets.
6. Mechanical or power-generating equipment located outside the Mobile Food Unit shall be concealed with screening at a height equal to or exceeding that of the equipment.
7. Any proposed fencing shall not be constructed of chain link and shall comply with Section 8.0340.
8. A minimum of at least 300 square feet of open space per Mobile Food Unit shall be provided for queuing, eating, and communal space.
9. Each Mobile Food Unit shall have an assigned, securable, interior storage area that is a minimum of 20 square feet.
10. Trash receptacles for the disposal of solid waste shall be provided in convenient, secure, and concealed locations and be of such capacity so that there is no accumulation of uncovered trash at any time. Solid waste shall be removed from the property on a scheduled basis to prevent health hazard or nuisance.
11. Deviation from any of the above standards may be granted administratively by the Community Development Director, or designee, provided extenuating circumstances.
7. Parking and Unloading Areas/Docks.
A. Off-Street Parking Areas. Parking areas shall be as near the public entrances to the structure served as possible.
B. Parking lot. The parking shall be dispersed around the building, emphasizing the importance of the building and accessibility to entrances. In the MUN and MUE zones, parking shall be located to the side, rear, or under the building or in a designed central parking lot.
C. Truck loading areas or docks. Truck loading areas or docks, where delivery is done by semi truck with a specified loading dock, shall be located or screened from the street or from the major public entrance to the building. The Applicant shall identify the specific type(s) and size of delivery vehicles which will deliver and/or take goods to/from the building; the hours of delivery, the location of delivery doors and their dimensions. Truck loading areas or docks shall not inhibit circulation onsite or create access problems from adjacent streets.
8. General Site Criteria.
A. Grading and Drainage.
273
CHAPTER 8 DEVELOPMENT REGULATIONS
1. Grading. Grading shall conform to the City of Redmond Public Works Standards and Specifications.
2. Drainage and Stormwater. Drainage shall be maintained in conformance with the Public Works Standards and Specifications. A stormwater drainage plan shall be developed in conformance with the Public Works Standards and Specifications.
3. Blasting. A permit for explosive blasting shall be obtained from Redmond Fire & Rescue and City Engineer prior to blasting.
B. Clear Vision Standard. The plan must conform to Section 8.0305, Establishment of Clear Vision Areas.
C. Trash Collection Areas. Trash collection areas shall not be oriented towards building entrances or public streets other than alleys and shall be screened or enclosed with building material which is compatible with those used in the exterior of the building. Location(s) of all trash collection area(s) shall be reviewed and approved by the Community Development Department Director, or designee.
D. Water and Sewer Service. Connection to the City’s public water and sewer systems shall be required and shall comply with the current Public Works Standards & Specifications.
E. Accessibility. At least one pedestrian pathway, which meets UBC accessibility requirements, shall be provided within the boundary of the site from public transportation stops, accessible parking spaces, passenger loading and drop off zones, and public streets or sidewalks to an accessible entry. When more than one building or facility is located on a site, at least one accessible route shall be provided between accessible buildings and accessible site facilities. The accessible route shall be the most practical and direct route among accessible building entries, accessible site facilities and the accessible entry to the site. Walks paralleling vehicular ways shall be separated from vehicular ways by curbs, planted areas, railings, or other means between the pedestrian way and vehicular routes.
F. Streetscape standards in the MUN zone. New retail, office, commercial and mixed-use development, and major modifications (per RDC 8.3005-8.3010) within the MUN zone shall provide one or more of the Category A pedestrian amenities listed below and all of the Category B amenities, as generally illustrated in the figure below. Pedestrian amenities may be provided within a planting strip or street furnishing zone, building frontage zone or plaza, as shown in the figure below. Use of the public right-of-way requires approval by the roadway authority.
CategoryA:
1. A plaza, courtyard, square or extra-wide sidewalk next to the building entrance (minimumwidthof8feet);
2. Sitting space (i.e., dining area, benches, garden wall or ledges between the building entrance and sidewalk) with a minimum of 16 inches in height and 30 inchesinwidth;
3. Publicartthatincorporatesseating(e.g.,fountain,sculpture).
CHAPTER 8 DEVELOPMENT REGULATIONS 274
Figureforsubsection7.f.:PedestrianAmenitiesforstreetscape
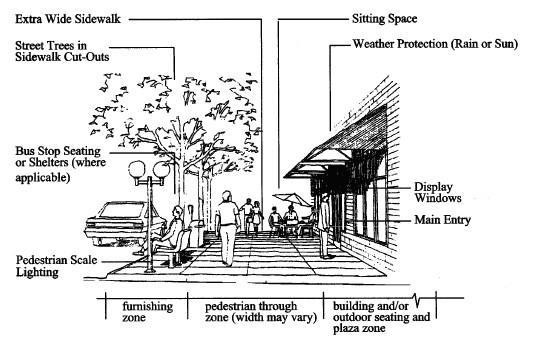
CategoryB:
1. Building canopy, awning, pergola, or similar weather protection (minimum projectionof4feetoverasidewalkorotherpedestrianspace).
2. Streettrees,asspecifiedinRDCSection8.3035(5)(k),ingrates.
3. One trash receptacle per building, for buildings wider than 40 feet at street/sidewalkfrontage.
4. Onepedestrianscalelightfixtureperbuilding.
5. Parking areas shall be located behind buildings, below buildings, or to the sides ofbuildings.
6. Neighborhood-scale signs, as specified in City Code Chapter 11, Sign Standards.
9. Transportation System Analysis (TIA). The development must meet requirements per Section 8.2815 (Transportation System Analysis).
10. Access Management Standards. The development must meet requirements per Section 8.2820 Access Management Standards.
[Section 8.3035 amended by Ord. #2009-03 passed May 26, 2009]
[Section 8.3035 amended by Ord. #2009-14 passed December 8, 2009]
[Section 8.3035 amended by Ord. #2012-04 passed April 24, 2012]
[Section 8.3035 amended by Ord. #2013-04 passed May 14, 2013]
[Section 8.3035 amended by Ord. #2015-01 passed February 24, 2015]
[Section 8.3035 amended by Ord. #2016-17 passed January 31, 2017]
[Section 8.3035 amended by Ord. #2017-12 passed December 12, 2017]
[Section 8.3035 amended by Ord. #2020-15 passed November 10, 2020]
[Section 8.3035 amended by Ord. #2022-04 passed June 28, 2022]
[Section 8.3035 amended by Ord. #2022-04 passed June 28, 2022]
[Section 8.3035 amended by Ord. #2022-09 passed December 13, 2022]
[Section 8.3035 amended by Ord. #2023-07 passed December 19, 2023]
8.3040Downtown Overlay District Design Review Criteria. In addition to the standards in Section 8.3035, prior to the issuance of a building permit, all properties, and structures in
275
CHAPTER 8 DEVELOPMENT REGULATIONS


