REDMOND CODE
CHAPTER 8
DEVELOPMENT REGULATIONS
The contents of Chapter Development Regulations can be found here:
https://www.redmondoregon.gov/home/showpublisheddocument/3426/638091
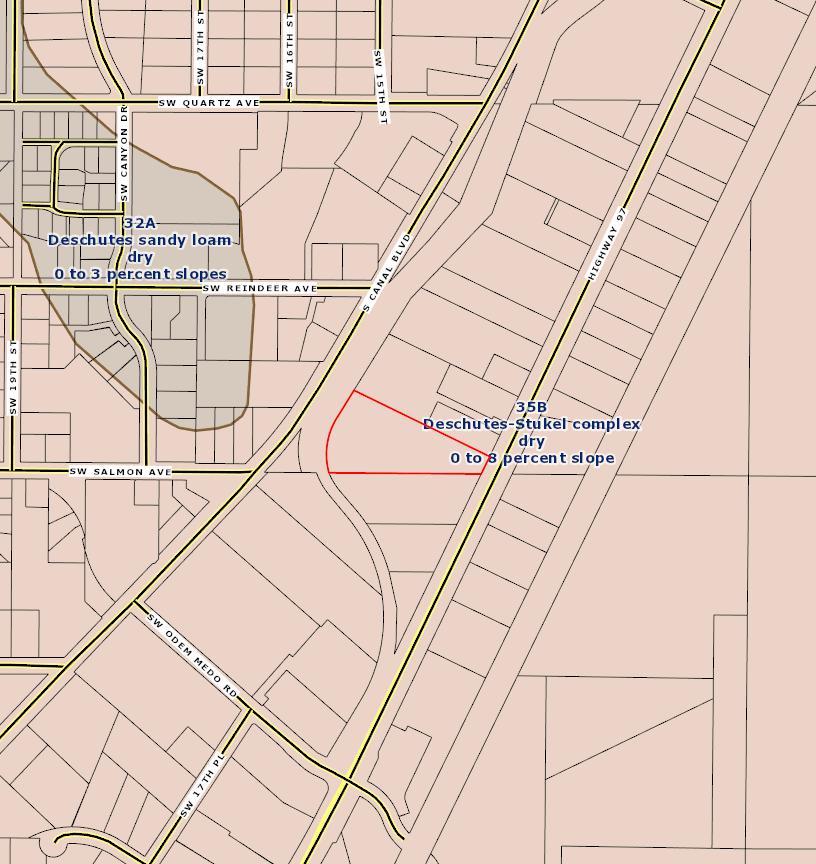
082331730000
Deschutes County Code
https://deschutescounty.municipalcodeonline.com/book?type=ordinances#name
=TITLE_18_COUNTY_ZONING

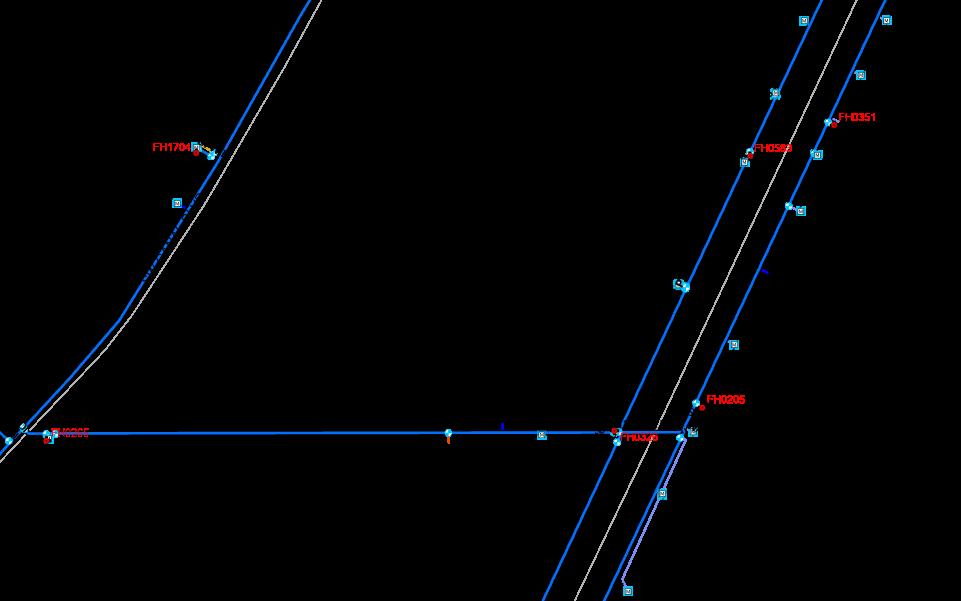
nal Great American Furniture anal Blvd Mobil Marshall's o Repair un Oreg Water Distribution Map 2285 S Hwy 97, Redmond Sources: Esri, Airbus DS, USGS, NGA, NASA, CGIAR, N Robinson, NCEAS, NLS, OS, NMA, Geodatastyrelsen, Rijkswaterstaat, GSA, Geoland, FEMA, REDMOND TAXLOTS STREET CENTERLINE WATER LATERAL Commercial Domestic Fire HydrantLaterals GRAVITY MAIN SYSTEM VALVE METER HYDRANT 3/12/2024, 10:08:33 AM 0 0.03 0.05 0.01 mi 0 0.04 0.08 0.02 km 1:2,257 Web AppBuilder for ArcGIS Esri Community Maps Contributors, Oregon State Parks, State of Oregon GEO, © OpenStreetMap, Microsoft, Esri, TomTom, Garmin, SafeGraph, GeoTechnologies, Inc, METI/NASA, USGS, Bureau of Land Management, EPA, NPS, US Census Bureau, USDA,
nal Great American Furniture anal Blvd Mobil Marshall's o Repair Gun Oreg Water Distribution Map - No Aerial 2285 S Hwy 97, Redmond Sources: Esri, Airbus DS, USGS, NGA, NASA, CGIAR, N Robinson, NCEAS, NLS, OS, NMA, Geodatastyrelsen, Rijkswaterstaat, GSA, Geoland, FEMA, REDMOND TAXLOTS STREET CENTERLINE WATER LATERAL Commercial Domestic Fire HydrantLaterals GRAVITY MAIN SYSTEM VALVE METER HYDRANT 3/12/2024, 10:09:30 AM 0 0.03 0.05 0.01 mi 0 0.04 0.08 0.02 km 1:2,257 Web AppBuilder for ArcGIS Esri Community Maps Contributors, Oregon State Parks, State of Oregon GEO, © OpenStreetMap, Microsoft, Esri, TomTom, Garmin, SafeGraph, GeoTechnologies, Inc, METI/NASA, USGS, Bureau of Land Management, EPA, NPS, US Census Bureau, USDA,

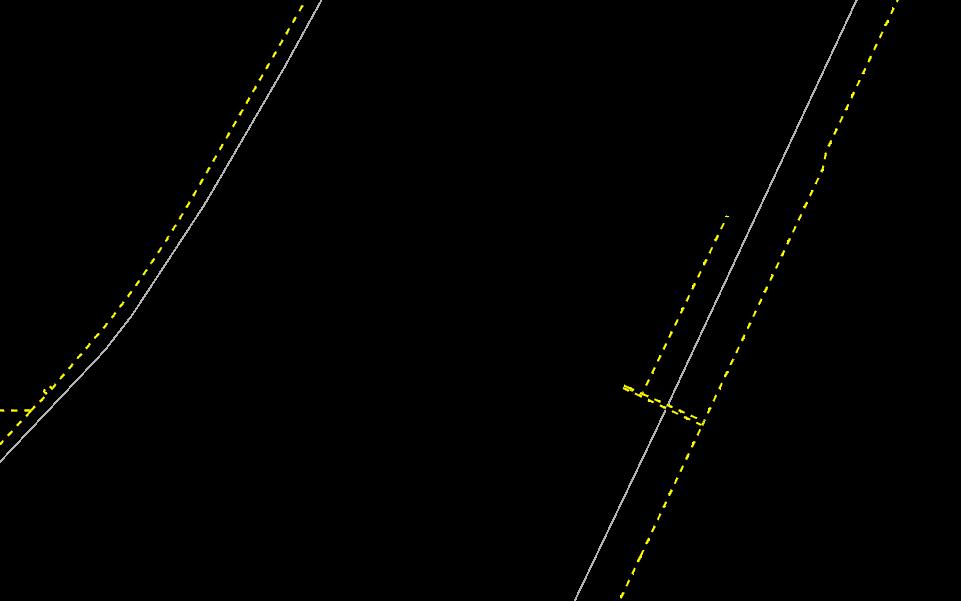
nal Great American Furniture anal Blvd Mobil Marshall's o Repair un Oreg Waste Water Collection - 2285 S Hwy 97, Redmond Sources: Esri, Airbus DS, USGS, NGA, NASA, CGIAR, N Robinson, NCEAS, NLS, OS, NMA, Geodatastyrelsen, Rijkswaterstaat, GSA, Geoland, FEMA, COLLECTION MAIN SERVICE LATERAL MANHOLE REDMOND TAXLOTS STREET CENTERLINE 3/12/2024, 10:13:10 AM 0 0.03 0.05 0.01 mi 0 0.04 0.08 0.02 km 1:2,257 Web AppBuilder for ArcGIS Esri Community Maps Contributors, Oregon State Parks, State of Oregon GEO, © OpenStreetMap, Microsoft, Esri, TomTom, Garmin, SafeGraph, GeoTechnologies, Inc, METI/NASA, USGS, Bureau of Land Management, EPA, NPS, US Census Bureau, USDA,
nal Great American Furniture anal Blvd Mobil Marshall's o Repair Gun Oreg Waste Water Collection - No Aerial 2285 S Hwy 97, Redmond Sources: Esri, Airbus DS, USGS, NGA, NASA, CGIAR, N Robinson, NCEAS, NLS, OS, NMA, Geodatastyrelsen, Rijkswaterstaat, GSA, Geoland, FEMA, COLLECTION MAIN SERVICE LATERAL MANHOLE REDMOND TAXLOTS STREET CENTERLINE 3/12/2024, 10:11:12 AM 0 0.03 0.05 0.01 mi 0 0.04 0.08 0.02 km 1:2,257 Web AppBuilder for ArcGIS Esri Community Maps Contributors, Oregon State Parks, State of Oregon GEO, © OpenStreetMap, Microsoft, Esri, TomTom, Garmin, SafeGraph, GeoTechnologies, Inc, METI/NASA, USGS, Bureau of Land Management, EPA, NPS, US Census Bureau, USDA,

nal Great American Furniture anal Blvd Mobil Marshall's o Repair un Oreg Storm Water - 2285 S Hwy 97, Redmond Sources: Esri, Airbus DS, USGS, NGA, NASA, CGIAR, N Robinson, NCEAS, NLS, OS, NMA, Geodatastyrelsen, Rijkswaterstaat, GSA, Geoland, FEMA, STORM PIPE ACCESS POINTS SEDIMENTATION MANHOLE STORM UIC FACILITIES DRILL HOLE DRYWELL CATCH BASINS CURB INLET REDMOND TAXLOTS STREET CENTERLINE 3/12/2024, 10:53:48 AM 0 0.03 0.05 0.01 mi 0 0.04 0.08 0.02 km 1:2,257 Web AppBuilder for ArcGIS Esri Community Maps Contributors, Oregon State Parks, State of Oregon GEO, © OpenStreetMap, Microsoft, Esri, TomTom, Garmin, SafeGraph, GeoTechnologies, Inc, METI/NASA, USGS, Bureau of Land Management, EPA, NPS, US Census Bureau, USDA,
nal Great American Furniture anal Blvd Mobil Marshall's o Repair Gun Oreg Storm Water No Aerial - 2285 S Hwy 97, Redmond Sources: Esri, Airbus DS, USGS, NGA, NASA, CGIAR, N Robinson, NCEAS, NLS, OS, NMA, Geodatastyrelsen, Rijkswaterstaat, GSA, Geoland, FEMA, STORM PIPE ACCESS POINTS SEDIMENTATION MANHOLE STORM UIC FACILITIES DRILL HOLE DRYWELL CATCH BASINS CURB INLET REDMOND TAXLOTS STREET CENTERLINE 3/12/2024, 10:54:48 AM 0 0.03 0.05 0.01 mi 0 0.04 0.08 0.02 km 1:2,257 Web AppBuilder for ArcGIS Esri Community Maps Contributors, Oregon State Parks, State of Oregon GEO, © OpenStreetMap, Microsoft, Esri, TomTom, Garmin, SafeGraph, GeoTechnologies, Inc, METI/NASA, USGS, Bureau of Land Management, EPA, NPS, US Census Bureau, USDA,
nal Great American Furniture anal Blvd Mobil Marshall's o Repair un Oreg Natural Gas - 2285 S Hwy 97, Redmond Sources: Esri, Airbus DS, USGS, NGA, NASA, CGIAR, N Robinson, NCEAS, NLS, OS, NMA, Geodatastyrelsen, Rijkswaterstaat, GSA, Geoland, FEMA, NATURAL GAS REDMOND TAXLOTS STREET CENTERLINE 3/12/2024, 10:56:26 AM 0 0.03 0.05 0.01 mi 0 0.04 0.08 0.02 km 1:2,257 Web AppBuilder for ArcGIS Esri Community Maps Contributors, Oregon State Parks, State of Oregon GEO, © OpenStreetMap, Microsoft, Esri, TomTom, Garmin, SafeGraph, GeoTechnologies, Inc, METI/NASA, USGS, Bureau of Land Management, EPA, NPS, US Census Bureau, USDA,
nal Great American Furniture anal Blvd Mobil Marshall's o Repair Gun Oreg Natural Gas No Aerial - 2285 S Hwy 97, Redmond Sources: Esri, Airbus DS, USGS, NGA, NASA, CGIAR, N Robinson, NCEAS, NLS, OS, NMA, Geodatastyrelsen, Rijkswaterstaat, GSA, Geoland, FEMA, NATURAL GAS REDMOND TAXLOTS STREET CENTERLINE 3/12/2024, 10:55:38 AM 0 0.03 0.05 0.01 mi 0 0.04 0.08 0.02 km 1:2,257 Web AppBuilder for ArcGIS Esri Community Maps Contributors, Oregon State Parks, State of Oregon GEO, © OpenStreetMap, Microsoft, Esri, TomTom, Garmin, SafeGraph, GeoTechnologies, Inc, METI/NASA, USGS, Bureau of Land Management, EPA, NPS, US Census Bureau, USDA,

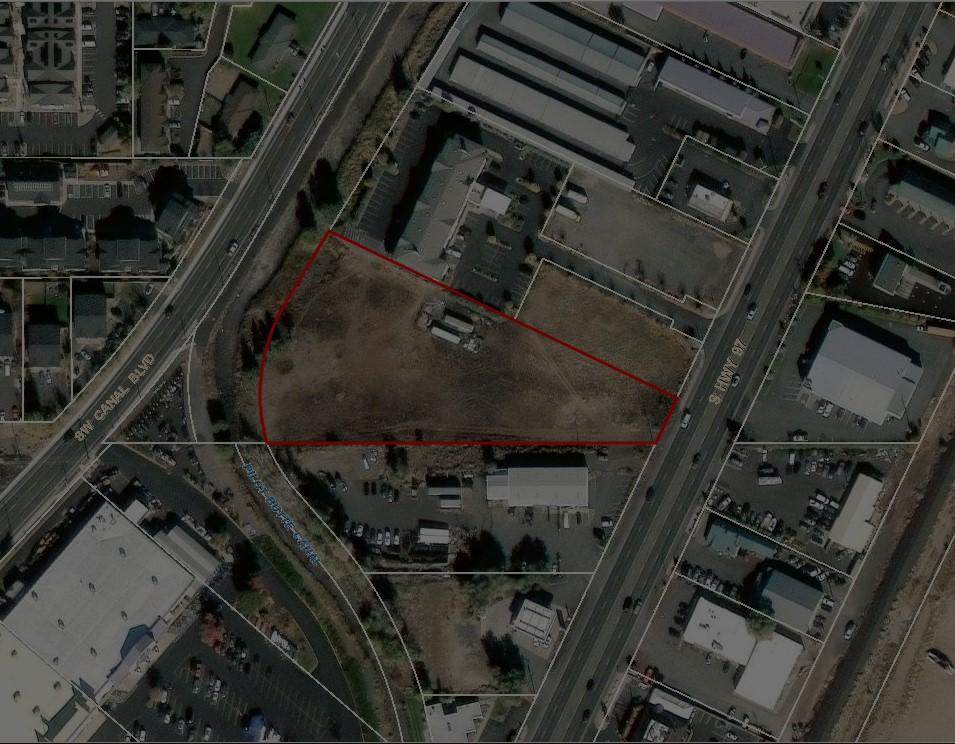
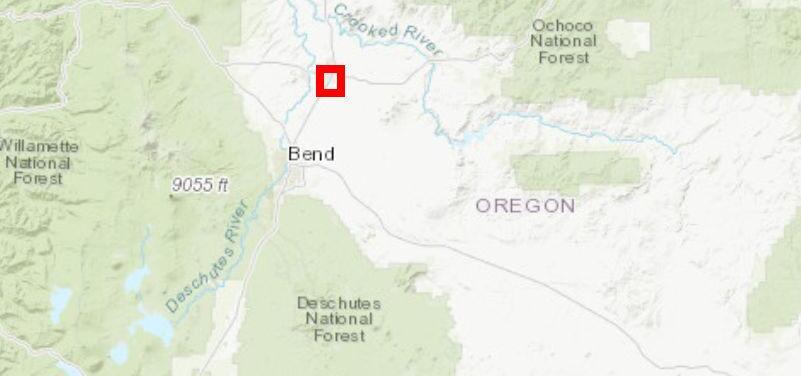
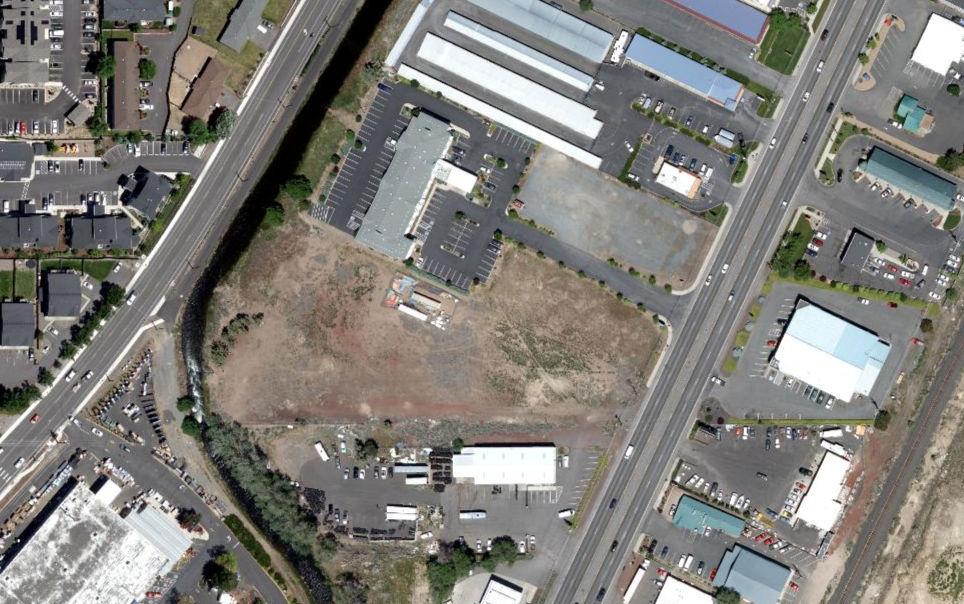
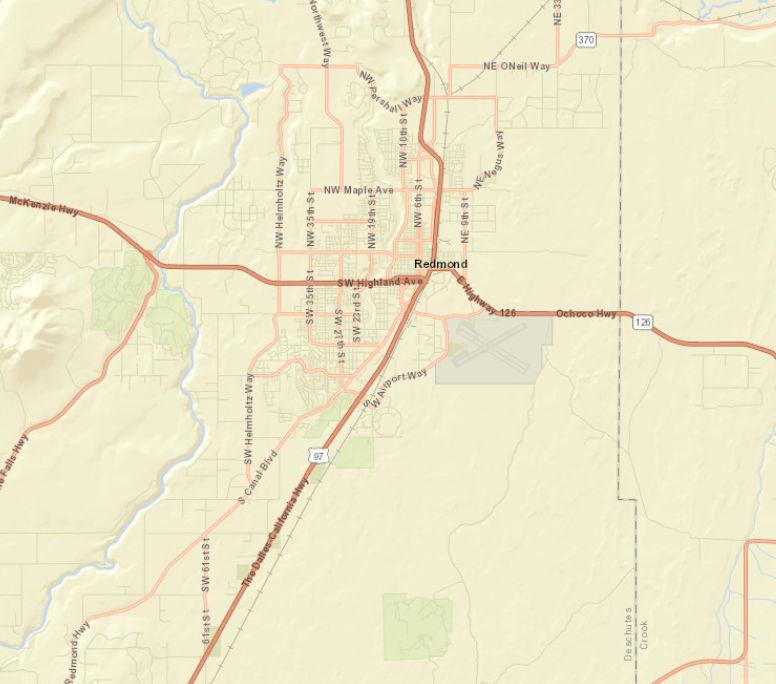
Site Map
2285 S Highway 97, Redmond, Oregon, 97756
Rings: 1, 3, 5 mile radii
Prepared by Esri
Latitude: 44.25508
Longitude: -121.18385
0 mi
March 12, 2024 ©2024 Esri Page 1 of 1

ACS Population Summary
2285 S Highway 97, Redmond, Oregon, 97756 Prepared by Esri Ring: 1 mile radius Latitude: 44.25508 Longitude: -121.18385 2017-2021 ACS Estimate Percent MOE(±) Reliability TOTALS Total Population 7,613 656 Total Households 2,874 219 Total Housing Units 2,952 218 POPULATION AGE 3+ YEARS BY SCHOOL ENROLLMENT Total 7,324 100.0% 626 Enrolled in school 1,584 21 6% 255 Enrolled in nursery school, preschool 48 0.7% 96 Public school 41 0.6% 110 Private school 8 0 1% 55 Enrolled in kindergarten 89 1.2% 53 Public school 85 1.2% 53 Private school 4 0.1% 8 Enrolled in grade 1 to grade 4 590 8.1% 231 Public school 317 4.3% 102 Private school 273 3 7% 275 Enrolled in grade 5 to grade 8 283 3.9% 90 Public school 269 3 7% 92 Private school 13 0.2% 74 Enrolled in grade 9 to grade 12 363 5 0% 107 Public school 327 4.5% 99 Private school 36 0.5% 43 Enrolled in college undergraduate years 169 2.3% 90 Public school 122 1.7% 56 Private school 47 0.6% 73 Enrolled in graduate or professional school 42 0 6% 47 Public school 14 0.2% 22 Private school 28 0.4% 41 Not enrolled in school 5,740 78.4% 401 POPULATION AGE 65+ BY RELATIONSHIP AND HOUSEHOLD TYPE Total 724 100.0% 141 Living in Households 679 93 8% 137 Living in Family Households 288 39.8% 103 Householder 156 21 5% 63 Spouse 114 15 7% 64 Parent 3 0.4% 5 Parent-in-law 0 0 0% 0 Other Relative 8 1.1% 52 Nonrelative 7 1 0% 43 Living in Nonfamily Households 391 54 0% 126 Householder 380 52.5% 125 Nonrelative 12 1.7% 21 Living in Group Quarters 44 6 1% 38 Source: U.S. Census Bureau, 2017-2021 American Community Survey Reliability: high medium low March 12, 2024 ©2024 Esri Page 1 of 24
ACS Population Summary
2285 S Highway 97, Redmond, Oregon, 97756 Prepared by Esri Ring: 1 mile radius Latitude: 44.25508 Longitude: -121.18385 2017-2021 ACS Estimate Percent MOE(±) Reliability HOUSEHOLDS BY TYPE AND SIZE Family Households 1,571 54 7% 193 2-Person 525 18.3% 124 3-Person 309 10 8% 115 4-Person 419 14 6% 114 5-Person 107 3 7% 62 6-Person 154 5.4% 142 7+ Person 57 2.0% 66 Nonfamily Households 1,303 45 3% 198 1-Person 942 32 8% 175 2-Person 264 9.2% 121 3-Person 61 2.1% 39 4-Person 36 1.3% 62 5-Person 0 0.0% 0 6-Person 0 0.0% 0 7+ Person 0 0.0% 0 HOUSEHOLDS BY PRESENCE OF PEOPLE UNDER 18 YEARS BY HOUSEHOLD TYPE Households with one or more people under 18 years 949 33.0% 149 Family households 938 32.6% 148 Married-couple family 667 23.2% 127 Male householder, no wife present 68 2.4% 53 Female householder, no husband present 202 7.0% 103 Nonfamily households 11 0.4% 19 Households with no people under 18 years 1,925 67.0% 202 Married-couple family 520 18.1% 119 Other family 113 3.9% 68 Nonfamily households 1,292 45.0% 198 HOUSEHOLDS BY PRESENCE OF PEOPLE 65 YEARS AND OVER, HOUSEHOLD SIZE AND HOUSEHOLD TYPE Households with Pop 65+ 626 21.8% 130 1-Person 381 13.3% 125 2+ Person Family 234 8.1% 76 2+ Person Nonfamily 11 0.4% 23 Households with No Pop 65+ 2,249 78.3% 226 1-Person 561 19.5% 152 2+ Person Family 1,337 46.5% 184 2+ Person Nonfamily 350 12.2% 120 HOUSEHOLD TYPE BY RELATIVES AND NONRELATIVES FOR POPULATION IN HOUSEHOLDS POPULATION IN HOUSEHOLDS Total 7,556 100.0% 656 In Family Households 5,753 76 1% 701 In Married-Couple Family 4,538 60 1% 694 Relatives 4,483 59 3% 684 Nonrelatives 55 0.7% 41 In Male Householder-No Spouse Present-Family 419 5.5% 283 Relatives 192 2 5% 106 Nonrelatives 227 3.0% 226 In Female Householder-No Spouse Present-Family 795 10 5% 328 Relatives 759 10.0% 308 Nonrelatives 36 0.5% 43 In Nonfamily Households 1,804 23 9% 273 Source: U.S. Census Bureau, 2017-2021 American Community Survey Reliability: high medium low March 12, 2024 ©2024 Esri Page 2 of 24
ACS Population Summary
2285 S Highway 97, Redmond, Oregon, 97756 Prepared
Esri Ring: 1 mile radius Latitude: 44.25508 Longitude: -121.18385 2017-2021 ACS Estimate Percent MOE(±) Reliability POPULATION AGE 5+ YEARS BY LANGUAGE SPOKEN AT HOME AND ABILITY TO SPEAK ENGLISH Total 7,053 100.0% 605 5 to 17 years Speak only English 1,052 14 9% 286 Speak Spanish 361 5.1% 154 Speak English "very well" or "well" 361 5.1% 154 Speak English "not well" 0 0.0% 0 Speak English "not at all" 0 0 0% 0 Speak other Indo-European languages 0 0.0% 0 Speak English "very well" or "well" 0 0.0% 0 Speak English "not well" 0 0.0% 0 Speak English "not at all" 0 0 0% 0 Speak Asian and Pacific Island languages 2 0.0% 31 Speak English "very well" or "well" 0 0.0% 0 Speak English "not well" 2 0.0% 31 Speak English "not at all" 0 0 0% 0 Speak other languages 0 0.0% 0 Speak English "very well" or "well" 0 0.0% 0 Speak English "not well" 0 0.0% 0 Speak English "not at all" 0 0 0% 0 18 to 64 years Speak only English 3,983 56.5% 421 Speak Spanish 736 10 4% 214 Speak English "very well" or "well" 422 6 0% 150 Speak English "not well" 227 3.2% 151 Speak English "not at all" 87 1 2% 121 Speak other Indo-European languages 124 1.8% 160 Speak English "very well" or "well" 124 1 8% 159 Speak English "not well" 0 0.0% 0 Speak English "not at all" 0 0 0% 0 Speak Asian and Pacific Island languages 71 1.0% 70 Speak English "very well" or "well" 56 0.8% 57 Speak English "not well" 15 0.2% 26 Speak English "not at all" 0 0 0% 0 Speak other languages 0 0.0% 0 Speak English "very well" or "well" 0 0.0% 0 Speak English "not well" 0 0.0% 0 Speak English "not at all" 0 0 0% 0 65 years and over Speak only English 723 10 3% 141 Speak Spanish 0 0.0% 0 Speak English "very well" or "well" 0 0.0% 0 Speak English "not well" 0 0.0% 0 Speak English "not at all" 0 0 0% 0 Speak other Indo-European languages 0 0.0% 0 Speak English "very well" or "well" 0 0.0% 0 Speak English "not well" 0 0.0% 0 Speak English "not at all" 0 0 0% 0 Speak Asian and Pacific Island languages 1 0.0% 8 Speak English "very well" or "well" 1 0.0% 8 Speak English "not well" 0 0.0% 0 Speak English "not at all" 0 0 0% 0 Speak other languages 0 0.0% 0 Speak English "very well" or "well" 0 0.0% 0 Speak English "not well" 0 0.0% 0 Speak English "not at all" 0 0 0% 0 Source: U.S. Census Bureau, 2017-2021 American Community Survey Reliability: high medium low March 12, 2024 ©2024 Esri Page 3 of 24
by
ACS Population Summary
2285
Prepared by Esri
44.25508
S Highway 97,
97756
Ring:
mile radius Latitude:
Longitude:
2017-2021 ACS Estimate Percent MOE(±) Reliability WORKERS AGE 16+ YEARS BY PLACE OF WORK Total 3,678 100.0% 364 Worked in state and in county of residence 3,385 92.0% 321 Worked in state and outside county of residence 252 6 9% 110 Worked outside state of residence 41 1.1% 43 SEX BY CLASS OF WORKER FOR THE CIVILIAN EMPLOYED POPULATION 16 YEARS AND OVER Total: 3,779 100.0% 366 Male: 1,921 50 8% 267 Employee of private company workers 1,374 36 4% 211 Self-employed in own incorporated business workers 84 2.2% 52 Private not-for-profit wage and salary workers 113 3.0% 87 Local government workers 71 1.9% 60 State government workers 62 1.6% 49 Federal government workers 56 1.5% 47 Self-employed in own not incorporated business workers 161 4 3% 93 Unpaid family workers 0 0.0% 0 Female: 1,858 49 2% 216 Employee of private company workers 1,156 30 6% 163 Self-employed in own incorporated business workers 98 2.6% 69 Private not-for-profit wage and salary workers 288 7.6% 127 Local government workers 133 3.5% 60 State government workers 74 2.0% 100 Federal government workers 12 0.3% 21 Self-employed in own not incorporated business workers 95 2.5% 59 Unpaid family workers 0 0 0% 0 POPULATION IN HOUSEHOLDS AND PRESENCE OF A COMPUTER Total 7,556 100.0% 656 Population <18 in Households 1,975 26 1% 318 Have a Computer 1,863 24 7% 380 Have NO Computer 112 1.5% 147 Population 18-64 in Households 4,901 64 9% 461 Have a Computer 4,787 63 4% 473 Have NO Computer 114 1.5% 80 Population 65+ in Households 679 9 0% 137 Have a Computer 575 7.6% 132 Have NO Computer 104 1 4% 61 HOUSEHOLDS AND INTERNET SUBSCRIPTIONS Total 2,874 100.0% 219 With an Internet Subscription 2,639 91.8% 227 Dial-Up Alone 35 1 2% 65 Broadband 2,019 70 3% 224 Satellite Service 188 6.5% 66 Other Service 33 1 1% 31 Internet Access with no Subscription 2 0.1% 9 With No Internet Access 233 8 1% 79 Source: U.S. Census Bureau, 2017-2021 American Community Survey Reliability: high medium low March 12, 2024 ©2024 Esri Page 4 of 24
Redmond, Oregon,
1
-121.18385
ACS Population Summary
2285 S Highway 97, Redmond, Oregon, 97756
Prepared by Esri Ring: 1 mile radius
44.25508
-121.18385
2017-2021 ACS Estimate Percent MOE(±) Reliability WORKERS AGE 16+ YEARS BY MEANS OF TRANSPORTATION TO WORK Total 3,678 100.0% 364 Drove alone 2,829 76 9% 321 Carpooled 415 11 3% 127 Public transportation (excluding taxicab) 27 0.7% 40 Bus or trolley bus 27 0.7% 40 Light rail, streetcar or trolley 0 0.0% 0 Subway or elevated 0 0.0% 0 Long-distance/Commuter Train 0 0.0% 0 Ferryboat 0 0.0% 0 Taxicab 6 0.2% 73 Motorcycle 0 0.0% 0 Bicycle 14 0.4% 22 Walked 56 1.5% 40 Other means 35 1.0% 34 Worked at home 295 8 0% 91 WORKERS AGE 16+ YEARS (WHO DID NOT WORK FROM HOME) BY TRAVEL TIME TO WORK Total 3,383 100.0% 354 Less than 5 minutes 193 5.7% 100 5 to 9 minutes 752 22.2% 158 10 to 14 minutes 526 15 5% 128 15 to 19 minutes 212 6 3% 74 20 to 24 minutes 403 11 9% 151 25 to 29 minutes 338 10 0% 123 30 to 34 minutes 651 19.2% 134 35 to 39 minutes 96 2 8% 73 40 to 44 minutes 77 2.3% 52 45 to 59 minutes 68 2 0% 46 60 to 89 minutes 10 0.3% 28 90 or more minutes 59 1 7% 47 Average Travel Time to Work (in minutes) N/A N/A FEMALES AGE 20-64 YEARS BY AGE OF OWN CHILDREN AND EMPLOYMENT STATUS Total 2,626 100.0% 246 Own children under 6 years only 164 6.2% 79 In labor force 129 4 9% 77 Not in labor force 35 1.3% 46 Own children under 6 years and 6 to 17 years 273 10 4% 125 In labor force 129 4.9% 59 Not in labor force 145 5 5% 162 Own children 6 to 17 years only 405 15.4% 100 In labor force 256 9 7% 81 Not in labor force 148 5.6% 69 No own children under 18 years 1,784 67 9% 228 In labor force 1,417 54.0% 213 Not in labor force 367 14 0% 114 Source: U.S. Census Bureau, 2017-2021 American Community Survey Reliability: high medium low March 12, 2024 ©2024 Esri Page 5 of 24
Latitude:
Longitude:
ACS Population Summary
2285 S Highway 97, Redmond, Oregon, 97756 Prepared by Esri Ring: 1 mile radius Latitude: 44.25508 Longitude: -121.18385 2017-2021 ACS Estimate Percent MOE(±) Reliability CIVILIAN NONINSTITUTIONALIZED POPULATION BY AGE & TYPES OHEALINSURANCE COVERAGE OF HEALTH INSURANCE COVERAGE Total 7,581 100.0% 655 Under 19 years: 2,024 26 7% 373 One Type of Health Insurance: 1,928 25 4% 371 Employer-Based Health Ins Only 397 5.2% 175 Direct-Purchase Health Ins Only 63 0 8% 50 Medicare Coverage Only 0 0.0% 0 Medicaid Coverage Only 1,468 19 4% 403 TRICARE/Military Hlth Cov Only 0 0.0% 0 VA Health Care Only 0 0.0% 0 2+ Types of Health Insurance 62 0.8% 102 No Health Insurance Coverage 34 0.4% 62 19 to 34 years: 1,630 21.5% 268 One Type of Health Insurance: 1,215 16.0% 227 Employer-Based Health Ins Only 922 12 2% 203 Direct-Purchase Health Ins Only 7 0.1% 20 Medicare Coverage Only 0 0.0% 0 Medicaid Coverage Only 273 3 6% 114 TRICARE/Military Hlth Cov Only 5 0.1% 43 VA Health Care Only 8 0 1% 14 2+ Types of Health Insurance 134 1.8% 114 No Health Insurance Coverage 281 3 7% 134 35 to 64 years: 3,231 42 6% 336 One Type of Health Insurance: 2,083 27 5% 259 Employer-Based Health Ins Only 1,274 16 8% 213 Direct-Purchase Health Ins Only 360 4 7% 154 Medicare Coverage Only 58 0.8% 46 Medicaid Coverage Only 343 4 5% 100 TRICARE/Military Hlth Cov Only 5 0.1% 29 VA Health Care Only 43 0 6% 60 2+ Types of Health Insurance 524 6.9% 162 No Health Insurance Coverage 624 8.2% 219 65+ years: 696 9.2% 137 One Type of Health Insurance: 198 2.6% 87 Employer-Based Health Ins Only 41 0.5% 49 Direct-Purchase Health Ins Only 0 0.0% 0 Medicare Coverage Only 157 2.1% 81 TRICARE/Military Hlth Cov Only 0 0 0% 0 VA Health Care Only 0 0.0% 0 2+ Types of Health Insurance: 498 6 6% 131 Employer-Based & Direct-Purchase Health Insurance 0 0.0% 0 Employer-Based Health & Medicare Insurance 51 0.7% 46 Direct-Purchase Health & Medicare Insurance 157 2.1% 89 Medicare & Medicaid Coverage 68 0.9% 35 Other Private Health Insurance Combos 0 0.0% 0 Other Public Health Insurance Combos 22 0.3% 31 Other Health Insurance Combinations 200 2.6% 108 No Health Insurance Coverage 1 0.0% 8 Source: U.S. Census Bureau, 2017-2021 American Community Survey Reliability: high medium low March 12, 2024 ©2024 Esri Page 6 of 24
ACS Population Summary
2285 S Highway 97, Redmond, Oregon, 97756
Prepared by Esri Ring: 1 mile radius
Latitude: 44.25508 Longitude: -121.18385
2017-2021 ACS Estimate Percent MOE(±) Reliability POPULATION BY RATIO OF INCOME TO POVERTY LEVEL Total 7,522 100.0% 652 Under 50 393 5.2% 225 50 to 99 319 4 2% 163 1 00 to 1 24 218 2.9% 175 1 25 to 1 49 372 4 9% 155 1 50 to 1 84 1,143 15 2% 471 1 85 to 1 99 114 1 5% 145 2 00 and over 4,962 66 0% 576 CIVILIAN POPULATION AGE 18 OR OLDER BY VETERAN STATUS Total 5,638 100.0% 446 Veteran 316 5.6% 113 Nonveteran 5,322 94.4% 433 Male 2,524 44 8% 300 Veteran 282 5 0% 125 Nonveteran 2,242 39 8% 294 Female 3,114 55 2% 244 Veteran 34 0.6% 67 Nonveteran 3,080 54 6% 245 CIVILIAN VETERANS AGE 18 OR OLDER BY PERIOD OF MILITARY SERVICE Total 316 100.0% 113 Gulf War (9/01 or later), no Gulf War (8/90 to 8/01), no Vietnam Era 123 38 9% 124 Gulf War (9/01 or later) and Gulf War (8/90 to 8/01), no Vietnam Era 25 7.9% 22 Gulf War (9/01 or later), and Gulf War (8/90 to 8/01), and Vietnam Era 0 0.0% 0 Gulf War (8/90 to 8/01), no Vietnam Era 47 14.9% 63 Gulf War (8/90 to 8/01) and Vietnam Era 0 0.0% 0 Vietnam Era, no Korean War, no World War II 98 31.0% 58 Vietnam Era and Korean War, no World War II 0 0.0% 0 Vietnam Era and Korean War and World War II 0 0.0% 0 Korean War, no Vietnam Era, no World War II 0 0.0% 0 Korean War and World War II, no Vietnam Era 0 0 0% 0 World War II, no Korean War, no Vietnam Era 5 1.6% 52 Between Gulf War and Vietnam Era only 18 5.7% 25 Between Vietnam Era and Korean War only 0 0.0% 0 Between Korean War and World War II only 0 0.0% 0 Pre-World War II only 0 0.0% 0 HOUSEHOLDS BY POVERTY STATUS Total 2,874 100.0% 219 Income in the past 12 months below poverty level 279 9.7% 98 Married-couple family 36 1.3% 32 Other family - male householder (no wife present) 0 0.0% 0 Other family - female householder (no husband present) 87 3.0% 55 Nonfamily household - male householder 28 1.0% 24 Nonfamily household - female householder 128 4.5% 78 Income in the past 12 months at or above poverty level 2,595 90 3% 210 Married-couple family 1,151 40 0% 168 Other family - male householder (no wife present) 93 3.2% 52 Other family - female householder (no husband present) 204 7.1% 107 Nonfamily household - male householder 356 12.4% 109 Nonfamily household - female householder 790 27 5% 165 Poverty Index 78 Source: U.S. Census Bureau, 2017-2021 American Community Survey Reliability: high medium low March 12, 2024 ©2024 Esri Page 7 of 24
ACS Population Summary
2285 S Highway 97, Redmond, Oregon, 97756
Prepared by Esri Ring: 1 mile radius Latitude: 44.25508
-121.18385
Data Note: N/A means not available Population by Ratio of Income to Poverty Level represents persons for whom poverty status is determined. Household income represents income in 2021, adjusted for inflation
2017-2021 ACS Estimate: The American Community Survey (ACS) replaces census sample data. Esri is releasing the 2017-2021 ACS estimates, five-year period data collected monthly from January 1, 2017 through December 31, 2021. Although the ACS includes many of the subjects previously covered by the decennial census sample, there are significant differences between the two surveys including fundamental differences in survey design and residency rules
Margin of error (MOE): The MOE is a measure of the variability of the estimate due to sampling error. MOEs enable the data user to measure the range of uncertainty for each estimate with 90 percent confidence. The range of uncertainty is called the confidence interval, and it is calculated by taking the estimate +/- the MOE. For example, if the ACS reports an estimate of 100 with an MOE of +/- 20, then you can be 90 percent certain the value for the whole population falls between 80 and 120.
Reliability: These symbols represent threshold values that Esri has established from the Coefficients of Variation (CV) to designate the usability of the estimates. The CV measures the amount of sampling error relative to the size of the estimate, expressed as a percentage
High Reliability: Small CVs (less than or equal to 12 percent) are flagged green to indicate that the sampling error is small relative to the estimate and the estimate is reasonably reliable.
Medium Reliability: Estimates with CVs between 12 and 40 are flagged yellow-use with caution.
Low Reliability: Large CVs (over 40 percent) are flagged red to indicate that the sampling error is large relative to the estimate. The estimate is considered very unreliable.
Source: U.S. Census Bureau, 2017-2021 American Community Survey
Reliability: high medium low
Longitude:
2017-2021 ACS Estimate Percent MOE(±) Reliability HOUSEHOLDS BY OTHER INCOME Social Security Income 733 25 5% 133 No Social Security Income 2,141 74.5% 230 Retirement Income 416 14 5% 125 No Retirement Income 2,458 85 5% 227 GROSS RENT AS A PERCENTAGE OF HOUSEHOLD INCOME IN THE PAST 12 MONTHS <10% of Income 85 5.8% 106 10-14 9% of Income 182 12 5% 76 15-19 9% of Income 207 14 2% 86 20-24 9% of Income 190 13 0% 104 25-29.9% of Income 172 11.8% 108 30-34 9% of Income 93 6.4% 58 35-39 9% of Income 164 11 3% 154 40-49 9% of Income 98 6.7% 54 50+% of Income 221 15 2% 86 Gross Rent % Inc Not Computed 45 3.1% 45 HOUSEHOLDS BY PUBLIC ASSISTANCE INCOME IN THE PAST 12 MONTHS Total 2,874 100.0% 219 With public assistance income 143 5.0% 70 No public assistance income 2,731 95.0% 220 HOUSEHOLDS BY FOOD STAMPS/SNAP STATUS Total 2,874 100.0% 219 With Food Stamps/SNAP 722 25.1% 132 With No Food Stamps/SNAP 2,152 74.9% 209 HOUSEHOLDS BY DISABILITY STATUS Total 2,874 100.0% 219 With 1+ Persons w/Disability 773 26.9% 156 With No Person w/Disability 2,101 73.1% 228
March 12, 2024 ©2024 Esri Page 8 of 24
ACS Population Summary
S Highway 97, Redmond, Oregon, 97756 Prepared
Ring: 3 mile radius Latitude:
Longitude: -121.18385 2017-2021 ACS Estimate Percent MOE(±) Reliability TOTALS Total Population 30,604 2,187 Total Households 11,699 694 Total Housing Units 11,962 707 POPULATION AGE 3+ YEARS BY SCHOOL ENROLLMENT Total 29,432 100.0% 2,118 Enrolled in school 6,445 21 9% 902 Enrolled in nursery school, preschool 411 1 4% 222 Public school 265 0.9% 178 Private school 146 0 5% 132 Enrolled in kindergarten 235 0.8% 178 Public school 230 0 8% 178 Private school 5 0.0% 9 Enrolled in grade 1 to grade 4 1,604 5.4% 476 Public school 1,172 4.0% 362 Private school 433 1 5% 318 Enrolled in grade 5 to grade 8 1,679 5.7% 379 Public school 1,508 5 1% 356 Private school 171 0.6% 116 Enrolled in grade 9 to grade 12 1,584 5 4% 431 Public school 1,480 5.0% 423 Private school 104 0 4% 82 Enrolled in college undergraduate years 794 2.7% 249 Public school 690 2.3% 229 Private school 104 0.4% 100 Enrolled in graduate or professional school 138 0 5% 79 Public school 55 0.2% 50 Private school 83 0.3% 61 Not enrolled in school 22,987 78.1% 1,267 POPULATION AGE 65+ BY RELATIONSHIP AND HOUSEHOLD TYPE Total 4,347 100.0% 496 Living in Households 4,234 97 4% 491 Living in Family Households 2,726 62 7% 444 Householder 1,458 33 5% 261 Spouse 986 22 7% 209 Parent 18 0.4% 18 Parent-in-law 89 2.0% 102 Other Relative 109 2.5% 80 Nonrelative 65 1.5% 66 Living in Nonfamily Households 1,508 34 7% 271 Householder 1,422 32.7% 251 Nonrelative 87 2.0% 73 Living in Group Quarters 112 2 6% 74 Source: U.S. Census Bureau, 2017-2021 American Community Survey Reliability: high medium low March 12, 2024 ©2024 Esri Page 9 of 24
2285
by Esri
44.25508
ACS Population Summary
2285 S Highway 97, Redmond, Oregon, 97756 Prepared by Esri Ring: 3 mile radius Latitude: 44.25508 Longitude: -121.18385 2017-2021 ACS Estimate Percent MOE(±) Reliability HOUSEHOLDS BY TYPE AND SIZE Family Households 7,381 63 1% 640 2-Person 2,755 23.5% 414 3-Person 2,151 18 4% 455 4-Person 1,376 11 8% 402 5-Person 620 5 3% 198 6-Person 376 3.2% 213 7+ Person 103 0.9% 74 Nonfamily Households 4,318 36 9% 506 1-Person 3,076 26 3% 402 2-Person 966 8.3% 327 3-Person 236 2 0% 134 4-Person 40 0.3% 64 5-Person 0 0.0% 0 6-Person 0 0.0% 0 7+ Person 0 0.0% 0 HOUSEHOLDS BY PRESENCE OF PEOPLE UNDER 18 YEARS BY HOUSEHOLD TYPE Households with one or more people under 18 years 3,781 32.3% 523 Family households 3,769 32.2% 523 Married-couple family 2,610 22.3% 488 Male householder, no wife present 441 3.8% 183 Female householder, no husband present 718 6.1% 347 Nonfamily households 12 0.1% 19 Households with no people under 18 years 7,918 67.7% 601 Married-couple family 2,850 24.4% 406 Other family 763 6.5% 269 Nonfamily households 4,306 36.8% 506 HOUSEHOLDS BY PRESENCE OF PEOPLE 65 YEARS AND OVER, HOUSEHOLD SIZE AND HOUSEHOLD TYPE Households with Pop 65+ 3,203 27.4% 337 1-Person 1,321 11.3% 250 2+ Person Family 1,773 15.2% 267 2+ Person Nonfamily 108 0.9% 73 Households with No Pop 65+ 8,496 72.6% 708 1-Person 1,755 15.0% 342 2+ Person Family 5,608 47.9% 635 2+ Person Nonfamily 1,134 9.7% 352 HOUSEHOLD TYPE BY RELATIVES AND NONRELATIVES FOR POPULATION IN HOUSEHOLDS POPULATION IN HOUSEHOLDS Total 30,404 100.0% 2,185 In Family Households 24,382 80 2% 2,191 In Married-Couple Family 18,208 59 9% 2,190 Relatives 17,979 59 1% 2,166 Nonrelatives 229 0.8% 120 In Male Householder-No Spouse Present-Family 2,035 6.7% 749 Relatives 1,395 4 6% 485 Nonrelatives 639 2.1% 368 In Female Householder-No Spouse Present-Family 4,139 13 6% 1,276 Relatives 3,757 12.4% 1,114 Nonrelatives 382 1 3% 279 In Nonfamily Households 6,022 19 8% 877 Source: U.S. Census Bureau, 2017-2021 American Community Survey Reliability: high medium low March 12, 2024 ©2024 Esri Page 10 of 24
ACS Population Summary
2285 S Highway 97, Redmond, Oregon, 97756 Prepared
Ring: 3 mile radius Latitude:
Longitude:
2017-2021 ACS Estimate Percent MOE(±) Reliability POPULATION AGE 5+ YEARS BY LANGUAGE SPOKEN AT HOME AND ABILITY TO SPEAK ENGLISH Total 28,791 100.0% 2,061 5 to 17 years Speak only English 4,249 14 8% 796 Speak Spanish 957 3.3% 464 Speak English "very well" or "well" 845 2.9% 430 Speak English "not well" 112 0.4% 113 Speak English "not at all" 0 0 0% 0 Speak other Indo-European languages 0 0.0% 0 Speak English "very well" or "well" 0 0.0% 0 Speak English "not well" 0 0.0% 0 Speak English "not at all" 0 0 0% 0 Speak Asian and Pacific Island languages 19 0.1% 35 Speak English "very well" or "well" 0 0.0% 0 Speak English "not well" 19 0.1% 35 Speak English "not at all" 0 0 0% 0 Speak other languages 0 0.0% 0 Speak English "very well" or "well" 0 0.0% 0 Speak English "not well" 0 0.0% 0 Speak English "not at all" 0 0 0% 0 18 to 64 years Speak only English 16,953 58.9% 1,452 Speak Spanish 1,849 6.4% 552 Speak English "very well" or "well" 1,236 4 3% 440 Speak English "not well" 515 1.8% 316 Speak English "not at all" 98 0 3% 122 Speak other Indo-European languages 312 1.1% 192 Speak English "very well" or "well" 312 1 1% 191 Speak English "not well" 0 0.0% 0 Speak English "not at all" 0 0 0% 0 Speak Asian and Pacific Island languages 105 0.4% 84 Speak English "very well" or "well" 88 0.3% 73 Speak English "not well" 17 0.1% 27 Speak English "not at all" 0 0 0% 0 Speak other languages 0 0.0% 0 Speak English "very well" or "well" 0 0.0% 0 Speak English "not well" 0 0.0% 0 Speak English "not at all" 0 0 0% 0 65 years and over Speak only English 3,937 13 7% 460 Speak Spanish 158 0.5% 95 Speak English "very well" or "well" 92 0.3% 93 Speak English "not well" 14 0.0% 47 Speak English "not at all" 52 0 2% 78 Speak other Indo-European languages 190 0.7% 204 Speak English "very well" or "well" 190 0 7% 210 Speak English "not well" 0 0.0% 0 Speak English "not at all" 0 0 0% 0 Speak Asian and Pacific Island languages 61 0.2% 57 Speak English "very well" or "well" 52 0.2% 67 Speak English "not well" 9 0.0% 35 Speak English "not at all" 0 0 0% 0 Speak other languages 0 0.0% 0 Speak English "very well" or "well" 0 0.0% 0 Speak English "not well" 0 0.0% 0 Speak English "not at all" 0 0 0% 0 Source: U.S. Census Bureau, 2017-2021 American Community Survey Reliability: high medium low March 12, 2024 ©2024 Esri Page 11 of 24
by Esri
44.25508
-121.18385
ACS Population Summary
2285
Prepared by Esri
44.25508
S Highway 97,
97756
Ring:
mile
Latitude:
Longitude:
2017-2021 ACS Estimate Percent MOE(±) Reliability WORKERS AGE 16+ YEARS BY PLACE OF WORK Total 15,017 100.0% 1,319 Worked in state and in county of residence 13,849 92.2% 1,311 Worked in state and outside county of residence 1,003 6 7% 349 Worked outside state of residence 165 1.1% 96 SEX BY CLASS OF WORKER FOR THE CIVILIAN EMPLOYED POPULATION 16 YEARS AND OVER Total: 15,360 100.0% 1,337 Male: 7,827 51 0% 809 Employee of private company workers 5,659 36 8% 781 Self-employed in own incorporated business workers 570 3.7% 165 Private not-for-profit wage and salary workers 238 1.5% 116 Local government workers 214 1.4% 115 State government workers 168 1 1% 98 Federal government workers 183 1.2% 88 Self-employed in own not incorporated business workers 796 5 2% 398 Unpaid family workers 0 0.0% 0 Female: 7,533 49 0% 799 Employee of private company workers 4,881 31 8% 752 Self-employed in own incorporated business workers 341 2 2% 137 Private not-for-profit wage and salary workers 932 6.1% 258 Local government workers 733 4.8% 263 State government workers 131 0.9% 103 Federal government workers 70 0.5% 73 Self-employed in own not incorporated business workers 429 2.8% 188 Unpaid family workers 15 0 1% 23 POPULATION IN HOUSEHOLDS AND PRESENCE OF A COMPUTER Total 30,404 100.0% 2,185 Population <18 in Households 7,038 23 1% 978 Have a Computer 6,924 22 8% 977 Have NO Computer 114 0.4% 149 Population 18-64 in Households 19,132 62 9% 1,537 Have a Computer 18,825 61 9% 1,545 Have NO Computer 307 1.0% 168 Population 65+ in Households 4,234 13 9% 491 Have a Computer 3,791 12.5% 476 Have NO Computer 443 1 5% 222 HOUSEHOLDS AND INTERNET SUBSCRIPTIONS Total 11,699 100.0% 694 With an Internet Subscription 10,609 90.7% 695 Dial-Up Alone 69 0 6% 76 Broadband 8,564 73 2% 716 Satellite Service 1,099 9 4% 309 Other Service 46 0 4% 41 Internet Access with no Subscription 137 1.2% 63 With No Internet Access 952 8 1% 243 Source: U.S. Census Bureau, 2017-2021 American Community Survey Reliability: high medium low March 12, 2024 ©2024 Esri Page 12 of 24
Redmond, Oregon,
3
radius
-121.18385
ACS Population Summary
2285
Prepared by Esri
44.25508
S Highway 97, Redmond,
97756
Ring: 3 mile radius Latitude:
Longitude:
2017-2021 ACS Estimate Percent MOE(±) Reliability WORKERS AGE 16+ YEARS BY MEANS OF TRANSPORTATION TO WORK Total 15,017 100.0% 1,319 Drove alone 11,677 77 8% 1,236 Carpooled 1,345 9 0% 338 Public transportation (excluding taxicab) 134 0.9% 131 Bus or trolley bus 134 0 9% 131 Light rail, streetcar or trolley 0 0.0% 0 Subway or elevated 0 0.0% 0 Long-distance/Commuter Train 0 0.0% 0 Ferryboat 0 0.0% 0 Taxicab 57 0.4% 81 Motorcycle 84 0.6% 110 Bicycle 130 0.9% 143 Walked 240 1 6% 112 Other means 194 1.3% 232 Worked at home 1,156 7 7% 341 WORKERS AGE 16+ YEARS (WHO DID NOT WORK FROM HOME) BY TRAVEL TIME TO WORK Total 13,861 100.0% 1,276 Less than 5 minutes 788 5.7% 230 5 to 9 minutes 2,477 17.9% 522 10 to 14 minutes 2,418 17 4% 550 15 to 19 minutes 1,046 7 5% 295 20 to 24 minutes 1,898 13 7% 498 25 to 29 minutes 1,913 13 8% 681 30 to 34 minutes 2,129 15.4% 430 35 to 39 minutes 320 2 3% 148 40 to 44 minutes 289 2.1% 130 45 to 59 minutes 253 1 8% 99 60 to 89 minutes 168 1.2% 131 90 or more minutes 160 1 2% 113 Average Travel Time to Work (in minutes) N/A N/A FEMALES AGE 20-64 YEARS BY AGE OF OWN CHILDREN AND EMPLOYMENT STATUS Total 9,749 100.0% 885 Own children under 6 years only 1,114 11.4% 406 In labor force 922 9 5% 378 Not in labor force 192 2.0% 153 Own children under 6 years and 6 to 17 years 597 6 1% 279 In labor force 346 3.5% 210 Not in labor force 251 2 6% 185 Own children 6 to 17 years only 1,903 19.5% 440 In labor force 1,544 15 8% 404 Not in labor force 359 3.7% 172 No own children under 18 years 6,135 62 9% 784 In labor force 4,895 50.2% 740 Not in labor force 1,241 12 7% 298 Source: U.S. Census Bureau, 2017-2021 American Community Survey Reliability: high medium low March 12, 2024 ©2024 Esri Page 13 of 24
Oregon,
-121.18385
ACS Population Summary
2285 S Highway 97, Redmond, Oregon, 97756 Prepared by Esri Ring: 3 mile radius Latitude: 44.25508 Longitude: -121.18385 2017-2021 ACS Estimate Percent MOE(±) Reliability CIVILIAN NONINSTITUTIONALIZED POPULATION BY AGE & TYPES OHEALINSURANCE COVERAGE OF HEALTH INSURANCE COVERAGE Total 30,563 100.0% 2,186 Under 19 years: 7,521 24 6% 1,020 One Type of Health Insurance: 6,883 22 5% 984 Employer-Based Health Ins Only 1,957 6.4% 489 Direct-Purchase Health Ins Only 612 2 0% 398 Medicare Coverage Only 0 0.0% 0 Medicaid Coverage Only 4,200 13 7% 843 TRICARE/Military Hlth Cov Only 113 0.4% 132 VA Health Care Only 0 0.0% 0 2+ Types of Health Insurance 518 1.7% 272 No Health Insurance Coverage 121 0.4% 99 19 to 34 years: 6,519 21.3% 981 One Type of Health Insurance: 5,129 16.8% 747 Employer-Based Health Ins Only 3,295 10 8% 579 Direct-Purchase Health Ins Only 453 1 5% 311 Medicare Coverage Only 0 0.0% 0 Medicaid Coverage Only 1,298 4 2% 411 TRICARE/Military Hlth Cov Only 73 0.2% 62 VA Health Care Only 9 0 0% 16 2+ Types of Health Insurance 739 2.4% 357 No Health Insurance Coverage 651 2 1% 321 35 to 64 years: 12,207 39 9% 1,224 One Type of Health Insurance: 8,487 27 8% 1,044 Employer-Based Health Ins Only 5,468 17 9% 939 Direct-Purchase Health Ins Only 1,155 3 8% 427 Medicare Coverage Only 192 0.6% 112 Medicaid Coverage Only 1,490 4 9% 335 TRICARE/Military Hlth Cov Only 94 0.3% 75 VA Health Care Only 89 0 3% 74 2+ Types of Health Insurance 2,085 6.8% 494 No Health Insurance Coverage 1,635 5.3% 508 65+ years: 4,316 14.1% 492 One Type of Health Insurance: 1,652 5.4% 359 Employer-Based Health Ins Only 69 0.2% 51 Direct-Purchase Health Ins Only 0 0.0% 0 Medicare Coverage Only 1,583 5.2% 358 TRICARE/Military Hlth Cov Only 0 0 0% 0 VA Health Care Only 0 0.0% 0 2+ Types of Health Insurance: 2,657 8 7% 405 Employer-Based & Direct-Purchase Health Insurance 0 0.0% 0 Employer-Based Health & Medicare Insurance 362 1 2% 131 Direct-Purchase Health & Medicare Insurance 1,073 3.5% 309 Medicare & Medicaid Coverage 239 0 8% 96 Other Private Health Insurance Combos 0 0.0% 0 Other Public Health Insurance Combos 62 0.2% 37 Other Health Insurance Combinations 921 3.0% 237 No Health Insurance Coverage 7 0.0% 13 Source: U.S. Census Bureau, 2017-2021 American Community Survey Reliability: high medium low March 12, 2024 ©2024 Esri Page 14 of 24
ACS Population Summary
2285 S Highway 97, Redmond, Oregon, 97756
Prepared by Esri Ring: 3 mile radius
Latitude: 44.25508
Longitude: -121.18385 2017-2021
ACS Estimate Percent MOE(±) Reliability POPULATION BY RATIO OF INCOME TO POVERTY LEVEL Total 30,388 100.0% 2,183 Under 50 1,121 3.7% 368 50 to 99 1,396 4 6% 414 1 00 to 1 24 1,403 4.6% 596 1 25 to 1 49 2,428 8 0% 1,018 1 50 to 1 84 2,383 7.8% 941 1 85 to 1 99 553 1 8% 518 2 00 and over 21,105 69 5% 2,029 CIVILIAN POPULATION AGE 18 OR OLDER BY VETERAN STATUS Total 23,563 100.0% 1,534 Veteran 1,977 8.4% 375 Nonveteran 21,586 91.6% 1,448 Male 10,726 45 5% 861 Veteran 1,797 7 6% 348 Nonveteran 8,929 37 9% 811 Female 12,837 54.5% 932 Veteran 180 0.8% 127 Nonveteran 12,657 53 7% 929 CIVILIAN VETERANS AGE 18 OR OLDER BY PERIOD OF MILITARY SERVICE Total 1,978 100.0% 375 Gulf War (9/01 or later), no Gulf War (8/90 to 8/01), no Vietnam Era 483 24 4% 295 Gulf War (9/01 or later) and Gulf War (8/90 to 8/01), no Vietnam Era 55 2.8% 45 Gulf War (9/01 or later), and Gulf War (8/90 to 8/01), and Vietnam Era 0 0.0% 0 Gulf War (8/90 to 8/01), no Vietnam Era 230 11.6% 133 Gulf War (8/90 to 8/01) and Vietnam Era 0 0.0% 0 Vietnam Era, no Korean War, no World War II 677 34 2% 172 Vietnam Era and Korean War, no World War II 0 0.0% 0 Vietnam Era and Korean War and World War II 0 0.0% 0 Korean War, no Vietnam Era, no World War II 52 2.6% 31 Korean War and World War II, no Vietnam Era 0 0 0% 0 World War II, no Korean War, no Vietnam Era 35 1.8% 60 Between Gulf War and Vietnam Era only 376 19 0% 137 Between Vietnam Era and Korean War only 69 3.5% 38 Between Korean War and World War II only 0 0.0% 0 Pre-World War II only 0 0.0% 0 HOUSEHOLDS BY POVERTY STATUS Total 11,699 100.0% 694 Income in the past 12 months below poverty level 1,075 9.2% 245 Married-couple family 118 1 0% 63 Other family - male householder (no wife present) 83 0.7% 86 Other family - female householder (no husband present) 208 1 8% 108 Nonfamily household - male householder 242 2.1% 139 Nonfamily household - female householder 423 3.6% 154 Income in the past 12 months at or above poverty level 10,624 90 8% 696 Married-couple family 5,342 45 7% 625 Other family - male householder (no wife present) 468 4.0% 181 Other family - female householder (no husband present) 1,162 9.9% 422 Nonfamily household - male householder 1,213 10.4% 264 Nonfamily household - female householder 2,439 20 8% 423 Poverty Index 74 Source: U.S. Census Bureau, 2017-2021 American Community Survey Reliability: high medium low March 12, 2024 ©2024 Esri Page 15 of 24
ACS Population Summary
2285 S Highway 97, Redmond, Oregon, 97756
Prepared by Esri Ring: 3 mile radius
44.25508
-121.18385
Data Note: N/A means not available Population by Ratio of Income to Poverty Level represents persons for whom poverty status is determined. Household income represents income in 2021, adjusted for inflation
2017-2021 ACS Estimate: The American Community Survey (ACS) replaces census sample data. Esri is releasing the 2017-2021 ACS estimates, five-year period data collected monthly from January 1, 2017 through December 31, 2021. Although the ACS includes many of the subjects previously covered by the decennial census sample, there are significant differences between the two surveys including fundamental differences in survey design and residency rules
Margin of error (MOE): The MOE is a measure of the variability of the estimate due to sampling error. MOEs enable the data user to measure the range of uncertainty for each estimate with 90 percent confidence. The range of uncertainty is called the confidence interval, and it is calculated by taking the estimate +/- the MOE. For example, if the ACS reports an estimate of 100 with an MOE of +/- 20, then you can be 90 percent certain the value for the whole population falls between 80 and 120.
Reliability: These symbols represent threshold values that Esri has established from the Coefficients of Variation (CV) to designate the usability of the estimates. The CV measures the amount of sampling error relative to the size of the estimate, expressed as a percentage
High Reliability: Small CVs (less than or equal to 12 percent) are flagged green to indicate that the sampling error is small relative to the estimate and the estimate is reasonably reliable.
Medium Reliability: Estimates with CVs between 12 and 40 are flagged yellow-use with caution.
Low Reliability: Large CVs (over 40 percent) are flagged red to indicate that the sampling error is large relative to the estimate. The estimate is considered very unreliable.
Source: U.S. Census Bureau, 2017-2021 American Community Survey
Reliability: high medium low
Longitude:
2017-2021 ACS Estimate Percent MOE(±) Reliability HOUSEHOLDS BY OTHER INCOME Social Security Income 3,875 33 1% 440 No Social Security Income 7,824 66.9% 678 Retirement Income 2,088 17 8% 289 No Retirement Income 9,611 82 2% 712 GROSS RENT AS A PERCENTAGE OF HOUSEHOLD INCOME IN THE PAST 12 MONTHS <10% of Income 103 2 5% 106 10-14 9% of Income 396 9.6% 224 15-19 9% of Income 567 13 8% 244 20-24 9% of Income 457 11 1% 188 25-29.9% of Income 479 11.7% 210 30-34 9% of Income 312 7.6% 152 35-39 9% of Income 401 9 8% 277 40-49 9% of Income 351 8.5% 125 50+% of Income 972 23 7% 191 Gross Rent % Inc Not Computed 71 1.7% 66 HOUSEHOLDS BY PUBLIC ASSISTANCE INCOME IN THE PAST 12 MONTHS Total 11,699 100.0% 694 With public assistance income 361 3.1% 152 No public assistance income 11,338 96.9% 696 HOUSEHOLDS BY FOOD STAMPS/SNAP STATUS Total 11,699 100.0% 694 With Food Stamps/SNAP 1,898 16.2% 327 With No Food Stamps/SNAP 9,801 83.8% 688 HOUSEHOLDS BY DISABILITY STATUS Total 11,699 100.0% 694 With 1+ Persons w/Disability 3,408 29.1% 437 With No Person w/Disability 8,291 70.9% 728
Latitude:
March 12, 2024 ©2024 Esri Page 16 of 24
ACS Population Summary
2285 S Highway 97, Redmond, Oregon, 97756 Prepared
Ring: 5 mile radius Latitude: 44.25508 Longitude: -121.18385 2017-2021 ACS Estimate Percent MOE(±) Reliability TOTALS Total Population 39,080 2,430 Total Households 15,287 857 Total Housing Units 15,968 869 POPULATION AGE 3+ YEARS BY SCHOOL ENROLLMENT Total 37,796 100.0% 2,366 Enrolled in school 7,901 20 9% 976 Enrolled in nursery school, preschool 532 1 4% 234 Public school 330 0.9% 192 Private school 202 0 5% 137 Enrolled in kindergarten 263 0.7% 179 Public school 236 0 6% 179 Private school 27 0.1% 24 Enrolled in grade 1 to grade 4 1,948 5.2% 510 Public school 1,500 4.0% 405 Private school 448 1 2% 320 Enrolled in grade 5 to grade 8 2,150 5.7% 462 Public school 1,924 5 1% 442 Private school 226 0.6% 130 Enrolled in grade 9 to grade 12 1,803 4 8% 448 Public school 1,659 4.4% 439 Private school 143 0 4% 93 Enrolled in college undergraduate years 1,061 2.8% 277 Public school 947 2.5% 260 Private school 113 0.3% 100 Enrolled in graduate or professional school 145 0 4% 83 Public school 55 0.1% 50 Private school 90 0.2% 66 Not enrolled in school 29,895 79.1% 1,474 POPULATION AGE 65+ BY RELATIONSHIP AND HOUSEHOLD TYPE Total 6,745 100.0% 716 Living in Households 6,624 98 2% 710 Living in Family Households 4,622 68 5% 601 Householder 2,411 35 7% 337 Spouse 1,804 26 7% 279 Parent 43 0.6% 38 Parent-in-law 126 1 9% 129 Other Relative 154 2.3% 98 Nonrelative 84 1.2% 82 Living in Nonfamily Households 2,002 29 7% 458 Householder 1,883 27.9% 443 Nonrelative 118 1.7% 88 Living in Group Quarters 122 1 8% 97 Source: U.S. Census Bureau, 2017-2021 American Community Survey Reliability: high medium low March 12, 2024 ©2024 Esri Page 17 of 24
by Esri
ACS Population Summary
2285 S Highway 97, Redmond, Oregon, 97756 Prepared by Esri Ring: 5 mile radius Latitude: 44.25508 Longitude: -121.18385 2017-2021 ACS Estimate Percent MOE(±) Reliability HOUSEHOLDS BY TYPE AND SIZE Family Households 9,980 65 3% 728 2-Person 4,341 28.4% 503 3-Person 2,641 17 3% 515 4-Person 1,623 10 6% 416 5-Person 828 5 4% 253 6-Person 399 2.6% 216 7+ Person 146 1.0% 92 Nonfamily Households 5,307 34 7% 679 1-Person 3,816 25 0% 580 2-Person 1,161 7.6% 365 3-Person 262 1 7% 168 4-Person 68 0.4% 73 5-Person 0 0.0% 0 6-Person 0 0.0% 0 7+ Person 0 0.0% 0 HOUSEHOLDS BY PRESENCE OF PEOPLE UNDER 18 YEARS BY HOUSEHOLD TYPE Households with one or more people under 18 years 4,542 29.7% 578 Family households 4,494 29.4% 577 Married-couple family 3,134 20.5% 534 Male householder, no wife present 566 3.7% 215 Female householder, no husband present 794 5.2% 355 Nonfamily households 48 0.3% 52 Households with no people under 18 years 10,745 70.3% 757 Married-couple family 4,502 29.4% 487 Other family 984 6.4% 309 Nonfamily households 5,259 34.4% 679 HOUSEHOLDS BY PRESENCE OF PEOPLE 65 YEARS AND OVER, HOUSEHOLD SIZE AND HOUSEHOLD TYPE Households with Pop 65+ 4,812 31.5% 535 1-Person 1,693 11.1% 430 2+ Person Family 2,909 19.0% 370 2+ Person Nonfamily 210 1.4% 136 Households with No Pop 65+ 10,475 68.5% 806 1-Person 2,123 13.9% 421 2+ Person Family 7,071 46.3% 703 2+ Person Nonfamily 1,281 8.4% 383 HOUSEHOLD TYPE BY RELATIVES AND NONRELATIVES FOR POPULATION IN HOUSEHOLDS POPULATION IN HOUSEHOLDS Total 38,856 100.0% 2,423 In Family Households 31,518 81 1% 2,412 In Married-Couple Family 24,100 62 0% 2,415 Relatives 23,730 61 1% 2,390 Nonrelatives 370 1.0% 267 In Male Householder-No Spouse Present-Family 2,473 6.4% 819 Relatives 1,826 4 7% 587 Nonrelatives 647 1.7% 368 In Female Householder-No Spouse Present-Family 4,945 12 7% 1,339 Relatives 4,512 11.6% 1,187 Nonrelatives 433 1 1% 280 In Nonfamily Households 7,338 18 9% 1,073 Source: U.S. Census Bureau, 2017-2021 American Community Survey Reliability: high medium low March 12, 2024 ©2024 Esri Page 18 of 24
ACS Population Summary
2285 S Highway 97, Redmond, Oregon, 97756 Prepared
Ring: 5 mile radius Latitude:
Longitude: -121.18385 2017-2021 ACS Estimate Percent MOE(±) Reliability POPULATION AGE 5+ YEARS BY LANGUAGE SPOKEN AT HOME AND ABILITY TO SPEAK ENGLISH Total 37,103 100.0% 2,313 5 to 17 years Speak only English 5,527 14 9% 896 Speak Spanish 957 2.6% 464 Speak English "very well" or "well" 845 2.3% 430 Speak English "not well" 112 0.3% 113 Speak English "not at all" 0 0 0% 0 Speak other Indo-European languages 5 0.0% 9 Speak English "very well" or "well" 5 0.0% 9 Speak English "not well" 0 0.0% 0 Speak English "not at all" 0 0 0% 0 Speak Asian and Pacific Island languages 19 0.1% 35 Speak English "very well" or "well" 0 0.0% 0 Speak English "not well" 19 0.1% 35 Speak English "not at all" 0 0 0% 0 Speak other languages 0 0.0% 0 Speak English "very well" or "well" 0 0.0% 0 Speak English "not well" 0 0.0% 0 Speak English "not at all" 0 0 0% 0 18 to 64 years Speak only English 21,167 57.0% 1,606 Speak Spanish 2,186 5.9% 631 Speak English "very well" or "well" 1,528 4 1% 522 Speak English "not well" 560 1.5% 336 Speak English "not at all" 98 0 3% 122 Speak other Indo-European languages 382 1.0% 230 Speak English "very well" or "well" 382 1 0% 229 Speak English "not well" 0 0.0% 0 Speak English "not at all" 0 0 0% 0 Speak Asian and Pacific Island languages 115 0.3% 84 Speak English "very well" or "well" 98 0.3% 73 Speak English "not well" 17 0.0% 27 Speak English "not at all" 0 0 0% 0 Speak other languages 0 0.0% 0 Speak English "very well" or "well" 0 0.0% 0 Speak English "not well" 0 0.0% 0 Speak English "not at all" 0 0 0% 0 65 years and over Speak only English 6,271 16 9% 683 Speak Spanish 207 0.6% 148 Speak English "very well" or "well" 119 0 3% 117 Speak English "not well" 36 0.1% 49 Speak English "not at all" 52 0 1% 78 Speak other Indo-European languages 190 0.5% 204 Speak English "very well" or "well" 190 0 5% 210 Speak English "not well" 0 0.0% 3 Speak English "not at all" 0 0 0% 0 Speak Asian and Pacific Island languages 77 0.2% 86 Speak English "very well" or "well" 53 0.1% 77 Speak English "not well" 24 0.1% 38 Speak English "not at all" 0 0 0% 0 Speak other languages 0 0.0% 0 Speak English "very well" or "well" 0 0.0% 0 Speak English "not well" 0 0.0% 0 Speak English "not at all" 0 0 0% 0 Source: U.S. Census Bureau, 2017-2021 American Community Survey Reliability: high medium low March 12, 2024 ©2024 Esri Page 19 of 24
by Esri
44.25508
ACS Population Summary
by
44.25508
-121.18385
2285 S Highway 97, Redmond, Oregon, 97756
Latitude:
Longitude:
2017-2021 ACS Estimate Percent MOE(±) Reliability WORKERS AGE 16+ YEARS BY PLACE OF WORK Total 18,854 100.0% 1,467 Worked in state and in county of residence 17,451 92.6% 1,449 Worked in state and outside county of residence 1,204 6 4% 370 Worked outside state of residence 199 1.1% 114 SEX BY CLASS OF WORKER FOR THE CIVILIAN EMPLOYED POPULATION 16 YEARS AND OVER Total: 19,265 100.0% 1,488 Male: 9,899 51 4% 900 Employee of private company workers 6,905 35 8% 837 Self-employed in own incorporated business workers 909 4.7% 295 Private not-for-profit wage and salary workers 364 1.9% 168 Local government workers 317 1.6% 142 State government workers 230 1 2% 123 Federal government workers 249 1.3% 146 Self-employed in own not incorporated business workers 922 4 8% 406 Unpaid family workers 3 0.0% 23 Female: 9,366 48 6% 890 Employee of private company workers 5,744 29 8% 817 Self-employed in own incorporated business workers 563 2 9% 191 Private not-for-profit wage and salary workers 1,277 6.6% 307 Local government workers 897 4.7% 316 State government workers 195 1.0% 121 Federal government workers 103 0 5% 84 Self-employed in own not incorporated business workers 567 2.9% 215 Unpaid family workers 20 0 1% 24 POPULATION IN HOUSEHOLDS AND PRESENCE OF A COMPUTER Total 38,856 100.0% 2,423 Population <18 in Households 8,484 21 8% 1,073 Have a Computer 8,370 21 5% 1,073 Have NO Computer 114 0.3% 149 Population 18-64 in Households 23,748 61 1% 1,705 Have a Computer 23,424 60 3% 1,714 Have NO Computer 324 0.8% 191 Population 65+ in Households 6,624 17 0% 710 Have a Computer 6,145 15.8% 638 Have NO Computer 479 1 2% 341 HOUSEHOLDS AND INTERNET SUBSCRIPTIONS Total 15,287 100.0% 857 With an Internet Subscription 14,038 91.8% 804 Dial-Up Alone 83 0 5% 82 Broadband 11,263 73 7% 813 Satellite Service 1,503 9 8% 365 Other Service 76 0 5% 59 Internet Access with no Subscription 186 1.2% 88 With No Internet Access 1,062 6 9% 407 Source: U.S. Census Bureau, 2017-2021 American Community Survey Reliability: high medium low March 12, 2024 ©2024 Esri Page 20 of 24
Prepared
Esri Ring: 5 mile radius
ACS Population Summary
Prepared by Esri
44.25508
-121.18385
Highway 97,
97756
Ring: 5 mile radius Latitude:
Longitude:
2017-2021 ACS Estimate Percent MOE(±) Reliability WORKERS AGE 16+ YEARS BY MEANS OF TRANSPORTATION TO WORK Total 18,854 100.0% 1,467 Drove alone 14,217 75 4% 1,349 Carpooled 1,771 9 4% 362 Public transportation (excluding taxicab) 134 0.7% 131 Bus or trolley bus 134 0 7% 131 Light rail, streetcar or trolley 0 0.0% 0 Subway or elevated 0 0.0% 0 Long-distance/Commuter Train 0 0.0% 0 Ferryboat 0 0.0% 0 Taxicab 57 0.3% 81 Motorcycle 98 0.5% 124 Bicycle 144 0.8% 167 Walked 311 1 6% 149 Other means 217 1.2% 232 Worked at home 1,905 10 1% 433 WORKERS AGE 16+ YEARS (WHO DID NOT WORK FROM HOME) BY TRAVEL TIME TO WORK Total 16,949 100.0% 1,391 Less than 5 minutes 900 5.3% 305 5 to 9 minutes 2,723 16.1% 551 10 to 14 minutes 2,903 17 1% 622 15 to 19 minutes 1,535 9 1% 329 20 to 24 minutes 2,313 13 6% 578 25 to 29 minutes 2,196 13 0% 721 30 to 34 minutes 2,733 16.1% 470 35 to 39 minutes 402 2 4% 170 40 to 44 minutes 477 2.8% 157 45 to 59 minutes 376 2 2% 154 60 to 89 minutes 199 1.2% 136 90 or more minutes 190 1 1% 120 Average Travel Time to Work (in minutes) N/A N/A FEMALES AGE 20-64 YEARS BY AGE OF OWN CHILDREN AND EMPLOYMENT STATUS Total 12,000 100.0% 967 Own children under 6 years only 1,198 10.0% 414 In labor force 1,001 8 3% 387 Not in labor force 197 1.6% 153 Own children under 6 years and 6 to 17 years 688 5 7% 291 In labor force 434 3.6% 226 Not in labor force 254 2 1% 185 Own children 6 to 17 years only 2,315 19.3% 498 In labor force 1,908 15 9% 464 Not in labor force 407 3.4% 179 No own children under 18 years 7,799 65 0% 848 In labor force 6,017 50.1% 799 Not in labor force 1,782 14 8% 329 Source: U.S. Census Bureau, 2017-2021 American Community Survey Reliability: high medium low March 12, 2024 ©2024 Esri Page 21 of 24
2285 S
Redmond, Oregon,
ACS Population Summary
2285 S Highway 97, Redmond, Oregon, 97756 Prepared
Ring: 5 mile radius Latitude:
Longitude:
2017-2021 ACS Estimate Percent MOE(±) Reliability CIVILIAN NONINSTITUTIONALIZED POPULATION BY AGE & TYPES OHEALINSURANCE COVERAGE OF HEALTH INSURANCE COVERAGE Total 39,030 100.0% 2,429 Under 19 years: 9,075 23 3% 1,116 One Type of Health Insurance: 8,344 21 4% 1,073 Employer-Based Health Ins Only 2,856 7.3% 654 Direct-Purchase Health Ins Only 696 1 8% 430 Medicare Coverage Only 0 0.0% 0 Medicaid Coverage Only 4,599 11 8% 880 TRICARE/Military Hlth Cov Only 193 0.5% 166 VA Health Care Only 0 0.0% 0 2+ Types of Health Insurance 587 1.5% 290 No Health Insurance Coverage 143 0.4% 114 19 to 34 years: 7,628 19.5% 1,049 One Type of Health Insurance: 6,095 15.6% 831 Employer-Based Health Ins Only 4,027 10 3% 679 Direct-Purchase Health Ins Only 539 1 4% 323 Medicare Coverage Only 0 0.0% 0 Medicaid Coverage Only 1,423 3 6% 411 TRICARE/Military Hlth Cov Only 94 0.2% 65 VA Health Care Only 13 0 0% 19 2+ Types of Health Insurance 780 2.0% 361 No Health Insurance Coverage 753 1 9% 324 35 to 64 years: 15,615 40 0% 1,369 One Type of Health Insurance: 11,327 29 0% 1,170 Employer-Based Health Ins Only 7,396 18 9% 1,029 Direct-Purchase Health Ins Only 1,678 4 3% 476 Medicare Coverage Only 220 0.6% 112 Medicaid Coverage Only 1,831 4 7% 439 TRICARE/Military Hlth Cov Only 108 0.3% 78 VA Health Care Only 93 0 2% 74 2+ Types of Health Insurance 2,455 6.3% 574 No Health Insurance Coverage 1,833 4.7% 535 65+ years: 6,712 17.2% 714 One Type of Health Insurance: 2,427 6.2% 526 Employer-Based Health Ins Only 98 0.3% 69 Direct-Purchase Health Ins Only 2 0.0% 20 Medicare Coverage Only 2,328 6.0% 523 TRICARE/Military Hlth Cov Only 0 0 0% 0 VA Health Care Only 0 0.0% 0 2+ Types of Health Insurance: 4,278 11 0% 528 Employer-Based & Direct-Purchase Health Insurance 0 0.0% 0 Employer-Based Health & Medicare Insurance 683 1 7% 205 Direct-Purchase Health & Medicare Insurance 1,860 4.8% 427 Medicare & Medicaid Coverage 325 0 8% 160 Other Private Health Insurance Combos 0 0.0% 0 Other Public Health Insurance Combos 90 0.2% 58 Other Health Insurance Combinations 1,321 3.4% 275 No Health Insurance Coverage 7 0.0% 13 Source: U.S. Census Bureau, 2017-2021 American Community Survey Reliability: high medium low March 12, 2024 ©2024 Esri Page 22 of 24
by Esri
44.25508
-121.18385
ACS Population Summary
2285 S Highway 97, Redmond, Oregon, 97756
Prepared by Esri Ring: 5 mile radius
Latitude: 44.25508
Longitude: -121.18385
2017-2021 ACS Estimate Percent MOE(±) Reliability POPULATION BY RATIO OF INCOME TO POVERTY LEVEL Total 38,776 100.0% 2,427 Under 50 1,491 3.8% 440 50 to 99 1,938 5 0% 556 1 00 to 1 24 1,540 4.0% 720 1 25 to 1 49 2,906 7 5% 1,164 1 50 to 1 84 2,588 6.7% 950 1 85 to 1 99 748 1 9% 534 2 00 and over 27,565 71 1% 2,233 CIVILIAN POPULATION AGE 18 OR OLDER BY VETERAN STATUS Total 30,586 100.0% 1,758 Veteran 2,686 8.8% 446 Nonveteran 27,900 91.2% 1,653 Male 14,160 46 3% 980 Veteran 2,450 8 0% 424 Nonveteran 11,710 38 3% 929 Female 16,426 53.7% 1,089 Veteran 236 0.8% 133 Nonveteran 16,190 52 9% 1,086 CIVILIAN VETERANS AGE 18 OR OLDER BY PERIOD OF MILITARY SERVICE Total 2,686 100.0% 446 Gulf War (9/01 or later), no Gulf War (8/90 to 8/01), no Vietnam Era 518 19 3% 301 Gulf War (9/01 or later) and Gulf War (8/90 to 8/01), no Vietnam Era 64 2.4% 45 Gulf War (9/01 or later), and Gulf War (8/90 to 8/01), and Vietnam Era 0 0.0% 0 Gulf War (8/90 to 8/01), no Vietnam Era 254 9.5% 137 Gulf War (8/90 to 8/01) and Vietnam Era 6 0.2% 19 Vietnam Era, no Korean War, no World War II 964 35 9% 230 Vietnam Era and Korean War, no World War II 3 0.1% 20 Vietnam Era and Korean War and World War II 0 0.0% 0 Korean War, no Vietnam Era, no World War II 106 3.9% 54 Korean War and World War II, no Vietnam Era 0 0 0% 0 World War II, no Korean War, no Vietnam Era 35 1.3% 60 Between Gulf War and Vietnam Era only 558 20 8% 199 Between Vietnam Era and Korean War only 177 6.6% 72 Between Korean War and World War II only 0 0.0% 0 Pre-World War II only 0 0.0% 0 HOUSEHOLDS BY POVERTY STATUS Total 15,287 100.0% 857 Income in the past 12 months below poverty level 1,395 9.1% 321 Married-couple family 229 1 5% 85 Other family - male householder (no wife present) 137 0.9% 123 Other family - female householder (no husband present) 222 1 5% 111 Nonfamily household - male householder 278 1.8% 173 Nonfamily household - female householder 529 3.5% 202 Income in the past 12 months at or above poverty level 13,892 90 9% 862 Married-couple family 7,407 48 5% 706 Other family - male householder (no wife present) 574 3.8% 217 Other family - female householder (no husband present) 1,411 9.2% 455 Nonfamily household - male householder 1,624 10.6% 363 Nonfamily household - female householder 2,877 18 8% 552 Poverty Index 74 Source: U.S. Census Bureau, 2017-2021 American Community Survey Reliability: high medium low March 12, 2024 ©2024 Esri Page 23 of 24
ACS Population Summary
2285 S Highway 97, Redmond, Oregon, 97756
Prepared by Esri Ring: 5 mile radius Latitude: 44.25508
-121.18385
Data Note: N/A means not available Population by Ratio of Income to Poverty Level represents persons for whom poverty status is determined. Household income represents income in 2021, adjusted for inflation
2017-2021 ACS Estimate: The American Community Survey (ACS) replaces census sample data. Esri is releasing the 2017-2021 ACS estimates, five-year period data collected monthly from January 1, 2017 through December 31, 2021. Although the ACS includes many of the subjects previously covered by the decennial census sample, there are significant differences between the two surveys including fundamental differences in survey design and residency rules
Margin of error (MOE): The MOE is a measure of the variability of the estimate due to sampling error. MOEs enable the data user to measure the range of uncertainty for each estimate with 90 percent confidence. The range of uncertainty is called the confidence interval, and it is calculated by taking the estimate +/- the MOE. For example, if the ACS reports an estimate of 100 with an MOE of +/- 20, then you can be 90 percent certain the value for the whole population falls between 80 and 120.
Reliability: These symbols represent threshold values that Esri has established from the Coefficients of Variation (CV) to designate the usability of the estimates. The CV measures the amount of sampling error relative to the size of the estimate, expressed as a percentage
High Reliability: Small CVs (less than or equal to 12 percent) are flagged green to indicate that the sampling error is small relative to the estimate and the estimate is reasonably reliable.
Medium Reliability: Estimates with CVs between 12 and 40 are flagged yellow-use with caution.
Low Reliability: Large CVs (over 40 percent) are flagged red to indicate that the sampling error is large relative to the estimate. The estimate is considered very unreliable.
Source: U.S. Census Bureau, 2017-2021 American Community Survey
Reliability: high medium low
2017-2021 ACS Estimate Percent MOE(±) Reliability HOUSEHOLDS BY OTHER INCOME Social Security Income 5,503 36 0% 612 No Social Security Income 9,784 64.0% 779 Retirement Income 3,353 21 9% 397 No Retirement Income 11,934 78 1% 868 GROSS RENT AS A PERCENTAGE OF HOUSEHOLD INCOME IN THE PAST 12 MONTHS <10% of Income 155 3 2% 125 10-14 9% of Income 436 9.1% 226 15-19 9% of Income 630 13 1% 246 20-24 9% of Income 485 10 1% 214 25-29.9% of Income 517 10.8% 224 30-34 9% of Income 324 6.8% 152 35-39 9% of Income 447 9 3% 277 40-49 9% of Income 506 10 6% 251 50+% of Income 1,171 24 4% 396 Gross Rent % Inc Not Computed 122 2.5% 78 HOUSEHOLDS BY PUBLIC ASSISTANCE INCOME IN THE PAST 12 MONTHS Total 15,287 100.0% 857 With public assistance income 473 3.1% 177 No public assistance income 14,814 96.9% 858 HOUSEHOLDS BY FOOD STAMPS/SNAP STATUS Total 15,287 100.0% 857 With Food Stamps/SNAP 2,218 14.5% 393 With No Food Stamps/SNAP 13,069 85.5% 859 HOUSEHOLDS BY DISABILITY STATUS Total 15,287 100.0% 857 With 1+ Persons w/Disability 4,457 29.2% 625 With No Person w/Disability 10,830 70.8% 846
Longitude:
March 12, 2024 ©2024 Esri Page 24 of 24
Market Profile
Data Note: Household population includes persons not residing in group quarters Average Household Size is the household population divided by total households Persons in families include the householder and persons related to the householder by birth, marriage, or adoption. Per Capita Income represents the income received by all persons aged 15 years and over divided by the total population.
Source: Esri forecasts for 2023 and 2028. U.S. Census Bureau 2000 and 2010 decennial Census data converted by Esri into 2020 geography.
2285 S Highway 97, Redmond, Oregon, 97756
Rings: 1, 3, 5 mile radii Latitude: 44.25508 Longitude: -121.18385 1 mile 3 miles 5 miles Population Summary 2010 Total Population 6,379 24,010 31,243 2020 Total Population 7,021 30,427 39,312 2020 Group Quarters 31 129 161 2023 Total Population 7,588 33,479 42,951 2023 Group Quarters 31 129 161 2028 Total Population 8,166 35,054 44,973 2023-2028 Annual Rate 1.48% 0.92% 0.92% 2023 Total Daytime Population 8,986 32,948 39,665 Workers 5,050 15,468 17,043 Residents 3,936 17,480 22,622 Household Summary 2010 Households 2,499 9,245 12,051 2010 Average Household Size 2.49 2.56 2.57 2020 Total Households 2,800 11,672 15,173 2020 Average Household Size 2.50 2.60 2.58 2023 Households 3,050 12,863 16,603 2023 Average Household Size 2.48 2.59 2.58 2028 Households 3,314 13,566 17,510 2028 Average Household Size 2.45 2.57 2.56 2023-2028 Annual Rate 1.67% 1.07% 1.07% 2010 Families 1,586 6,208 8,371 2010 Average Family Size 3.03 3.04 3.00 2023 Families 1,864 8,399 11,206 2023 Average Family Size 3.07 3.12 3.05 2028 Families 2,014 8,807 11,758 2028 Average Family Size 3.04 3.10 3.03 2023-2028 Annual Rate 1.56% 0.95% 0.97% Housing Unit Summary 2000 Housing Units 1,870 6,388 8,305 Owner Occupied Housing Units 49.6% 60.5% 64.4% Renter Occupied Housing Units 46.5% 33.9% 28.9% Vacant Housing Units 3.9% 5.6% 6.7% 2010 Housing Units 2,762 10,198 13,788 Owner Occupied Housing Units 37.4% 50.1% 52.9% Renter Occupied Housing Units 53.1% 40.6% 34.5% Vacant Housing Units 9.5% 9.3% 12.6% 2020 Housing Units 2,934 12,252 16,370 Owner Occupied Housing Units 43.0% 58.6% 61.7% Renter Occupied Housing Units 52.5% 36.7% 31.0% Vacant Housing Units 4.5% 4.8% 7.3% 2023 Housing Units 3,309 13,528 17,866 Owner Occupied Housing Units 36.7% 61.7% 63.9% Renter Occupied Housing Units 55.4% 33.4% 29.0% Vacant Housing Units 7.8% 4.9% 7.1% 2028 Housing Units 3,552 14,148 18,691 Owner Occupied Housing Units 37.0% 62.7% 65.0% Renter Occupied Housing Units 56.3% 33.2% 28.7% Vacant Housing Units 6.7% 4.1% 6.3%
Prepared by Esri
March 12, 2024 ©2024 Esri Page 1 of 8
Market Profile
2285 S Highway 97, Redmond, Oregon, 97756
Rings: 1, 3, 5 mile radii
Prepared by Esri
Latitude: 44.25508
Longitude: -121.18385
Data Note: Income represents the preceding year, expressed in current dollars Household income includes wage and salary earnings, interest dividends, net rents, pensions, SSI and welfare payments, child support, and alimony.
Source: Esri forecasts for 2023 and 2028. U.S. Census Bureau 2000 and 2010 decennial Census data converted by Esri into 2020 geography.
1 mile 3 miles 5 miles 2023 Households by Income Household Income Base 3,050 12,863 16,603 <$15,000 8.6% 7.6% 6.8% $15,000 - $24,999 6.7% 6.0% 5.6% $25,000 - $34,999 7.0% 5.2% 5.1% $35,000 - $49,999 13.3% 13.6% 13.5% $50,000 - $74,999 20.5% 18.4% 17.9% $75,000 - $99,999 23.7% 19.0% 18.5% $100,000 - $149,999 13.1% 21.8% 21.8% $150,000 - $199,999 4.3% 5.8% 6.7% $200,000+ 2.8% 2.7% 4.1% Average Household Income $78,800 $85,169 $91,530 2028 Households by Income Household Income Base 3,314 13,566 17,510 <$15,000 7.4% 6.6% 5.9% $15,000 - $24,999 5.3% 4.4% 4.0% $25,000 - $34,999 5.6% 4.0% 3.9% $35,000 - $49,999 12.0% 11.7% 11.2% $50,000 - $74,999 19.3% 16.9% 16.2% $75,000 - $99,999 25.4% 19.3% 18.8% $100,000 - $149,999 15.2% 25.1% 25.2% $150,000 - $199,999 6.1% 8.3% 9.5% $200,000+ 3.7% 3.6% 5.4% Average Household Income $90,446 $98,100 $106,334 2023 Owner Occupied Housing Units by Value Total 1,216 8,345 11,418 <$50,000 10.2% 2.9% 2.3% $50,000 - $99,999 10.4% 3.8% 2.8% $100,000 - $149,999 1.4% 1.5% 1.2% $150,000 - $199,999 6.6% 3.7% 2.9% $200,000 - $249,999 7.3% 3.4% 2.7% $250,000 - $299,999 10.9% 5.3% 4.5% $300,000 - $399,999 15.9% 13.6% 12.0% $400,000 - $499,999 20.9% 24.8% 25.4% $500,000 - $749,999 12.7% 36.0% 37.2% $750,000 - $999,999 2.7% 4.1% 6.1% $1,000,000 - $1,499,999 0.5% 0.5% 2.1% $1,500,000 - $1,999,999 0.5% 0.4% 0.6% $2,000,000 + 0.0% 0.0% 0.2% Average Home Value $337,706 $468,227 $511,249 2028 Owner Occupied Housing Units by Value Total 1,314 8,873 12,145 <$50,000 0.2% 0.1% 0.2% $50,000 - $99,999 2.3% 0.9% 0.7% $100,000 - $149,999 0.1% 0.0% 0.0% $150,000 - $199,999 0.4% 0.1% 0.1% $200,000 - $249,999 0.7% 0.3% 0.2% $250,000 - $299,999 0.8% 0.3% 0.2% $300,000 - $399,999 16.5% 11.6% 9.4% $400,000 - $499,999 43.9% 28.5% 27.8% $500,000 - $749,999 21.8% 49.3% 48.4% $750,000 - $999,999 10.3% 6.3% 7.8% $1,000,000 - $1,499,999 1.1% 1.0% 3.6% $1,500,000 - $1,999,999 1.8% 1.3% 1.5% $2,000,000 + 0.1% 0.1% 0.2% Average Home Value $534,996 $573,653 $605,416
March 12, 2024 ©2024 Esri Page 2 of 8
Market Profile
2285 S Highway 97, Redmond, Oregon, 97756
Rings: 1, 3, 5 mile radii
Prepared by Esri
Latitude: 44.25508
Longitude: -121.18385
Source: Esri forecasts for 2023 and 2028. U.S. Census Bureau 2000 and 2010 decennial Census data converted by Esri into 2020 geography. March 12, 2024
1 mile 3 miles 5
Median Household Income 2023 $65,297 $73,486 $76,051 2028 $75,250 $81,381 $84,696 Median Home Value 2023 $320,207 $463,892 $485,033 2028 $466,118 $541,209 $559,143 Per Capita Income 2023 $31,241 $32,735 $35,354 2028 $36,231 $37,974 $41,368 Median Age 2010 32.8 34.5 36.5 2020 34.9 37.2 39.2 2023 33.8 36.9 38.6 2028 34.0 37.0 38.7 2020 Population by Age Total 7,021 30,427 39,312 0 - 4 7.0% 6.3% 5.9% 5 - 9 7.1% 6.6% 6.3% 10 - 14 6.9% 6.9% 6.6% 15 - 24 12.4% 11.9% 11.4% 25 - 34 16.8% 15.0% 13.9% 35 - 44 13.3% 13.6% 13.1% 45 - 54 10.9% 11.2% 11.2% 55 - 64 11.1% 11.5% 12.2% 65 - 74 8.7% 10.2% 11.7% 75 - 84 4.1% 5.1% 5.9% 85 + 1.8% 1.8% 1.9% 18 + 75.5% 76.3% 77.3% 2023 Population by Age Total 7,585 33,478 42,950 0 - 4 7.5% 6.8% 6.4% 5 - 9 7.3% 7.0% 6.7% 10 - 14 6.8% 6.7% 6.7% 15 - 24 13.6% 12.5% 12.1% 25 - 34 16.8% 14.2% 13.2% 35 - 44 13.1% 13.6% 13.3% 45 - 54 10.3% 11.6% 11.8% 55 - 64 9.7% 10.9% 11.8% 65 - 74 8.3% 9.5% 10.7% 75 - 84 4.6% 5.2% 5.4% 85 + 2.1% 1.9% 1.8% 18 + 74.6% 75.5% 76.3%
Population by Age Total 8,167 35,053 44,973 0 - 4 7.8% 6.9% 6.5% 5 - 9 7.2% 6.9% 6.6% 10 - 14 7.0% 7.1% 6.9% 15 - 24 13.3% 12.2% 11.6% 25 - 34 16.3% 14.0% 13.3% 35 - 44 14.0% 13.8% 13.3% 45 - 54 10.6% 11.5% 11.7% 55 - 64 9.2% 10.2% 11.0% 65 - 74 7.8% 9.3% 10.6% 75 - 84 4.8% 6.0% 6.3% 85 + 1.9% 2.1% 2.1% 18 + 74.3% 75.2% 76.1%
miles
2028
2020 Population by Sex
©2024 Esri Page 3 of 8
Market Profile
2285 S Highway 97, Redmond, Oregon, 97756
Rings: 1, 3, 5 mile radii
Prepared by Esri
Latitude: 44.25508
Longitude: -121.18385
Data Note: Persons of Hispanic Origin may be of any race. The Diversity Index measures the probability that two people from the same area will be from different race/ethnic groups
Source: Esri forecasts for 2023 and 2028. U.S. Census Bureau 2000 and 2010 decennial Census data converted by Esri into 2020 geography.
1 mile 3 miles 5 miles Males 3,437 14,845 19,254 Females 3,584 15,582 20,058
Population by
Males 3,660 16,334 21,053 Females 3,928 17,145 21,898 2028 Population by Sex Males 3,919 17,051 21,987 Females 4,247 18,003 22,986 2010 Population by Race/Ethnicity Total 6,379 24,010 31,243 White Alone 86.7% 89.1% 90.1% Black Alone 0.3% 0.4% 0.4% American Indian Alone 1.6% 1.3% 1.2% Asian Alone 0.6% 0.7% 0.7% Pacific Islander Alone 0.1% 0.2% 0.2% Some Other Race Alone 7.8% 5.3% 4.7% Two or More Races 3.0% 3.0% 2.8% Hispanic Origin 15.4% 12.3% 11.0% Diversity Index 43.9 37.4 34.5 2020 Population by Race/Ethnicity Total 7,021 30,427 39,312 White Alone 78.9% 81.3% 82.5% Black Alone 0.9% 0.6% 0.5% American Indian Alone 1.2% 1.2% 1.1% Asian Alone 1.6% 1.2% 1.1% Pacific Islander Alone 0.2% 0.2% 0.2% Some Other Race Alone 6.8% 5.6% 5.2% Two or More Races 10.5% 10.0% 9.5% Hispanic Origin 15.7% 13.8% 12.7% Diversity Index 53.0 48.6 46.1 2023 Population by Race/Ethnicity Total 7,588 33,480 42,953 White Alone 77.9% 80.5% 81.7% Black Alone 0.8% 0.5% 0.5% American Indian Alone 1.2% 1.2% 1.1% Asian Alone 1.6% 1.2% 1.2% Pacific Islander Alone 0.2% 0.2% 0.2% Some Other Race Alone 7.2% 6.0% 5.5% Two or More Races 10.9% 10.4% 9.9% Hispanic Origin 16.7% 14.7% 13.5% Diversity Index 54.9 50.3 47.9 2028 Population by Race/Ethnicity Total 8,165 35,055 44,974 White Alone 76.6% 79.2% 80.4% Black Alone 0.8% 0.5% 0.5% American Indian Alone 1.3% 1.2% 1.1% Asian Alone 1.7% 1.3% 1.2% Pacific Islander Alone 0.2% 0.2% 0.2% Some Other Race Alone 7.9% 6.5% 6.0% Two or More Races 11.6% 11.1% 10.6% Hispanic Origin 17.8% 15.7% 14.5% Diversity Index 57.1 52.6 50.2
2023
Sex
March 12, 2024 ©2024 Esri Page 4 of 8
Market Profile
2285 S Highway 97, Redmond, Oregon, 97756
Rings: 1, 3, 5 mile radii
Prepared by Esri
Latitude: 44.25508
Longitude: -121.18385
1 mile 3 miles 5 miles
Population
Relationship
Total 7,021 30,427 39,312 In Households 99.6% 99.6% 99.6% Householder 39.5% 38.5% 38.6% Opposite-Sex Spouse 15.0% 18.5% 20.0% Same-Sex Spouse 0.1% 0.2% 0.2% Opposite-Sex Unmarried Partner 4.1% 3.5% 3.2% Same-Sex Unmarried Partner 0.1% 0.1% 0.1% Biological Child 26.6% 26.1% 25.2% Adopted Child 0.6% 0.7% 0.7% Stepchild 1.3% 1.4% 1.3% Grandchild 2.1% 1.9% 2.0% Brother or Sister 1.1% 1.0% 0.9% Parent 1.1% 1.1% 1.1% Parent-in-law 0.4% 0.3% 0.4% Son-in-law or Daughter-in-law 0.4% 0.4% 0.5% Other Relatives 1.1% 1.1% 1.0% Foster Child 0.1% 0.1% 0.1% Other Nonrelatives 6.1% 4.7% 4.4% In Group Quaters 0.4% 0.4% 0.4% Institutionalized 0.1% 0.2% 0.2% Noninstitutionalized 0.3% 0.2% 0.2% 2023 Population 25+ by Educational Attainment Total 4,916 22,409 29,256 Less than 9th Grade 7.5% 3.6% 2.9% 9th - 12th Grade, No Diploma 4.0% 5.9% 5.3% High School Graduate 20.0% 23.7% 22.9% GED/Alternative Credential 6.9% 3.8% 3.6% Some College, No Degree 24.9% 24.7% 25.5% Associate Degree 14.1% 13.0% 11.7% Bachelor's Degree 16.7% 18.2% 20.0% Graduate/Professional Degree 6.0% 7.1% 8.0% 2023 Population 15+ by Marital Status Total 5,945 26,608 34,470 Never Married 33.9% 28.7% 26.5% Married 44.2% 49.5% 52.4% Widowed 6.6% 6.2% 5.9% Divorced 15.3% 15.5% 15.2% 2023 Civilian Population 16+ in Labor Force Civilian Population 16+ 4,138 17,422 21,872 Population 16+ Employed 90.1% 93.5% 94.5% Population 16+ Unemployment rate 9.9% 6.5% 5.5% Population 16-24 Employed 12.4% 12.7% 12.5% Population 16-24 Unemployment rate 36.8% 22.9% 20.0% Population 25-54 Employed 66.2% 68.8% 67.3% Population 25-54 Unemployment rate 5.2% 2.9% 2.5% Population 55-64 Employed 14.9% 13.7% 14.7% Population 55-64 Unemployment rate 0.7% 7.2% 6.1% Population 65+ Employed 6.5% 4.8% 5.5% Population 65+ Unemployment rate 0.0% 0.8% 0.5%
2020
by
and Household Type
March 12, 2024 ©2024 Esri Page 5 of 8
Source: Esri forecasts for 2023 and 2028. U.S. Census Bureau 2000 and 2010 decennial Census data converted by Esri into 2020 geography.
Market Profile
2285
Prepared by Esri Rings: 1, 3, 5 mile radii
Latitude: 44.25508
Longitude: -121.18385
Source: Esri forecasts for 2023 and 2028. U.S. Census Bureau 2000 and 2010 decennial Census data converted by Esri into 2020 geography.
97,
S Highway
Redmond, Oregon, 97756
1 mile 3 miles 5 miles 2023 Employed Population 16+ by Industry Total 3,729 16,285 20,663 Agriculture/Mining 1.4% 1.0% 1.5% Construction 13.8% 13.6% 12.8% Manufacturing 9.1% 5.8% 5.6% Wholesale Trade 1.0% 1.6% 1.8% Retail Trade 12.7% 15.5% 14.6% Transportation/Utilities 5.7% 6.1% 6.0% Information 0.6% 0.9% 1.0% Finance/Insurance/Real Estate 2.5% 2.9% 3.3% Services 48.7% 49.8% 50.5% Public Administration 4.5% 2.9% 2.9% 2023 Employed Population 16+ by Occupation Total 3,728 16,283 20,663 White Collar 51.8% 56.2% 57.8% Management/Business/Financial 12.2% 15.1% 15.8% Professional 17.8% 18.9% 19.6% Sales 7.7% 9.6% 10.0% Administrative Support 14.2% 12.6% 12.4% Services 20.6% 19.5% 18.3% Blue Collar 27.5% 24.3% 23.9% Farming/Forestry/Fishing 0.3% 0.2% 0.2% Construction/Extraction 10.6% 8.0% 7.6% Installation/Maintenance/Repair 2.4% 2.5% 3.0% Production 6.4% 3.9% 3.8% Transportation/Material Moving 7.8% 9.8% 9.4% 2020 Households by Type Total 2,800 11,672 15,173 Married Couple Households 38.9% 48.7% 52.3% With Own Children <18 16.1% 19.2% 18.9% Without Own Children <18 22.8% 29.4% 33.5% Cohabitating Couple Households 10.2% 9.3% 8.6% With Own Children <18 4.0% 3.3% 2.9% Without Own Children <18 6.2% 6.0% 5.7% Male Householder, No Spouse/Partner 20.2% 16.0% 15.1% Living Alone 11.9% 9.8% 9.2% 65 Years and over 4 5% 3 8% 3 6% With Own Children <18 2.2% 1.7% 1.6% Without Own Children <18, With Relatives 3.1% 2.3% 2.4% No Relatives Present 3.1% 2.1% 1.9% Female Householder, No Spouse/Partner 30.7% 26.1% 23.9% Living Alone 15.0% 14.0% 12.9% 65 Years and over 7.9% 8.1% 7.6% With Own Children <18 7.0% 5.0% 4.3% Without Own Children <18, With Relatives 6.9% 5.6% 5.3% No Relatives Present 1.8% 1.4% 1.3% 2020 Households by Size Total 2,800 11,672 15,173 1 Person Household 26.9% 23.8% 22.2% 2 Person Household 31.9% 35.0% 38.0% 3 Person Household 18.2% 16.5% 16.1% 4 Person Household 11.8% 13.8% 13.4% 5 Person Household 7.4% 6.8% 6.4% 6 Person Household 2.5% 2.7% 2.6% 7 + Person Household 1.4% 1.5% 1.5%
March 12, 2024 ©2024 Esri Page 6 of 8
Market Profile
Prepared by Esri
Data Note: Households with children include any households with people under age 18, related or not. Multigenerational households are families with 3 or more parent-child relationships. Unmarried partner households are usually classified as nonfamily households unless there is another member of the household related to the householder. Multigenerational and unmarried partner households are reported only to the tract level. Esri estimated block group data, which is used to estimate polygons or non-standard geography.
Source: Esri forecasts for 2023 and 2028. U.S. Census Bureau 2000 and 2010 decennial Census data converted by Esri into 2020 geography.
2285 S Highway 97, Redmond, Oregon, 97756
Rings: 1, 3, 5 mile radii Latitude:
Longitude:
1 mile 3 miles 5 miles 2020 Households by Tenure and Mortgage Status Total 2,800 11,672 15,173 Owner Occupied 45.0% 61.5% 66.6% Owned with a Mortgage/Loan 34.9% 47.1% 49.9% Owned Free and Clear 10.2% 14.4% 16.7% Renter Occupied 55.0% 38.5% 33.4% 2023 Affordability, Mortgage and Wealth Housing Affordability Index 84 65 64 Percent of Income for Mortgage 29.5% 37.9% 38.3% Wealth Index 48 60 73 2020 Housing Units By Urban/ Rural Status Total 2,934 12,252 16,370 Urban Housing Units 100.0% 95.0% 81.0% Rural Housing Units 0.0% 5.0% 19.0% 2020 Population By Urban/ Rural Status Total 7,021 30,427 39,312 Urban Population 100.0% 94.9% 84.4% Rural Population 0.0% 5.1% 15.6%
44.25508
-121.18385
March 12, 2024 ©2024 Esri Page 7 of 8
1.
2.
3.
Market Profile
2285 S Highway 97, Redmond, Oregon, 97756
Rings: 1, 3, 5 mile radii
Prepared by Esri
Latitude: 44.25508
Longitude: -121.18385
Top 3 Tapestry Segments
1 mile 3 miles 5 miles
Front Porches
Middleburg
Middleburg (4C)
(8E)
(4C)
Bright Young
Urban Edge
Urban
Professionals (8C)
Families (7C)
Edge Families (7C)
Urban Edge Families
Front Porches (8E) Front Porches (8E) 2023 Consumer Spending Apparel & Services: Total $ $5,072,626 $22,629,651 $30,923,196 Average Spent $1,663.16 $1,759.28 $1,862.51 Spending Potential Index 76 80 85 Education: Total $ $4,156,906 $17,238,860 $23,718,023 Average Spent $1,362.92 $1,340.19 $1,428.54 Spending Potential Index 76 75 80 Entertainment/Recreation: Total $ $8,348,044 $38,746,579 $53,925,006 Average Spent $2,737.06 $3,012.25 $3,247.91 Spending Potential Index 72 80 86 Food at Home: Total $ $15,621,000 $69,994,630 $96,596,153 Average Spent $5,121.64 $5,441.55 $5,817.99 Spending Potential Index 75 80 86 Food Away from Home: Total $ $8,582,188 $38,622,749 $53,092,288 Average Spent $2,813.83 $3,002.62 $3,197.75 Spending Potential Index 76 81 86 Health Care: Total $ $15,875,835 $76,590,664 $107,023,779 Average Spent $5,205.19 $5,954.34 $6,446.05 Spending Potential Index 71 81 88 HH Furnishings & Equipment: Total $ $6,599,860 $30,492,750 $42,294,423 Average Spent $2,163.89 $2,370.58 $2,547.40 Spending Potential Index 73 80 86 Personal Care Products & Services: Total $ $2,207,652 $9,907,953 $13,672,873 Average Spent $723.82 $770.27 $823.52 Spending Potential Index 76 81 86 Shelter: Total $ $57,885,238 $254,592,084 $351,777,205 Average Spent $18,978.77 $19,792.59 $21,187.57 Spending Potential Index 77 80 86 Support Payments/Cash Contributions/Gifts in Kind: Total $ $6,744,996 $32,347,899 $45,622,191 Average Spent $2,211.47 $2,514.80 $2,747.83 Spending Potential Index 71 80 88 Travel: Total $ $5,010,914 $23,110,487 $32,207,846 Average Spent $1,642.92 $1,796.66 $1,939.88 Spending Potential Index 73 80 86 Vehicle Maintenance & Repairs: Total $ $2,998,107 $13,841,735 $19,162,435 Average Spent $982.99 $1,076.09 $1,154.15 Spending Potential Index 75 82 88 Data Note: Consumer spending shows the amount spent on a variety of goods and services by households that reside in the area. Expenditures are shown by broad budget categories that are not mutually exclusive Consumer spending does not equal business revenue. Total and Average Amount Spent Per Household represent annual figures. The Spending Potential Index represents the amount spent in the area relative to a national average of 100 Source: Consumer Spending data are derived from the 2019 and 2020 Consumer Expenditure Surveys, Bureau of Labor Statistics. Esri. Source: Esri forecasts for 2023 and 2028. U.S. Census Bureau 2000 and 2010 decennial Census data converted by Esri into 2020 geography. March 12, 2024 ©2024 Esri Page 8 of 8
(7C)
Traffic Count Map
2285 S Highway 97, Redmond, Oregon, 97756
Rings: 1, 3, 5 mile radii
Prepared by Esri
Latitude: 44.25508
Longitude: -121.18385
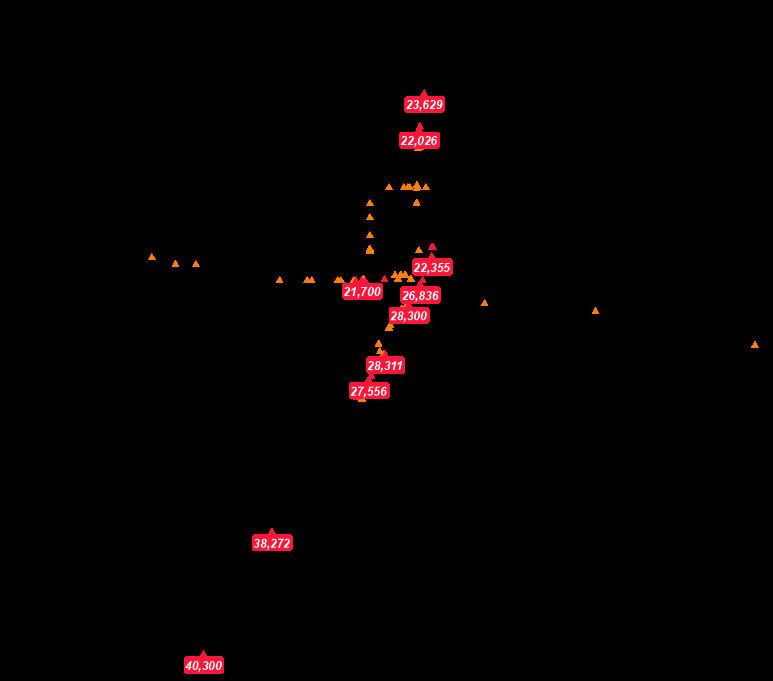
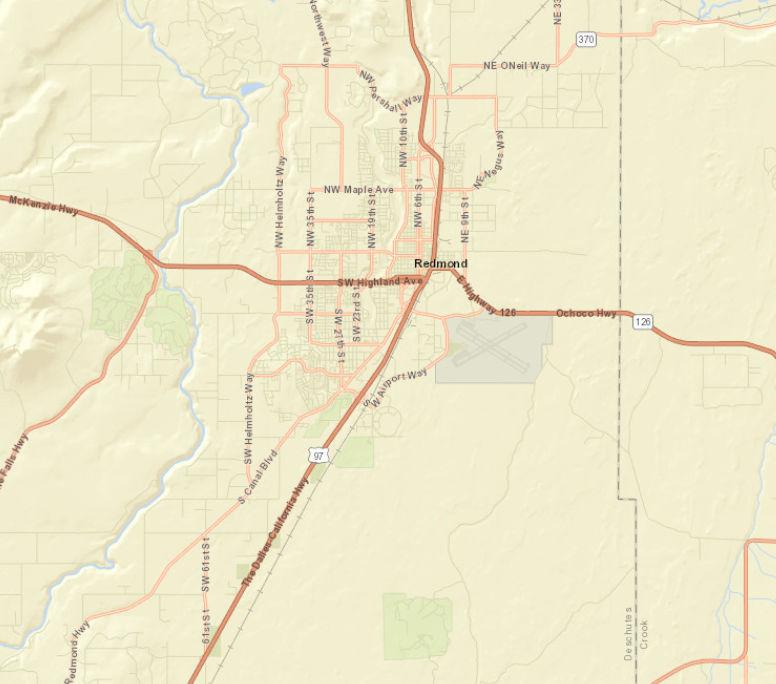
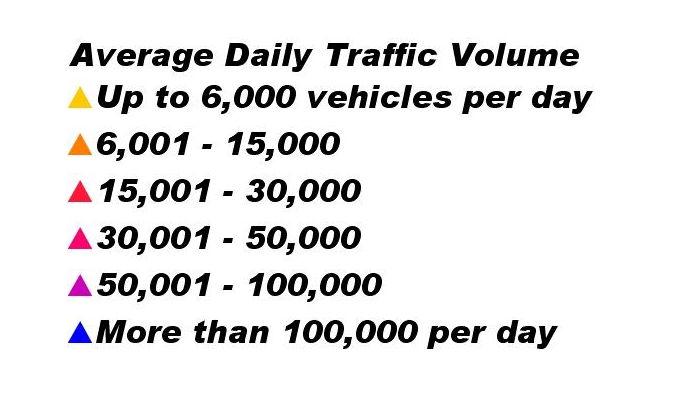
Source:
0 mi
©2023 Kalibrate Technologies (Q4 2023). March 12, 2024 ©2024 Esri Page 1 of 1
COMMERCIAL USE AND INDUSTRIAL USE ZONES
8.0150Strip-Service Commercial C-1 Zone.
8.0155Central Business District Commercial (CBD)C-2 Zone.
8.0160Special-Service Commercial C-3 Zone.
8.0165Limited Service Commercial C-4Zone.
8.0166Limited Service Commercial C-4A Zone: Except as provided in 8.0190 and 8.0195, the standards and criteria for development in the C-4A Zone shall apply to development in the C-4A Zone.
8.0170Tourist Commercial C-5 Zone.
8.0175Downtown Overlay District. In the DowntownOverlay District, the following regulations shall apply:
1. Purpose. The purposeof the Downtown Overlay District is to promote and sustain:
A. Economic Growth - Assure opportunities for a stable, vital, diverse, and competitive economy in the heart of the city.
B. Vibrant Downtown - Strengthen downtown as avibrant,mixed-use district that draws a wide spectrum of residents and visitors.
C. Downtown Appearance - Improve and enhancethe appearance of the built environment and natural features throughout downtown, especially along primary commercial corridors, and other major arterials.
D. Historic Character - Preserve and retain historic structures and cultural resourcesthroughout downtown.
E. Pedestrian Environment - Improve and enhance the pedestrian environment throughout downtown, as well as the pedestrianconnections to surrounding neighborhoods and civic resources.
2. Intent. The intent of the Downtown Overlay District is to:
A. Encourage avibrant mix of pedestrian-oriented uses, including residential, shopping and entertainment uses;
B. Increase the density and intensity of development;
C. Establish height, bulk, and lot coverage regulations that balance existing urban fabric with a desired character for downtown;
D. Promote active ground floors by regulating the quantity and location of doors and windows;
E. Establish standards for setbacks and landscaping that encourage and promote a strong pedestrian environment.
F. Establish parking and access standards that support pedestrian activity.
3. Uses Permitted. (Please see 8.0190 TableC)
4. Development Standards. In the Downtown Overlay District, the following dimensional standards shall apply:
A. Minimum Building Setback: Two (2) feet. Surface treatment needs to be of similar nature as adjoining sidewalk.
B. Maximum Building Setback: Ten (10) feet. Surface treatment beyond two feet from the sidewalk needs to be landscaped or treated with decorative pavers. Use of irrigated turf or asphalt is prohibited. For full-block developments, a minimum of 50% of the primary street-facing building façade must be located at the minimum two (2) feet setback as described in 4.A.
C. Minimum LandscapedArea: No minimum landscaping requirement.
8
REGULATIONS 63
CHAPTER
DEVELOPMENT
D. Ground Floor Windows: Ground floor windows must be at least 50% of the building length and 50%of the street-facing façade to a minimum height of 10’-0” above finished right-of-way. If the site has two or more frontages, the Ground Floor Window standards is only required on the primary façade. The other façade has a minimum requirement of 50% of the building length and 25% of the ground floor wall area. Windows arerequired tobe transparent.
Please note: Ground floor wall area is defined as all wall areas up to ten (10) feet above the finished grade.
Ground Floor Windows – Residential Use: 25% of the ground floor wall area must be transparent.
E. Main Entrance: The front door to all buildings must be oriented to the primary street. In the event that a building is located on the corner, the front doorshould be oriented directly to the corner or located within fifty (50) feet of the corner of the primary street.
F. Pedestrian Connection from Front Door to the Street: Create a straight-line connection from the front door tothe primary street sidewalks.
G. Exterior Display and Storage: Permanent storage between the building and the street is prohibited.
H. Screening HVAC Equipment: Screen rooftop mechanical equipment through extended parapets or other roof forms that are integrated into the overall composition of the building. Screen ground floor mechanical equipment. Renewable energy generation devicesmay be exempt from screening, subject to site and design review by a hearings body.
I. Parking andAccess: Parking between the building and the primary street is prohibited.
5. Building Height. The intent of the building height standards is to set guidelines to assist the development in the downtowncore that increase economic activity, capital value and encourage investment in the downtown core. The following guidelines provide performance standards that encourage innovative design and development techniques within specific parameters. They are generally prioritized to include the following: Compatibility with existing downtown buildings and surrounding residential neighborhoods; Human scale related to building design, including height and massing, and its impact on solar access and views; Multi-story and mixed-use buildings for increased density and diversified use on premium land inthe urban core; Development incentives for increased height, based on Performance Bonuses.
A. Maximum Height: Themaximum height allowed for the downtown overlay district for all structures that are not within one full city block of a residential zone and west of SW 5th Street is sixty (60) feet, and east of SW 5th Street is 75 feet. The maximum height of structures east of 5th Street may be increased if a Conditional Use Permit for the structure is approved by aHearings Body. The following standards shall apply to structures in the DowntownOverlay District.
1. Street Wall Height: Maximum street wall façade height for the downtown overlay district for all structures that are not within one full city block of aresidential zone is forty-five (45) feet.
2. Upper-floor Setback: Buildings taller than forty-five (45) feet must step back upper stories by at least 10 feet measured from the façade of the street wallfacing the street, public park, or open space.
3. Residential Buffer Zone: All buildings in the Downtown Overlay District
CHAPTER 8 DEVELOPMENT
64
REGULATIONS
within one full city block adjacent to a residential zone shall be considered to be part of the Residential Buffer Zone, wherein the following height standards apply:
a. Maximum Height: The maximum height allowed for all structures within the Residential Zone Buffer is fifty (50) feet.
b. Street Wall Height: Maximum street wall façade height for structures withinthe Residential Zone Buffer is thirty-five (35) feet.
c. Upper Floor Setback Requirements: Buildings taller than thirtyfive (35) feet must step back upper stories by at least 10 feet measured from the façade of the street wall facing the street, alleyway, public park, or open space.
B. Architectural Standards for Buildings Taller Than 45 Feet: In addition to the existing Site and Design Review criteria and Downtown Overlay District Design Standards, the following architectural standards will apply to all buildings taller than forty-five(45) feet.
1. On upper floors use windows and/or architectural features that provide interest on all four sides of the building when permitted within the building code.
2. Abrupt changes in building heights and/or roof orientation should be diminished by offsets of building form and mass.
3. Use recesses and projections to visually divide building surfaces into smaller scaleelements.
4. Use color tovisually reduce the size, bulk, and scale of the building.
5. Buildings sixty feet or over shall provide rooflines with articulated features.
6. Location of back flow prevention devices and the fire sprinkler riser must be identified on project plans submitted for site and design review and shall be located inside the building.
C. Buildings within the Downtown Overlay District shall only be permitted to exceed 75 feet if they comply with the standards set forthbelow.
1. Performance Bonus: Additional building height above 75 feet may be approved if the project achieves a minimum of twelve (12) points from the following:
Affordable Housing: The project provides affordable housing, per City standards, for low- and moderate-income households, as a percentage of the total number of residential units built. 3points for 10%, 4 points for 15%,and 5 points for 20% of total number of residential units built for affordable housing.
Workforce Housing: The project provides workforce housing, per City standards. 1 point for 10%, and 2 points for 20% of total number of residential uses built for workforce housing.
Public Plaza: The project incorporates a public plaza which is at least 5% of the gross site area. Theplaza shall be on the street side of the building, and open and free to the public at alltimes and shallremain for a period of at least ten years. 1 point per 5% public plaza space, with a maximum of 4 points.
3 - 5 pts.
1 – 2 pts.
1 - 4 pts.
Public Art: 0.5% of the overall project budget is set aside for an on-site public art project that shallremain for the life of the building, or 1.0% of the overall project budget is provided to the City for off-site public art shallbe awarded 2 2 - 4 pts.
CHAPTER 8 DEVELOPMENT REGULATIONS 65
points. Increasing thesepercentages to 0.75 % and 1.5% respectively increases the number of points awarded to 3. Increasing these percentages to 1.0% and 2.0 % respectively increases the points awarded to 4.
View Access and Preservation: The project provides a public viewing deck or decks, or similar features, which are at least 5% of the gross site area. The viewing deck(s) should be located at least sixty (60) feet above ground level and provide significant free public access to views of surrounding Central Oregon features, such as the Cascade Mountains and Smith Rocks, and shall remainfor a period of at least ten years.
Economic Vitality: The project provides additional economic benefit to the City by providing retail sales and/or hospitality uses on multiple levels. Total floor area dedicated to entertainment, eating anddrinking, retail services,and service commercial uses as presented in Section 8.0190, Table C of the Redmond Development Code, must equal or exceed 75% of the building footprint and shall remain for a period of 5 years will be awarded 4 points. One additional point will be awarded for each additional 25% of floor area (as defined by the building footprint) for retail, entertainment or hospitality uses up to amaximum of 8 points.
Historic Preservation: The project provides forpreservation or adaptive reuse of all buildings on the City’s Inventory of Historic Resources located on the project site in amanner consistent with the Secretary of the Interior’s Standards for the Treatment of Historic Resources shall beawarded 2 points. The Hearings Body may increase the points up to 4 points for projects on the National Register of Historic Places. As an alternative, 1.0% of the overall project budget is provided for a specific historic preservation project that will be completed within a specific timeframe in the Cityof Redmond or is provided to the Redmond Historic Commission for historic Redmond projects (not operations) shallbe awarded 2 points. The provision of 2% of the overall project budget will receive 4 points.
Sustainable Building: Project is built to LEED standards, or equivalent green building practices. It will be up tothe applicant toprovide material supporting equivalent building practices. (Certified is awarded 2 points, Silver certification is awarded 3 points, Gold certification is awarded 4 Points, and Platinum is awarded 5 points.)
Parking: In addition to the required parking for the development, the project provides at least 7 on-site parking spaces for public use between 8:00 – 6:00 PM that shall remain for the life of the building. 1 point per 7 public parking spaces, with amaximum of 5 points.
Total:
2. Building Bulk for Buildings over 60 feet in Height:
1 pt.
4 - 8 pts.
2 - 4 pts.
2 - 5 pts.
1 - 5 pts.
36 pts.
a. Floor Area Ratio (FAR): Buildings between sixty (60) feet and eighty-five (85) feet shall have a maximum floor area ratio of 4.0.
66
CHAPTER 8 DEVELOPMENT REGULATIONS
Buildings eighty-five (85) feet and taller shall have a maximum floor area ratio of 5.0. Floor Area Ratio (FAR) is a method of calculating allowable floor area in a development as a means of controlling “bulk” and “massing” of larger developments, often encouraging setbacks and step backs, and progressively slender upper floors.
3. Application Requirements for Buildings Over 75 Feet: Planning applications submitted for new buildings over 75 feet tall shall include the following additional items to assist the City in the analysis and decisionmaking process.
a. Three-Dimensional Digital Model: A complete threedimensional digital model of the proposed building.
b. Solid WasteManagement Plan: A solid wastemanagement plan to showhow the project meets or exceedsthe City’s Solid Waste Guidelines, to the approval of the Utilities Director.
c. Utilities InfrastructureAnalysis: An engineer’s evaluation of existing utilities infrastructure and recommendations to ensurethat the project will have adequate water pressure for domestic use and fire flows andthat the collection system in the area surrounding the project is sufficient to meet the project’s impact.
d. Emergency Services Access Plan: A written and graphic plan, created in consultation with the City’s FireMarshal to showhow access to site and upper floors for emergency response personnel will be provided.
e. Public Safety Plan: A security plan, created in consultation with the Police Department for all proposed buildings that include publicly accessible areas such as parking garages, courtyards, public stairways, elevators, and decks.
4. Height Design Departure: In addition to the availability of variances as noted in 8.0700 – 8.0720, a design departure procedure will be established to allow a project to achieve flexibility in the application of prescriptive development standards and height performance bonuses (limited to two height performance bonuses). A 20% departure may be granted administratively. In order to allow a departure from a code standard, an applicant must demonstrate that it would result in a development that better meets the intent of the purpose of the regulation and applicable design guidelines.
6. Design Standards. Any change to the exterior of a building or a property shall be reviewed by the Community Development Department pursuant to ArticleIV Section 8.3040 of the Redmond Development Code.
7. Off-Street Parking. Subject to the standards of 8.0505 –8.0515.
A. Fee-In-Lieu of Parking: The purpose of these provisions is to allow development in the Downtown Overlay District to reduce the number of off-street parking spaces through payment of a fee in order to meet the parking requirements set forth in this Code. These provisions may be utilized for parking required for new construction or for an increase in required parking resulting from the change of use of an existing building.
Payment made to the City in-lieu of supplying the required off-street parking spaces for a project in the Downtown Overlay District may be provided as follows:
67
CHAPTER 8 DEVELOPMENT REGULATIONS
1. By the one-time payment of a non-refundable parking and mobility improvement fee to the City in the amount established in the City’s Fee Schedule, paid prior to the issuance of Certificate of Occupancy. Fees collected shall be used to fund parking, street improvements or facilities to improve mobility or enhance pedestrian connectivity and safety in the Downtown Overlay District.
2. From time to time the City shall establish the value of off-street parking facilities on a per parking space basis, used to establish the above parking and mobility improvement fee.
3. The City Engineering shall evaluate development proposals requesting to pay an in-lieu fee through conducting a Transportation System Analysis or parking study.
4. Any such request for parking in-lieu may be denied or reduced by the Community Development Director, or designee. The Director, or designee, shall determine:
a. Whether there is sufficient alternative parking within a two to fourblock radius of the project location.
b. Whether approval of the request would have an adverse effect on surrounding neighborhoods.
c. Whether the request meets the Purpose and Intent of the Downtown Overlay District Zone.
d. Compliance with the Redmond Comprehensive Plan 2040 and support plans, as amended.
[Section 8.0175 amended by Ord. #2016-17 passed January 31, 2017]
[Section 8.0175 amended by Ord. #2022-04 passed June 28, 2022]
[Section 8.0175 amended by Ord. #2022-09 passed December 13, 2022]
[Section 8.0175 amended by Ord. #2023-07 passed December 19, 2023]
8.0180Light Industrial (M-1) Zone.
8.0182General Industrial (M-1.5) Zone.
8.0185Heavy Industrial (M-2) Zone.
8.0186Large Lot Industrial (LLI) Zone.
1. LLI Zone Regulations. The following standards and regulations apply inthe LLI Zone:
A. The lot shall adhere to the designation as acknowledged by the Central Oregon IntergovernmentalCouncil.
B. No property that is zoned LLI can be rezoned to another zone within ten years of the LLI designation.
C. The minimum lot size is 50 acres. Division or separation of lots or parcels within the site to new lots or parcels less than the minimum lot size is not allowed until the site is developed with a primarytraded sector use requiring a large lot.
D. Allowed uses are tradedsector uses as provided in Section 2.
E. Uses allowed tosupport a primary user included:
1. Subordinate industrial uses that rely upon and support the primary traded sector use;
2. Service commercial uses that support the traded sector uses if they are limited to7500 square feet per use; and
3. Retail uses accessory to a traded sector use and limited to 7500 square feet.
F. Conceptual Phased Site Development Plan. A Conceptual Phased Site Development Plan is required for each primary traded-sector use as part of the
CHAPTER 8 DEVELOPMENT REGULATIONS 68
Site and Design Review process in addition to the criteria and requirements outlined in Article IV of this code. In addition to the requirements outlined in Section 8.3025, the following elements shall be considered as part of the Conceptual Phased SiteDevelopment Plan:
1. Open Space. Generally identify land provided for open space on the site.
2. Connectivity and Trail Networks. A conceptual transportation plan for streets, pedestrians connectivity and trail networks. E.g., Connection of bicycle routes and pedestrian network for utility and recreational purposes.
3. Site Design. Describe how the design elements (i.e., streets, open spaces, signage, and architecture) are integrated and coordinated throughout the site.
4. Analysis of Anticipated Utility Consumption by Phase. Analysis of the anticipated utility consumption by phase for wastewater, water, power, natural gas, and other utility infrastructure necessary to support the development.
2. LLI Zone Uses Permitted. The following uses are allowed outright or conditionally in the Large Lot Industrial Zone:
Land Use:
Traded-Sector Usage
Subordinate Industrial Uses
Service Commercial Uses
Retail Uses
Zone: RESTRICTIONS AND REQUIREMENTS:
O PerORS285B.280,tradedsectormeansindustriesinwhich memberfirmsselltheirgoodsorservicesintomarketsforwhich nationalorinternationalcompetitionexists,aswellasusesand servicesthatdirectlybenefittradedsectoruses.Alloweduses includemanufacturing,processingplants,distributioncenter, warehousing,researchanddevelopment,andhighereducation institutions
O Afteraprimarytraded-sectorusehasbeensited,subordinate industrialusesareallowed.Subordinatemeansindustriesthat relyuponandsupportaprimarytradedsectoruse
C Afteraprimarytraded-sectorusehasbeensited,service commercialusesareallowedthatsupportthetradedsectoruses andshallbelimitedto7500squarefeetperstructure
C Afteraprimarytraded-sectorusehasbeensited,retailuses,and eatinganddrinkingestablishmentsareallowedasaconditional useandshallbelimitedto7500squarefeetperuseinthe structure.
O=Outrightuses,C=ConditionalUses
3. Minimum Standards. See Table D, 8.0195.
[Section 8.0186 added by Ord. #2015-11 passedSeptember 22, 2015]
[Section 8.0186 amended by Ord. #2022-09 passed December 13, 2022]
69
CHAPTER 8 DEVELOPMENT REGULATIONS