LOUISIANA MARKETPLACE REPORT
 Prepared by Ben Albright Vice President of Strategic Initiatives

INDEPENDENT INSURANCE AGENTS & BROKERS OF LOUISIANA 2021 DATA

Prepared by Ben Albright Vice President of Strategic Initiatives
You are being provided this summary of the Louisiana property and casualty (P C) insurance marketplace as a benefit of your membership in the Independent Insurance Agents & Brokers of Louisiana.
What follows is a graphic and numeric presentation of the Louisiana P-C industry data from an independent agent’s perspective This summary emphasizes direct premiums, direct losses and the associated direct underwriting results before reinsurance. As independent agents, this is the marketplace experience for the business we place (or compete against) for our clients in Louisiana. Included in this summary is data from nearly 3,000 insurers that are domiciled in the United States Then, if they have written premiums in Louisiana, their data is included in this summary.
The summary starts with a direct premium listing of all 32 lines of business reported by P-C insurers, for all distribution styles in Louisiana The presentation of data then focuses on the 26 lines of business independent agents work with most For these agent focused lines of business, data is provided on loss ratios, growth rates, penetration rates by the various distribution
styles and commission rates In addition, and important to independent agents, a breakout of surplus lines activity is provided to show trends, and utilization rates. United States national data is provided for comparison purposes.
For those readers interested in the details, a separate page is provided for each of the 26 lines of business independent agents work with most Five year premiums are provided, loss and combined ratios, penetration rates by distribution style and information on the numbers and largest insurers. The lines of business are provided in alphabetical order, and the applicable line of business detail page number is shown in the Table of Contents
On the product details pages, any line of business in the Top 10 is highlighted with a small pie chart in the upper right hand corner which shows its relative position in the ranking of premiums written by independent agents, in Louisiana.
Last, appendices are provided for information on approaches taken to presenting the industry data, definitions and additional information that may further interest the reader.
Premiums: All P-C
of Business
Premiums: Top Agent-Focused
Loss Ratios: Agent-Focused
Premium Growth Rates: Agent-Focused
Penetration: Top Agent-Focused
Commissions: Top Agent-Focused
Surplus Lines: Top Lines, Premiums
Louisiana Lines of Business:
Total All P C Lines of Business Aircraft (all perils)
All Commercial Auto
All Private Passenger Auto Allied Perils Only Boiler & Machinery Burglary & Theft Commercial Multi-Peril Earthquake Excess Workers’ Comp Farmowners Multi Peril
Federal Flood Fidelity Fire Peril Only Homeowners
Inland Marine International Medical Malpractice Multi-Peril Crop Ocean Marine
Other Liability (Claims made) Other Liability (Occurrence) Private Crop Private Flood Products Liability Surety Workers' Compensation
Accident & Health
Aggregate Write Ins
*Aircraft (all perils)
*All Commercial Auto
*All Private Passenger Auto
*Allied Perils Only Machinery
*Burglary & Theft
*Commercial Multi Peril Credit
*Earthquake
*Excess Workers' Comp
*Farmowners Multi Peril
*Federal Flood
*Fidelity Financial Guaranty
*Fire Peril Only
*Homeowners Multi Peril
*Inland Marine
*International
*Medical Malpractice Mortgage Guaranty
*Multi Peril Crop
*Ocean Marine
*Other Liability (Claims made)
*Other Liability (Occurrence)
*Private Crop
*Private Flood
*Products Liability
*Surety Warranty
*Workers' Compensation
$82,259,000 $16,964,000 $48,990,000
$989,262,000
$4,832,960,000 $591,898,000 $45,214,000 $5,287,000 $590,031,000 $27,957,000 $6,650,000 $48,353,000 $14,742,000 $283,342,000 $13,624,000 $8,566,000
$423,264,000
$511,936,000
$2,055,110,000
$0
$108,530,000 $64,835,000 $128,998,000 $155,696,000 $272,430,000 $896,168,000 $5,839,000 $24,977,000 $45,931,000 $135,346,000 $8,436,000 $804,978,000
$0 $1,000,000,000 $2,000,000,000 $3,000,000,000 $4,000,000,000 $5,000,000,000
Notes or Comments: The above chart shows all 32 lines of business that P C insurers are required to report on in their annual statement. The lines of business are listed in alphabetical order. The 26 agent focused lines of business are emphasized above with an asterisk (*). These are the lines of business that are included whenever a total is provided for Total (IA Focused Lines) in the remainder of this 2021 Louisiana P C Marketplace Summary The lines of business that are not included in Total (IA Focused Lines) are Accident & Health, Aggregate Write ins, Credit, Financial Guaranty, Mortgage Guaranty, and Warranty. These 6 lines of business are about 2.5% of all premiums in 2021.
Additional data on all 32 lines of business is provided in Appendix #1: All Lines of Business Additional Details.
Source: © A M Best Company used by permission
The previous page showed total premiums and premiums by line of business. To add perspective to that, below are some standardized measures of total premiums for Louisiana compared to other states, from data similar to the above.
In the below table, Total (All Lines) includes premiums for all 32 lines of business shown above, including Credit The combined premiums for Personal Lines is All Private Passenger Auto, Homeowners Multi Peril and Farmowners Multi Peril Commercial Lines is all other lines of business except All Private Passenger Auto, Homeowners Multi Peril, Farm owners Multi Peril and Credit.
United States
Total (All Lines) Premiums
Total (All Lines) Per Capita Premium
Personal Lines Per Capita Premium
Commercial Lines Per Capita Premium
$785 Billion
$2,369
$1,163
Smallest/ Lowest State
$1 4 Billion (Vermont #51)
$1,674 (Ohio #51)
$835 (District of Columbia #51)
$97 3 Billion (California #1)
$3,839 (North Dakota #1)
$1,621 (Florida #1)
$1,186
$730 (West Virginia #51)
$2,647 (North Dakota #1)
Louisiana (Rank)
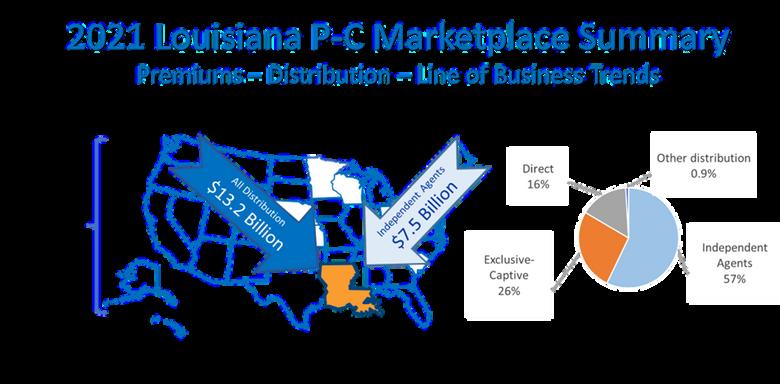
$13 2 Billion (#22) $2,844 (#7) $1,482 (#3)
$1,345 (#17)
The United States overall, and most states individually, see Private Passenger Auto as the largest premium line of business through independent agents. This is case in about 80% of the states, but there are exceptions Those exceptions are a handful of Midwest states, which have Multi Peril Crop as their highest premium line of business, followed by several states with Other Liability (Occurrence) or Other Liability (Claims Made), a few states with Workers’ Compensation, and finally one state with Homeowners Multi Peril
All Commercial Auto
All Private Passenger Auto Commercial Multiple Peril Inland Marine
Other Liability (Occurrence)
Homeowners Multi Peril Other Liability (Claims Made) Workers' Compensation
Fire
Multi Peril Crop
Allied Lines
Medical Professional Liability
Surety
Farmowners Multi Peril Accident & Health Lines
Private Crop Earthquake Aircraft (all perils)
Ocean Marine Warranty
There are consistencies in the highest premium generating lines of business. To get a sense for that, in the table below are the lines that are present in at least one state’s Top 10, along with the percent of states where that line of business is in the top 10 The percentages are approximate, as small changes in premiums can result in variances, particularly in the last of the lines listed.
States with Product in Top 10 100% 100% 100% 100% 100%
80% to 95% 80% to 95% 80% to 95% 80% to 95% 45% 35% 10% 10% 10% 5% 5% 5% 2% 2% 2%
All Commercial Auto
All Private Passenger Auto
Allied Perils Only
Boiler & Machinery
Burglary & Theft Commercial Multi Peril Earthquake
Excess Workers' Comp Farmowners Multi Peril
Federal Flood Fidelity Fire Homeowners Multi Peril
Inland Marine
Medical Malpractice
Multiperil Crop Ocean Marine
Other Liability (Claims made)
Other Liability (Occurrence)
Private Crop
Private Flood Products Liability
Surety
Workers' Compensation (*)
Total (All Lines)
2021 Louisiana Loss Ratio
49% 79% 76% 588% 21% 47% 344% 17% 49% 206% 263% 8% 318% 403% 80% 31% 108% 122% 57% 64% 128% 66% 54% 22% 41% 168%
2021 United States Loss Ratio
As can be seen in the above, loss ratios can vary in the short run from the long run. Loss ratios can also vary by state. For added perspective on Louisiana’s loss ratios, below is a table of the 2021 Louisiana loss ratios contrasted with the United States average loss ratios Aircraft (all perils)
54% 64% 69% 79% 38% 52% 61% 3% 41% 65% 48% 28% 68% 69% 49% 55% 76% 54% 56% 61% 89% 46% 52% 16% 51% 63%
Source: © A.M. Best Company used by permission (*Individual state experience for workers’ compensation in North Dakota, Ohio, Washington and Wyoming is not used for highlights as these are monopolistic fund states and premiums are small and loss ratios can vary widely Also International is not shown due to limited data )
(all
Commercial Auto
Private Passenger
Allied Perils Only
Boiler & Machinery
Burglary
Theft
Commercial Multi Peril
Excess Workers' Comp
Farmowners Multi Peril Federal Flood
Fire Peril Only
Homeowners Multi Peril
Inland Marine
Medical Malpractice Multi Peril Crop
Marine
Other Liability (Claims
Liability
Crop
Flood
Liability
All Commercial Auto
All Private Passenger Auto
Allied Perils Only
Boiler & Machinery
Burglary & Theft Commercial Multi Peril Earthquake
Excess Workers' Comp Farmowners Multi Peril
Federal Flood Fidelity Fire Homeowners Multi Peril
Inland Marine Medical Malpractice
Multiperil Crop Ocean Marine
Other Liability (Claims made)
Other Liability (Occurrence)
Private Crop
Private Flood Products Liability
Surety
Workers' Compensation (*)
Total (All Lines)
Louisiana 1-Yr Growth
2% 15% 2% 16% 26% 16% 5% 14% 5% 2% 6% 13% 11% 0% 15% 4% 43% 1% 15% 7% 39% 31% 2% 21% 4% 5%
United States
1-Yr Growth
Premium growth rates can vary considerably by line of business. They can also vary considerably by state. To provide perspective on Louisiana growth rates, below is the 1 year growth rates by line of business in Louisiana contrasted with average growth rates in United States Aircraft (all perils)
14% 17% 5% 12% 11% 7% 8% 11% 2% 5% 1% 7% 13% 8% 15% 10% 37% 13% 31% 16% 14% 45% 4% 7% 3% 10%
Independent agent penetrations vary by line of business but also by state. To give perspective on Louisiana’s penetrations rates, below is a table of the line of business penetration rates in Louisiana contrasted with the average penetration in all the United States.
Aircraft (all perils)
All Commercial Auto
All Private Passenger Auto Allied Perils Only
Boiler & Machinery
Burglary & Theft Commercial Multi Peril Earthquake
Excess Workers' Comp Farmowners Multi Peril
Federal Flood Fidelity Fire Homeowners Multi Peril
Inland Marine
Medical Malpractice
Multiperil Crop
Ocean Marine
Other Liability (Claims made)
Other Liability (Occurrence)
Private Crop
Private Flood Products Liability
Surety
Workers' Compensation (*)
Total (All Lines)
99% 78% 26% 87% 95% 77% 84% 82% 98% 34% 74% 86% 92% 44% 78% 93% 100% 96% 94% 88% 100% 81% 97% 87% 95% 57%
95% 85% 32% 86% 93% 96% 84% 87% 94% 40% 78% 91% 88% 49% 77% 75% 96% 96% 92% 86% 96% 84% 94% 86% 90% 62%
(International not shown less than 5 years data is available)
Surety
all the preceding charts and tables, surplus lines premiums are combined with admitted insurance premiums. In the above pie and bar charts, the surplus lines premiums are shown separately The pie chart shows the lines of business where surplus lines has the most premiums in Louisiana. Also provided are total direct written premiums in surplus lines, and the percentage those total direct written premiums are to all direct written premiums.
note the pie chart and bar chart/line chart above are premiums for insurers domiciled in one
the 51 states
Washington, DC
writing surplus lines insurance The premiums of these insurers
their licensed status Also, the above data does not include alien insurers
the 51 states). If alien premiums
surplus lines premiums
lines insurer
identified
insurers not
in
alien
insurer
The need for surplus lines varies widely by line of business and from state to state. Below are the line of business utilization rates for Louisiana contrasted with the average utilization with those lines of business in the United States
Aircraft (all perils)
All Commercial Auto
All Private Passenger Auto Allied Perils Only
Boiler & Machinery
Burglary & Theft Commercial Multi Peril Earthquake Excess Workers' Comp Farmowners Multi Peril Federal Flood Fidelity Financial Guaranty Fire Peril Only Homeowners Multi Peril
Inland Marine International Medical Malpractice Multiperil Crop Ocean Marine
Other Liability (Claims made)
Other Liability (Occurrence)
Private Crop
Private Flood Products Liability
Surety
Workers' Compensation (*)
Total (All Lines)
0 0% 22.3% 0.0% 40.6% 7.0% 15.4% 28.4% 57 0% 0 0% 0.3% 0.1% 2.1% 0.0% 49.7% 4.3% 5 3% 32.5% 0.0% 2.4% 39.3% 46.1% 0.0% 41 2% 57 3% 0.0% 0.0% 11.8%
United States Average
2 1% 6.3% 0.2% 29.8% 7.4% 19.8% 8.7% 44 5% 0 5% 0.4% 2.4% 2.2% 0.0% 33.1% 2.3% 6 1% 90 8% 24.4% 0.0% 3.3% 34.9% 29.6% 0.1% 41 0% 45 4% 0.5% 0.5% 8.3%
The following pages provide more in depth detail on the 26 lines of business that independent agents in Louisiana focus on The first line of business provided is a summary for all lines combined, the Total All P C Lines of Business page. Then, the 26 lines of business detail pages are presented in alphabetical order.
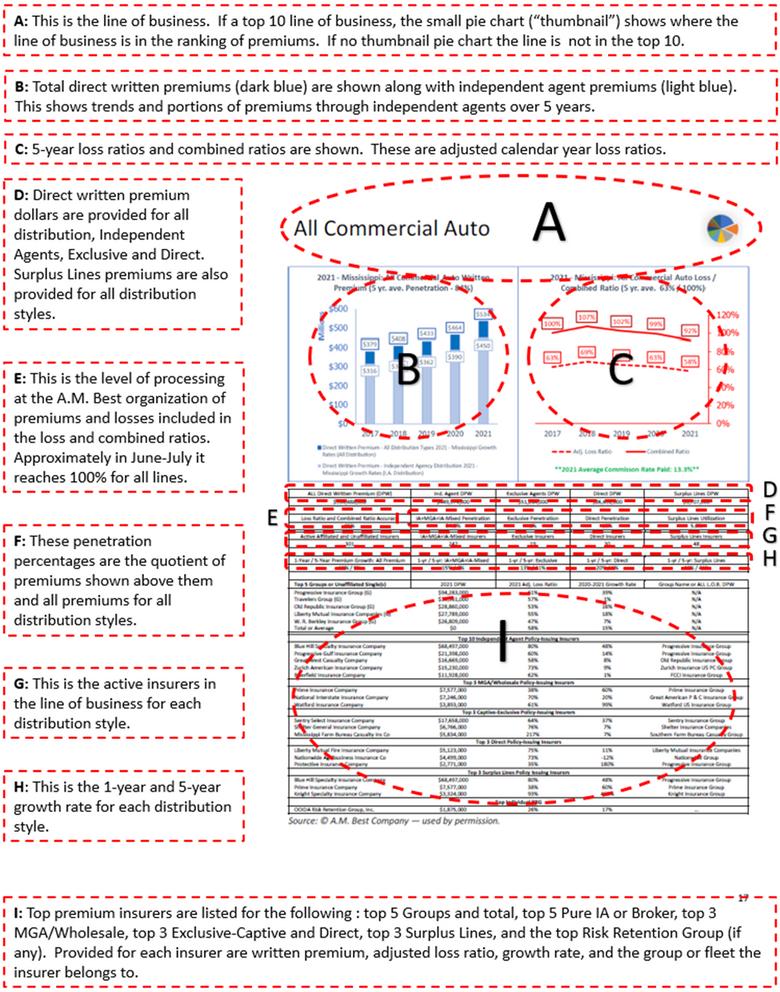
The details provided for each major line of business in Louisiana are:
A summary bar chart of 5 years data on premiums for all distribution types (dark blue), and premiums written through independent agents (light blue). For the premium chart the classification of premiums through independent agents is based on a categorization of agents by distribution style. The categorization approach is explained in Appendix #2: Distribution Style Classifications. 5 year average line charts, showing the Loss ratio (dashed red line) and combined ratio (solid red line) are provided The direct written premium for independent agents, exclusive captive agents, and direct agents is provided with the percentage of the total. Surplus Lines premiums through any distribution style is provided with its corresponding percentage of all premiums. The number of active insurers is provided with the number of independent agents, exclusive captive agent and direct insurers provided for each line of business. The number of active surplus lines insurers is also provided.
1 year and 5 year growth rates are provided for independent agent, exclusive captive and direct insurers The percentage premiums through insurers licensed as surplus lines is also provided. Top Insurers: The top 5 insurer groups in each line of business is provided with that group’s premiums, 1 year loss ratio, and 1 year growth rate Groups of insurers sometimes are made up of multiple policy issuing insurers in a particular group but it can also be only one policy issuing insurer in that group. After the top groups, listed are the top policy issuing insurers distributing insurance through independent agents, captive exclusive agents, direct insurers, surplus lines insurers and the top risk retention group (if any) for the line of business For each policy issuing insurer the premium for the insurer in that line of business is shown with the 1 year loss ratio and 1 year growth rate.
As you scroll through the following lines of business pages take notice if a small pie chart thumbnail is presented at the upper right If there is a pie chart present, that means the product is in the top 10 lines of business for independent agents in Louisiana. The broken out pie slice in that small pie chart represents the position of that line of business, and its rank order based on independent agent premium volume The rank order is based on direct written premium and corresponds to the pie chart slice highlighted on Page 4 of this 2021 Louisiana P C Marketplace Summary.
For further clarification on lines of business, Appendix #3: NAIC Line of Business Definitions is provided for the reader And, a visual guide to the data and calculations in the product details is provided in Appendix #4: Product Details Explanation.
Ind. Agent DPW
$7,550,463,000
IA+MGA+IA Mixed Penetration 57%
IA+MGA+IA Mixed Insurers 590
1 yr/5 yr: IA+MGA+IA Mixed 9%/6%
Exclusive Agents DPW $3,489,798,000
Exclusive Penetration 26%
Exclusive Insurers 48
1 yr/5 yr: Exclusive
Top
State Farm
Progressive Security Insurance
Workers' Compensation
Continental Casualty Company
Imperial Fire and Casualty
Scottsdale Insurance Company
GoAuto Insurance Company
Wright National Flood Insurance Company
Houston Specialty Insurance Company
State Farm Mutual Automobile Ins Co
State Farm Fire and Casualty Company
Allstate Property and Casualty Ins Co
GEICO Casualty Company
Progressive Paloverde Insurance Company
United Services Automobile Association
Scottsdale Insurance Company
Houston Specialty Insurance Company
Blue Hill Specialty Insurance Company
OOIDA
Direct DPW $2,088,739,000
Direct Penetration 16%
Direct Insurers 87
yr/5 yr:
Surplus Lines DPW $1,564,920,000
Surplus Lines Utilization 11 8%
Surplus Lines Insurers 140
yr/5
Lines 20%/13%
2021 DPW $2,094,932,000 $1,201,725,000 $971,549,000 $773,436,000 $516,928,000 $13,248,569,000 $600,167,000 $229,758,000 $168,917,000 $168,171,000 $136,057,000 $167,364,000 $97,170,000 $82,745,000 $1,350,074,000 $707,467,000 $366,564,000 $422,422,000 $397,578,000 $147,889,000 $136,057,000 $82,745,000 $58,019,000 $5,883,000
2021 Adj Loss Ratio
2021 Growth Rate
Name or ALL
Top 10 Pure Independent Agent Broker Policy Issuing Insurers
Top 3 MGA/Wholesale Policy Issuing Insurers
Top 3 Captive Exclusive Policy Issuing Insurers
Top 3 Direct Policy Issuing Insurers
Top 3 Surplus Lines Policy Issuing Insurers
Top Individual RRG
Insurance Group
Ind. Agent DPW $48,385,000
IA+MGA+IA Mixed Penetration 99%
IA+MGA+IA Mixed Insurers 23
1 yr/5 yr: IA+MGA+IA Mixed 1%/4%
Exclusive Agents DPW $299,000
Exclusive Penetration
Exclusive Insurers
yr/5
Direct DPW $306,000
Direct Penetration 1%
Direct Insurers 1 1 yr/5 yr: Direct
Top
Surplus Lines DPW ($18,000)
Surplus Lines Utilization
Surplus Lines Insurers
2021
Loss Ratio
2020 2021 Growth Rate
Name or ALL L
B
Top 10 Pure Independent Agent Broker Policy Issuing Insurers
Top 3 MGA/Wholesale Policy Issuing Insurers
Top 3
2021 DPW $10,945,000 $6,487,000 $4,653,000 $4,257,000 $3,631,000 $48,988,000 $10,945,000 $6,852,000 $4,653,000 $4,257,000 $3,631,000 $855,000 $816,000 $299,000 $306,000
Policy
Insurers
Top 3 Direct Policy Issuing Insurers
Top 3 Surplus
Policy Issuing Insurers
Individual
International Group
Marine
Ind. Agent DPW $775,833,000
IA+MGA+IA Mixed Penetration 78%
IA+MGA+IA Mixed Insurers 233
1 yr/5 yr: IA+MGA+IA Mixed 14%/9%
Exclusive Agents DPW $94,914,000
Exclusive Penetration 10%
Exclusive Insurers 17
1 yr/5 yr: Exclusive
Top
Groups
Skyward
Insurance
Blue Hill Specialty Insurance
Union
AmGUARD
The Gray
Travelers
Houston Specialty
Clear Blue
Blue
State Farm Mutual
State Farm Fire
Progressive Paloverde
Liberty Mutual
Company
Houston Specialty Insurance Company
Blue Hill Specialty Insurance Company
Clear Blue Specialty Insurance Company
OOIDA Risk
Group,
Top 10 Pure
2021 DPW $143,179,000 $80,741,000 $73,628,000 $49,631,000 $45,673,000 $989,256,000 $56,096,000 $28,749,000 $27,295,000 $19,856,000 $14,074,000 $70,646,000 $28,559,000 $13,992,000 $23,400,000 $21,973,000 $20,100,000 $65,590,000 $9,672,000 $5,797,000 $70,646,000 $56,096,000 $28,559,000 $5,820,000
2021 Adj Loss Ratio
Direct DPW $104,528,000
Direct Penetration 11%
Direct Insurers 23
1 yr/5 yr: Direct 14%/6%
2020 2021 Growth Rate
Surplus Lines DPW $220,148,000
Surplus Lines Utilization 22 3%
Surplus Lines Insurers 55
1 yr/5 yr: Surplus Lines 15%/17%
Group Name or ALL L O B DPW N/A
Progressive Insurance Group American International Group Berkshire Hathaway Ins Group
Gray Insurance Group Travelers Group
Top 3 MGA/Wholesale Policy Issuing Insurers
Top 3 Captive Exclusive Policy Issuing Insurers
Top 3 Direct Policy Issuing Insurers
Top 3 Surplus Lines Policy Issuing Insurers
Top Individual RRG
Skyward Specialty Ins Group
Blue Insurance Group
Blue Insurance Group
Farm Group
Insurance Group
Farm Group
Progressive Insurance Group
Mutual Ins Companies
Insurance Group
Skyward Specialty Ins Group Progressive Insurance Group
Blue Insurance Group
Yr/5
Direct Written Premium (DPW)
Ind. Agent DPW $1,235,591,000
IA+MGA+IA Mixed Penetration 26%
Affiliated and
Premium
Insurers
IA+MGA+IA Mixed Insurers 66
1 yr/5 yr: IA+MGA+IA Mixed 3%/3%
Exclusive Agents DPW $2,233,582,000
Exclusive Penetration 46%
Exclusive Insurers 19
1 yr/5 yr: Exclusive 0%/
Top 5 Groups or Unaffiliated Single(s)
State Farm Group (G)
Insurance Group
Hathaway Insurance Group
Insurance Group
or Average
Progressive Security Insurance Company
Fire
Insurance Company
Insurance Company
GoAuto Insurance Company
American
State Farm Mutual Automobile
Allstate Property and
Farm Bureau Casualty
GEICO Casualty Company
Progressive Paloverde Insurance Company
GEICO Secure Insurance Company
Fortegra Specialty Insurance Company
Direct DPW $1,363,788,000
Direct Penetration 28%
Direct Insurers 26
1 yr/5 yr: Direct 4%/7%
Surplus Lines DPW $17,000
Surplus Lines Utilization 0 0%
Surplus Lines Insurers 1
yr/5 yr: Surplus Lines
2021 DPW $1,358,800,000 $913,362,000 $614,153,000 $613,154,000 $270,225,000 $4,832,957,000 $586,340,000 $116,591,000 $72,776,000 $58,208,000 $33,215,000 $167,364,000 $62,190,000 $4,695,000 $1,304,683,000 $363,496,000 $219,755,000 $422,422,000 $327,021,000 $106,952,000
2021 Adj Loss Ratio
2020 2021 Growth Rate
Name or ALL L O B DPW
Top 10 Pure Independent Agent Broker Policy Issuing Insurers
Top 3 MGA/Wholesale Policy Issuing Insurers
Top 3 Captive Exclusive Policy Issuing Insurers
Top 3 Direct Policy Issuing Insurers
Top 3 Surplus Lines Policy Issuing Insurers
$17,000
Insurance Group
Insurance Group
Mutual
Companies
American Capital Group
Farm Group
Berkshire Hathaway
Ind. Agent DPW $512,811,000
IA+MGA+IA Mixed Penetration 87%
IA+MGA+IA Mixed Insurers 194
1 yr/5 yr: IA+MGA+IA Mixed 24%/12%
Exclusive Agents DPW $15,960,000
Exclusive Penetration 3%
Exclusive Insurers 13
1 yr/5 yr: Exclusive 15%/10%
Direct DPW $50,734,000
Direct Penetration 9%
Direct Insurers 16
1 yr/5 yr: Direct 7%/5%
Surplus Lines DPW $240,083,000
Surplus Lines Utilization 40 6%
Surplus Lines Insurers 74
1 yr/5 yr: Surplus Lines 26%/15%
Top 10
GeoVera
GeoVera
Westchester
Top 3
Top 3
2021 DPW $57,896,000 $52,680,000 $30,766,000 $26,809,000 $23,015,000 $591,898,000 $23,015,000 $20,932,000 $16,519,000 $16,172,000 $15,775,000 $6,801,000 $5,385,000 $3,994,000 $6,459,000 $2,998,000 $2,636,000 $19,473,000 $9,465,000 $7,091,000 $23,015,000 $20,932,000 $16,519,000
2021 Adj Loss Ratio
2020 2021 Growth Rate 27%
Group Name or ALL L O B DPW
U
Insurance Group
Group
Insurance Group
Exclusive Policy Issuing Insurers
Top 3 Direct Policy Issuing Insurers
Top 3 Surplus Lines Policy Issuing Insurers
Ind. Agent DPW $43,121,000
IA+MGA+IA Mixed Penetration 95%
IA+MGA+IA Mixed Insurers 118
1 yr/5 yr: IA+MGA+IA Mixed 28%/12%
Exclusive Agents DPW $501,000
Exclusive Penetration 1%
Exclusive Insurers 5
1 yr/5 yr: Exclusive 14%/7%
Top
Top
Sompo
Tower
Federated
Lexington
Scottsdale
AIG
Direct DPW $1,532,000
Direct Penetration 3%
Direct Insurers 5 1 yr/5 yr: Direct 10%/ 4%
Surplus Lines DPW $3,180,000
Surplus Lines Utilization
Surplus Lines Insurers
yr/5
Lines
2021 DPW $16,176,000 $7,055,000 $5,255,000 $2,398,000 $2,300,000 $45,215,000 $6,944,000 $3,918,000 $2,391,000 $1,929,000 $1,317,000 $123,000 $39,000 $25,000 $225,000 $138,000 $60,000 $883,000 $591,000 $37,000 $920,000 $287,000 $254,000 $12,000
2021 Adj Loss Ratio
2020 2021 Growth Rate 25%
26%
Name or ALL L O B
Sompo Holdings US Group
Group
America Group
Top
Insurers
Top 3 Captive Exclusive Policy Issuing Insurers
Top 3 Direct Policy Issuing Insurers
Top 3 Surplus Lines Policy Issuing Insurers
Top Individual RRG
Hill Group
Marine
Federated Mutual Group
Liberty Mutual Ins Companies
International Group
Steadfast
Ind. Agent DPW $4,094,000
IA+MGA+IA Mixed Penetration 77%
IA+MGA+IA Mixed Insurers 59
1 yr/5 yr: IA+MGA+IA Mixed 19%/7%
Exclusive Agents DPW $1,191,000
Exclusive Penetration 23%
Exclusive Insurers 7
yr/5
Direct DPW $2,000
Direct Penetration 0%
Direct Insurers 1
yr/5 yr:
Surplus Lines DPW $813,000
Surplus Lines Utilization 15 4%
Surplus Lines Insurers 14
yr/5 yr: Surplus Lines 118%/36%
Top
2021 DPW $1,732,000 $1,057,000 $719,000 $395,000 $239,000 $5,293,000 $1,716,000 $577,000 $215,000 $202,000 $181,000 $84,000 $11,000 $2,000 $1,057,000 $88,000 $20,000 $2,000 $577,000 $105,000 $42,000
2020 2021 Growth Rate
Name or
Top
Insurers
Top 3 Captive Exclusive Policy Issuing Insurers
Top 3 Direct Policy Issuing Insurers
Top 3 Surplus Lines Policy Issuing Insurers
Top 5 Groups
Farm
Scottsdale
Company
Ind. Agent DPW $494,570,000
IA+MGA+IA Mixed Penetration 84%
IA+MGA+IA Mixed Insurers 212
1 yr/5 yr: IA+MGA+IA Mixed 5%/6%
Exclusive Agents DPW $79,115,000
Exclusive Penetration 13%
Exclusive Insurers 13
1 yr/5 yr: Exclusive
Direct DPW $9,465,000
Direct Penetration 2%
Direct Insurers 10 1 yr/5 yr: Direct 7%/ 13%
Surplus Lines DPW $167,704,000
Surplus Lines Utilization 28 4%
Surplus Lines Insurers 66
yr/5 yr: Surplus Lines 11%/11%
Independent
State Farm
Liberty Mutual
Scottsdale Insurance Company
Independent Specialty
Steadfast
Top 10 Pure
2021 DPW $61,845,000 $43,675,000 $43,644,000 $40,492,000 $38,610,000 $590,025,000 $41,382,000 $29,883,000 $24,575,000 $23,139,000 $18,771,000 $24,629,000 $7,754,000 $6,605,000 $61,845,000 $3,592,000 $2,163,000 $3,474,000 $1,781,000 $1,425,000 $41,382,000 $24,629,000 $13,331,000
2021 Adj Loss Ratio
2020 2021 Growth Rate
Group Name or ALL L O B DPW
Group
Group
International Group
Mutual
Top 3 MGA/Wholesale
Top 3
Top 3 Direct Policy
Insurers
Top 3 Surplus Lines Policy Issuing Insurers
Companies
Hathaway
Corporation Group
Corporation
Farm Group
Insurance
Mutual
CUMIS Insurance Society Group
Group
Corporation Group
Direct Written Premium (DPW)
Ind. Agent DPW $5,423,000
IA+MGA+IA Mixed Penetration 82%
Active Affiliated and
Yr/5
Premium
Top 5 Groups or Unaffiliated
International Group
Sompo Holdings
Farm Group
Group
Endurance American Specialty Ins Co
Insurance
Allianz Global
Insurance America,
Evanston Insurance Company
Casualty
Insurance
State Farm General Insurance Company
State Farm Fire and Casualty Company
Federated Mutual Insurance Company
Westport Insurance Corporation
Liberty Mutual Fire Insurance Company
Services
Endurance American Specialty Ins Co
Insurance Company
Evanston Insurance Company
IA+MGA+IA Mixed Insurers 78
1 yr/5 yr: IA+MGA+IA Mixed 17%/5%
Exclusive Agents DPW $894,000
Exclusive Penetration 13%
Exclusive Insurers 11
yr/5 yr: Exclusive
Direct DPW $330,000
Direct Penetration 5%
Direct Insurers 8 1 yr/5 yr: Direct
23%
Surplus Lines DPW $3,789,000
Surplus Lines Utilization 57 0%
Surplus Lines Insurers 34
yr/5 yr: Surplus Lines 24%/5%
2021 DPW $1,055,000 $879,000 $829,000 $799,000 $449,000 $6,650,000 $877,000 $636,000 $547,000 $379,000 $304,000 $448,000 $65,000 $11,000 $496,000 $333,000 $23,000 $104,000 $80,000 $79,000 $877,000 $636,000 $448,000
2021 Adj Loss Ratio
2020 2021 Growth Rate 43%
Group Name or ALL L O B DPW
Top 10 Pure Independent Agent
Policy
Insurers
Sompo Holdings US Group American International Group
US PC Ins Companies
Reinsurance America Group American International Group
Top 3 MGA/Wholesale Policy Issuing Insurers
Top 3 Captive Exclusive Policy Issuing Insurers
Top 3 Direct Policy Issuing Insurers
Top 3 Surplus Lines Policy Issuing Insurers
Markel Corporation Group Tokio Marine US PC Group Argo Group State Farm Group State Farm Group
Mutual Group Swiss Reinsurance Group Liberty Mutual Ins Companies USAA Group
Sompo Holdings US Group American International Group Markel Corporation Group
Ind. Agent DPW $47,547,000
IA+MGA+IA Mixed Penetration
IA+MGA+IA Mixed Insurers 12
1 yr/5 yr: IA+MGA+IA Mixed 6%/ 1%
Exclusive Agents DPW $0
Exclusive Penetration 0%
Exclusive Insurers 0
1 yr/5 yr: Exclusive #DIV/0!
Top
Direct DPW $806,000
Direct Penetration 2%
Direct Insurers 2 1 yr/5 yr: Direct 307%/ 5%
Surplus Lines DPW $0
Surplus Lines Utilization 0 0%
Surplus Lines Insurers 0
yr/5 yr: Surplus Lines #DIV/0!
Top 10
2021 Adj Loss Ratio
2020 2021 Growth Rate
Name or ALL L O B DPW
Top
Top
2021 DPW $21,728,000 $10,643,000 $5,089,000 $2,774,000 $2,768,000 $48,353,000 $21,728,000 $10,643,000 $5,089,000 $2,774,000 $2,768,000 $4,000 $640,000 $252,000
Top 3 Direct
Top
Insurers
Insurers
Insurers
Affiliated
Top 5 Groups
State Farm Group
Group
Insurance
Corporation
Travelers Indemnity
Travelers
Fire
Markel Insurance
State Farm Fire and
Scottsdale Insurance Company
Ind. Agent DPW $5,067,000
IA+MGA+IA Mixed Penetration 34%
IA+MGA+IA Mixed Insurers 12
1 yr/5 yr: IA+MGA+IA Mixed 9%/ 5%
Exclusive Agents DPW $9,650,000
Exclusive Penetration 65%
Exclusive Insurers 3 1 yr/5 yr: Exclusive
Direct DPW $25,000
Direct Penetration 0%
Direct Insurers 1 1 yr/5 yr: Direct #DIV/0!
Surplus Lines DPW ($48,000)
Surplus Lines Utilization 0 3%
Surplus Lines Insurers 1
yr/5 yr:
Lines #NUM!
2021 DPW $7,760,000 $4,640,000 $1,889,000 $265,000 $190,000 $14,740,000 $1,408,000 $1,202,000 $1,178,000 $852,000 $190,000 $265,000 $3,000 $0 $7,642,000 $1,889,000 $119,000 $25,000 $17,000
2021 Adj Loss Ratio
2021 Growth Rate
Name or
L
Top 10 Pure Independent Agent
Policy Issuing Insurers
Top 3 MGA/Wholesale Policy Issuing Insurers
Top 3 Captive
Policy
Insurers
Top 3 Direct Policy Issuing Insurers
Top 3 Surplus Lines Policy Issuing Insurers
Individual
Corporation
Ind. Agent DPW $209,752,000
IA+MGA+IA Mixed Penetration 74%
IA+MGA+IA Mixed Insurers 21
1 yr/5 yr: IA+MGA+IA Mixed 7%/4%
Exclusive Agents DPW $54,973,000
Exclusive Penetration 19%
Exclusive Insurers 4
yr/5 yr: Exclusive
Top
National
American Bankers
Wright
Allstate
USAA
Trisura
Direct DPW $18,617,000
Direct Penetration 7%
Direct Insurers 3 1 yr/5 yr: Direct 6%/2%
Surplus Lines DPW $392,000
Surplus Lines Utilization 0 1%
Surplus Lines Insurers 1
yr/5 yr:
Lines
Top 10 Pure
2021 DPW $96,837,000 $56,062,000 $30,975,000 $15,410,000 $12,658,000 $283,342,000 $30,975,000 $18,925,000 $15,410,000 $10,512,000 $9,277,000 $96,837,000 $3,310,000 $1,601,000 $37,137,000 $12,658,000 $4,700,000 $10,861,000 $5,674,000 $2,082,000 $392,000
2021 Adj Loss Ratio
2020 2021 Growth Rate
Name
Top 3 MGA/Wholesale
Top 3
Top 3 Direct Policy Issuing Insurers
Top 3 Surplus Lines Policy Issuing Insurers
Affiliated
Ind. Agent DPW $11,657,000
IA+MGA+IA Mixed Penetration 86%
IA+MGA+IA Mixed Insurers 70
1 yr/5 yr: IA+MGA+IA Mixed 15%/3%
Exclusive Agents DPW $245,000
Exclusive Penetration 2%
Exclusive Insurers 6
yr/5
Direct DPW $1,710,000
Direct Penetration 13%
Direct Insurers 4 1 yr/5 yr: Direct
Top 5 Groups
Travelers Group (G)
CUMIS Insurance Society
American
INA Group
Insurance
Travelers Casualty and
Insurance Company
Surety Company
Great American Alliance
American
Southwest Marine and General
Insurance
York Marine and
Federated Mutual Insurance
State Farm Fire and
Federated Service
CUMIS Insurance Society,
Mutual Insurance
AXIS Surplus Insurance Company
Pacific Insurance Company, Limited
Specialty Insurance Company
Surplus Lines DPW $290,000
Surplus Lines Utilization 2 1%
Surplus Lines Insurers 11
yr/5 yr: Surplus Lines 14%/9%
2021 DPW $5,138,000 $1,670,000 $1,339,000 $1,319,000 $1,153,000 $13,627,000 $5,117,000 $1,285,000 $771,000 $756,000 $582,000 $89,000 $77,000 $57,000 $90,000 $73,000 $50,000 $1,670,000 $25,000 $9,000 $83,000 $45,000 $35,000
2021 Adj Loss Ratio
Top 10 Pure Independent Agent
Policy
2020 2021 Growth Rate
Name or ALL L O B DPW
Top 3 MGA/Wholesale Policy
Insurers
Top 3 Captive Exclusive Policy Issuing Insurers
Top 3 Direct Policy Issuing Insurers
Top 3 Surplus Lines Policy Issuing Insurers
Insurers
American
American
Group
Group
Group
Ind. Agent DPW $388,564,000
IA+MGA+IA Mixed Penetration 92%
IA+MGA+IA Mixed Insurers 200
1 yr/5 yr: IA+MGA+IA Mixed 17%/10%
Exclusive Agents DPW $12,149,000
Exclusive Penetration 3%
Exclusive Insurers 12
1 yr/5 yr: Exclusive 4%/1%
Top
International
Direct DPW $20,863,000
Direct Penetration 5%
Direct Insurers 15
1 yr/5 yr: Direct 8%/ 6%
Surplus Lines DPW $210,484,000
Surplus Lines Utilization 49 7%
Surplus Lines Insurers 79
1 yr/5 yr: Surplus Lines 43%/21%
Starr Surplus Lines Insurance
Foremost Insurance
General Security
United National Insurance Company
Union National Fire Insurance
American Security Insurance Company
Starr Surplus Lines Insurance Company
StarStone Specialty Insurance Company
General Security Indemnity Co
Top 10
2021 DPW $37,451,000 $24,467,000 $23,857,000 $18,987,000 $18,356,000 $423,259,000 $37,432,000 $23,857,000 $18,356,000 $17,817,000 $14,992,000 $2,510,000 $2,346,000 $2,308,000 $5,914,000 $3,364,000 $1,052,000 $7,942,000 $2,849,000 $2,506,000
2021 Adj Loss Ratio
2020 2021 Growth Rate 9% 33% 31709%
13% 11%
Name or ALL L O B
Top 3 MGA/Wholesale
Top 3
Insurers
Top 3 Direct Policy Issuing Insurers
Top 3 Surplus Lines Policy Issuing Insurers
$37,432,000 $23,857,000 $17,817,000
International Group
Specialty Insurance Group
Insurance Group
Indemnity Group
Insurance
Direct
Affiliated
Top 5 Groups or
Farm Group (G)
Insurance Group
Group
Mutual
Insurance Group
Progressive Property Insurance Company
Vehicle and
Insurance Co
Insurance
United Property & Casualty
Trust
Fire
State Farm Fire and Casualty Company
Insurance Company
Allstate Indemnity Company
Louisiana Farm Bureau Mutual
United Services
Personal Insurance Company
Dover Bay Specialty Insurance Company
GeoVera Specialty Insurance Company
Scottsdale Insurance Company
Ind. Agent DPW $899,758,000
IA+MGA+IA Mixed Penetration 44%
IA+MGA+IA Mixed Insurers 92
1 yr/5 yr: IA+MGA+IA Mixed 10%/8%
Exclusive Agents DPW $794,920,000
Exclusive Penetration 39%
Exclusive Insurers 15
1 yr/5 yr: Exclusive 5%/1%
Direct DPW $325,749,000
Direct Penetration 16%
Direct Insurers 13
1 yr/5 yr: Direct 6%/2%
Surplus Lines DPW $88,373,000
Surplus Lines Utilization 4 3%
Surplus Lines Insurers 25
1 yr/5 yr: Surplus Lines 6%/3%
2021 DPW $550,032,000 $243,844,000 $140,502,000 $136,856,000 $105,832,000 $2,055,107,000 $105,373,000 $57,542,000 $40,235,000 $36,162,000 $34,663,000 $65,341,000 $44,823,000 $43,873,000 $513,257,000 $85,830,000 $64,449,000 $96,397,000 $54,505,000 $43,356,000 $22,733,000 $20,871,000 $9,371,000
2021 Adj Loss Ratio
2020 2021 Growth Rate 6%
Name or ALL L O B DPW
Top 10 Pure Independent Agent
Policy
Insurers
Progressive Insurance Group
Insurance Group
Insurance Group
Mutual Ins Companies
Mutual
Top 3 MGA/Wholesale Policy Issuing Insurers
Top 3 Captive Exclusive Policy Issuing Insurers
Top 3 Direct Policy Issuing Insurers
Top 3 Surplus Lines Policy Issuing Insurers
Individual RRG
Companies
Insurance Group
Insurance Group
Farm Group
Group
Ind. Agent DPW $398,008,000
IA+MGA+IA Mixed Penetration 78%
IA+MGA+IA Mixed Insurers 252
1 yr/5 yr: IA+MGA+IA Mixed 18%/6%
Exclusive Agents DPW $85,0160,000
Exclusive Penetration 17%
Exclusive Insurers 20 1 yr/5 yr: Exclusive 8%/5%
Top
Direct DPW $27,864,000
Direct Penetration 5%
Direct Insurers 24
1 yr/5 yr: Direct 9%/9%
Surplus Lines DPW $27,305,000
Surplus Lines Utilization 5 3%
Surplus Lines Insurers 70
yr/5 yr: Surplus Lines 21%/11%
American
Liberty Insurance
Louisiana
Lexington Insurance Company
Company
Company
Top 10
2021 Adj Loss Ratio
2020 2021 Growth Rate
Name or ALL L O B DPW
Insurance Companies
Group
Insurance
Top 3
Top 3
2021 DPW $114,339,000 $53,964,000 $41,806,000 $25,263,000 $22,857,000 $511,934,000 $114,003,000 $41,804,000 $15,724,000 $13,955,000 $11,102,000 $3,715,000 $3,371,000 $3,136,000 $47,322,000 $22,857,000 $6,616,000 $10,353,000 $4,030,000 $3,238,000 $3,987,000 $2,117,000 $2,046,000
Top 3 Direct Policy Issuing Insurers
Top 3 Surplus Lines Policy Issuing Insurers
Insurance
Mutual
Companies
Affiliated
Ind. Agent DPW $100,441,000
IA+MGA+IA Mixed Penetration 93%
IA+MGA+IA Mixed Insurers 63
1 yr/5 yr: IA+MGA+IA Mixed 5%/3%
Exclusive Agents DPW $2,121,000
Exclusive Penetration 2%
Exclusive Insurers 5
1 yr/5 yr: Exclusive
Top 5 Groups
Group (G)
Hathaway Insurance Group
Insurance Companies
Berkley Insurance Group
Mutual Insurance Companies
Average
National Fire & Marine Insurance Co
Insurance Company
American Casualty Company of Reading,
Ironshore Specialty Insurance
Casualty Company
LAMMICO Risk Retention Group,
TDC Specialty Insurance Company
Insurance Company
Liberty Insurance Underwriters,
Care
Pharmacists Mutual Insurance Company
National Guardian
Ophthalmic Mutual Insurance Co
Future Care Risk Retention Group,
National Fire & Marine Insurance Co
Admiral Insurance Company
Ironshore Specialty Insurance Co
National
Direct DPW $5,658,000
Direct Penetration 5%
Direct Insurers 9
1 yr/5 yr: Direct 4%/17%
Surplus Lines DPW $35,295,000
Surplus Lines Utilization 32 5%
Surplus Lines Insurers 34
yr/5 yr: Surplus Lines 12%/8%
2021 DPW $48,216,000 $9,091,000 $6,634,000 $5,015,000 $4,997,000 $108,529,000 $5,301,000 $4,799,000 $4,195,000 $3,549,000 $2,385,000 $2,745,000 $1,619,000 $1,222,000 $1,044,000 $644,000 $414,000 $3,262,000 $867,000 $492,000 $5,301,000 $4,799,000 $3,549,000 $3,262,000
2021 Adj Loss Ratio
2020 2021 Growth Rate 3%
Top 10 Pure Independent
Insurers
Name or ALL L O B DPW
Hathaway Ins Group
Berkley Insurance Group
Insurance Companies
Mutual
Top 3 MGA/Wholesale Policy Issuing Insurers
Top 3 Captive Exclusive Policy Issuing Insurers
Top 3 Direct Policy Issuing Insurers
Top 3 Surplus Lines Policy Issuing Insurers
Top Individual RRG
Companies
LAMMICO Group
Company
Mutual
Mutual
Hathaway
Direct
Ind. Agent DPW $128,983,000
IA+MGA+IA Mixed Penetration 100%
IA+MGA+IA Mixed Insurers 10
1 yr/5 yr: IA+MGA+IA Mixed 43%/11%
Exclusive Agents DPW $15,000
Exclusive Penetration
Exclusive Insurers 1
yr/5 yr:
Top 5 Groups
Direct DPW $0
Direct Penetration
Direct Insurers 0
yr/5 yr: Direct
Surplus Lines DPW $0
Surplus Lines Utilization 0 0%
Surplus Lines Insurers 0
yr/5 yr:
Lines
2021 Adj Loss Ratio
2021 Growth Rate
Group Name or ALL L O B DPW
Top 10 Pure Independent Agent Broker Policy Issuing Insurers
Top 3 MGA/Wholesale Policy Issuing Insurers
Top 3
2021 DPW $75,381,000 $30,496,000 $14,869,000 $4,027,000 $2,098,000 $128,996,000 $18,821,000 $14,869,000 $11,675,000 $1,544,000 $977,000 $2,484,000 $2,098,000 $857,000 $15,000
Policy
Insurers
Top 3 Direct Policy Issuing Insurers
Top 3 Surplus
Policy Issuing Insurers
Group
Ind. Agent DPW $149,564,000
IA+MGA+IA Mixed Penetration 96%
IA+MGA+IA Mixed Insurers 70
1 yr/5 yr: IA+MGA+IA Mixed 1%/3%
Exclusive Agents DPW $0
Exclusive Penetration
Exclusive Insurers 0
yr/5
Direct DPW $5,734,000
Direct Penetration
Direct Insurers
yr/5 yr:
Top
Ascot
Surplus Lines DPW $3,688,000
Surplus Lines Utilization 2 4%
Surplus Lines Insurers 10
yr/5 yr: Surplus Lines 25%/
Houston Casualty Company
Top 10 Pure Independent Agent
Top 3
Top 3
2021 DPW $28,775,000 $10,339,000 $10,224,000 $9,527,000 $9,248,000 $155,699,000 $10,339,000 $8,981,000 $8,900,000 $8,702,000 $6,333,000 $25,812,000 $4,310,000 $4,171,000 $5,547,000 $81,000 $56,000 $2,207,000 $433,000 $388,000
Ratio
2021 Growth Rate
Group Name or ALL L O B DPW
Insurers
Insurers
Ascot Insurance U S Group
Insurance Group
US Insurance Group
Marine
Top 3 Direct Policy Issuing Insurers
Top 3 Surplus
Top
Policy
Insurers
Marine
Top
Travelers
Scottsdale
Ind. Agent DPW $255,944,000
IA+MGA+IA Mixed Penetration 94%
IA+MGA+IA Mixed Insurers 221
1 yr/5 yr: IA+MGA+IA Mixed 15%/8%
Exclusive Agents DPW $2,381,000
Exclusive Penetration 1%
Exclusive Insurers 9
1 yr/5 yr: Exclusive
Direct DPW $8,584,000
Direct Penetration 3%
Direct Insurers 19
1 yr/5 yr: Direct 12%/2%
Surplus Lines DPW $106,988,000
Surplus Lines Utilization 39 3%
Surplus Lines Insurers 90
yr/5 yr: Surplus Lines 28%/12%
Top
2021 DPW $34,510,000 $31,994,000 $20,823,000 $17,768,000 $14,364,000 $272,435,000 $30,333,000 $29,149,000 $10,748,000 $9,180,000 $7,010,000 $3,629,000 $2,802,000 $2,527,000 $1,113,000 $452,000 $408,000 $5,304,000 $935,000 $452,000 $7,010,000 $6,797,000 $4,294,000 $3,429,000
2021 Adj Loss Ratio
2020 2021 Growth Rate 19%
Name or ALL L O B DPW
Travelers Group
Insurance Companies
Reinsurance America Group
Group
Group
Top
Policy Issuing Insurers
Top 3 Captive Exclusive Policy Issuing Insurers
Top 3 Direct Policy Issuing Insurers
Top 3 Surplus Lines Policy Issuing Insurers
Top Individual RRG
Markel Corporation Group
Marine US PC Group
Group
Mutual Ins Companies
Mutual
Companies
Mutual Group
Reinsurance Group
Insurance Society Group
Mutual
Ind. Agent DPW $788,887,000
IA+MGA+IA Mixed Penetration 88%
IA+MGA+IA Mixed Insurers 326
1 yr/5 yr: IA+MGA+IA Mixed 7%/9%
Exclusive Agents DPW $48,627,000
Exclusive Penetration 5%
Exclusive Insurers 28
1 yr/5 yr: Exclusive
Top
Travelers Group
Scottsdale Insurance Company
Travelers
Crum
Evanston Insurance Company
BCS
State Farm Fire
Federated Mutual
Liberty Surplus Insurance
CUMIS Insurance
Farm
Scottsdale Insurance Company
AXIS Surplus Insurance Company
Evanston Insurance Company
Top 10 Pure
2021 DPW $52,145,000 $48,136,000 $44,425,000 $41,790,000 $37,781,000 $896,175,000 $33,414,000 $24,222,000 $23,194,000 $20,735,000 $19,653,000 $21,664,000 $12,797,000 $10,023,000 $21,325,000 $5,924,000 $5,398,000 $5,983,000 $5,579,000 $5,165,000 $33,414,000 $23,194,000 $21,664,000 $2,966,000
2021 Adj Loss Ratio
Direct DPW $42,797,000
Direct Penetration 5%
Direct Insurers 33
1 yr/5 yr: Direct 8%/5%
2020 2021 Growth Rate
Surplus Lines DPW $413,314,000
Surplus Lines Utilization 46 1%
Surplus Lines Insurers 112
1 yr/5 yr: Surplus Lines 22%/13%
Name or ALL L O B
Top 3 MGA/Wholesale Policy Issuing Insurers
Insurers
Group
Group
US Operations
Financial (USA) Group
Berkley Insurance
Corporation Group
Top 3 Captive Exclusive Policy Issuing Insurers
Top 3 Direct Policy Issuing Insurers
Top 3 Surplus Lines Policy Issuing Insurers
Top Individual RRG
Top
Direct Written Premium (DPW)
Ind. Agent DPW $5,839,000
IA+MGA+IA Mixed Penetration 100%
Affiliated
Groups
Stratford
IA+MGA+IA Mixed Insurers 7
1 yr/5 yr: IA+MGA+IA Mixed 40%/12%
Exclusive Agents DPW $0
Exclusive Penetration 0%
Direct DPW
Penetration
Surplus Lines DPW
Surplus Lines Utilization
Top 10
2021 DPW $4,541,000 $817,000 $328,000 $106,000 $26,000 $5,839,000 $576,000 $328,000 $241,000 $26,000 $106,000 $21,000
Exclusive Insurers 0 1 yr/5 yr: Exclusive 2021 Adj Loss Ratio
Direct Insurers
yr/5 yr:
2021 Growth Rate
Surplus Lines Insurers
yr/5 yr: Surplus Lines
Group Name or ALL L O B DPW
Top
Top
Top
Top
Direct
Insurers
Insurers
Group
Affiliated
Ind. Agent DPW $20,316,000
IA+MGA+IA Mixed Penetration 81%
IA+MGA+IA Mixed Insurers 43
1 yr/5 yr: IA+MGA+IA Mixed 49%/11%
Exclusive Agents DPW
Exclusive Penetration
Exclusive Insurers 0
yr/5
Direct DPW $4,653,000
Direct Penetration 19%
Direct Insurers 5
yr/5 yr:
14%/0%
Top 5 Groups
American International
Assurant
Arch Specialty
National
Western
Transverse
Surplus Lines DPW $10,297,000
Surplus Lines Utilization 41 2%
Surplus Lines Insurers 20
yr/5 yr: Surplus Lines 29%/41%
Arch Specialty Insurance Company
Insurance
National
Top 10 Pure Independent Agent
Ratio
2021 Growth Rate
Group Name or ALL L O B DPW
Top 3 MGA/Wholesale
Top 3
2021 DPW $5,871,000 $3,445,000 $3,241,000 $2,761,000 $1,726,000 $24,978,000 $2,689,000 $2,436,000 $2,344,000 $1,376,000 $1,024,000 $524,000 $333,000 $217,000 $3,445,000 $970,000 $232,000 $2,689,000 $2,344,000 $1,376,000
Policy
Insurers
Arch Insurance Group American International Group
International Group
Hathaway Ins Group
Insurance Group
Insurers
Policy
Top 3 Direct Policy Issuing Insurers
Top 3 Surplus Lines Policy Issuing Insurers
International Group
Insurance Group
Group
Insurance Group
International
Ind. Agent DPW $44,503,000
IA+MGA+IA Mixed Penetration 97%
IA+MGA+IA Mixed Insurers 132
1 yr/5 yr: IA+MGA+IA Mixed 1%/5%
Exclusive Agents DPW $821,000
Exclusive Penetration
Exclusive Insurers 8
yr/5 yr: Exclusive
Direct DPW $595,000
Direct Penetration 1%
Direct Insurers 4
yr/5 yr: Direct
Surplus Lines DPW $26,310,000
Surplus Lines Utilization 57 3%
Surplus Lines Insurers
yr/5 yr: Surplus Lines
Crum
Western
Federated
Crum &
Company
Top
Top
Top
2021 DPW $5,075,000 $3,714,000 $2,791,000 $2,770,000 $2,734,000 $45,936,000 $4,888,000 $2,734,000 $2,419,000 $1,875,000 $1,527,000 $1,435,000 $1,007,000 $708,000 $430,000 $142,000 $120,000 $386,000 $192,000 $151,000 $4,888,000 $2,734,000 $1,875,000
Top 3
2021 Adj Loss Ratio
2020 2021 Growth Rate
Name or ALL L O B DPW
Insurers
Top 3 Surplus Lines Policy Issuing Insurers
Fairfax Financial (USA) Group
International Group
International Group
Reinsurance America Group
International Group
Mutual
Mutual
Financial (USA)
Ind. Agent DPW $118,274,000
IA+MGA+IA Mixed Penetration 87%
IA+MGA+IA Mixed Insurers 106
1 yr/5 yr: IA+MGA+IA Mixed 18%/2%
Exclusive Agents DPW $4,503,000
Exclusive Penetration 3%
Exclusive Insurers 7
yr/5 yr: Exclusive 103%/11
Top
Top 10
Travelers Casualty
Liberty Mutual
Canopius US Insurance,
Accelerant Specialty Insurance Company
Peleus Insurance Company
Direct DPW $6,731,000
Direct Penetration 5%
Direct Insurers 2 1 yr/5 yr: Direct 7%/1%
Surplus Lines DPW ($7,000)
Surplus Lines Utilization 0 0%
Surplus Lines Insurers 3 1 yr/5 yr: Surplus Lines
2021
Ratio
2020 2021 Growth Rate
Group Name or ALL L O B DPW
Group
Insurance Companies
Group
Insurance
Top 3
Top 3
2021 DPW $9,926,000 $8,941,000 $8,799,000 $8,562,000 $8,374,000 $135,346,000 $8,670,000 $8,231,000 $7,267,000 $6,610,000 $5,980,000 $3,255,000 $2,406,000 $1,458,000 $3,442,000 $693,000 $314,000 $6,728,000 $3,000 $139,000 $102,000 $2,000
Top 3 Direct Policy
Top 3 Surplus Lines Policy Issuing Insurers
Group
Group
Ind. Agent DPW $762,088,000
IA+MGA+IA Mixed Penetration 95%
IA+MGA+IA Mixed Insurers 215
1 yr/5 yr: IA+MGA+IA Mixed 3%/0%
Exclusive Agents DPW $11,873,000
Exclusive Penetration
Exclusive Insurers 12
yr/5
Direct DPW $28,430,000
Penetration
Direct Insurers
yr/5
Surplus Lines
Surplus Lines
Surplus Lines
Top 10
Louisiana Workers'
State
American
Top
Top 3
2021 DPW $229,758,000 $66,243,000 $49,664,000 $38,423,000 $33,609,000 $804,973,000 $229,758,000 $58,618,000 $23,823,000 $14,689,000 $14,000,000 $21,680,000 $7,625,000 $4,227,000 $5,478,000 $2,567,000 $1,466,000 $8,015,000 $5,106,000 $3,699,000
Top 3 Direct
Top
Policy Issuing Insurers
2021
Rate
Name
All P C Lines of P C Business
Accident & Health
Aggregate Write ins Aircraft (all perils)
All Commercial Auto
All Private Passenger Auto Allied Perils Only
Boiler & Machinery
Burglary & Theft Commercial Multi Peril Credit Earthquake
Excess Workers' Comp

Farmowners Multi Peril
Federal Flood Fidelity
Financial Guaranty Fire Peril Only
Homeowners Multi Peril Inland Marine International Medical Malpractice Mortgage Guaranty Multi Peril Crop Ocean Marine
Other Liability (Claims made) Other Liability (Occurrence)
Private Crop
Private Flood Products Liability
Surety Warranty
Workers' Compensation Total (All Lines)
All Direct Written Premium 82,259,000 16,964,000 48,990,000 989,262,000 4,832,960,000 591,898,000 45,214,000 5,287,000 590,031,000 27,957,000 6,650,000 48,353,000 14,742,000 283,342,000 13,624,000 8,566,000 423,264,000 2,055,110,000 511,936,000 0 108,530,000 64,835,000 128,998,000 155,696,000 272,430,000 896,168,000 5,839,000 24,977,000 45,931,000 135,346,000 8,436,000 804,978,000 13,248,577,000
1 Year Loss Ratio
59% 52% 46% 79% 76% 592% 22% 47% 345% 65% 17% 49% 206% 263% 8% 0% 323% 408% 80% #REF! 31% 28% 108% 123% 56% 64% 128% 66% 54% 22% 92% 41% 169%
5 Year Loss Ratio
66% 68% 63% 85% 67% 241% 68% 35% 147% 51% 8% 50% 120% 83% 43% 3% 139% 156% 60% #REF! 17% 20% 115% 79% 48% 61% 230% 31% 37% 20% 85% 53% 92%
1-Year Growth
7% 4% 3% 9% 2% 9% 11% 4% 5% 2% 1% 1% 1% 3% 2% 16% 6% 2% 6% 4% 2% 11% 3% 7% 8% 12% 9% 3% 3% 19% 0% 4%
5-Year Growth 10% 5% 2% 15% 2% 16% 26% 16% 5% 15% 14% 5% 2% 6% 13% 1% 11% 0% 15% 4% 2% 43% 1% 15% 7% 39% 31% 2% 21% 2% 4% 5%
1-Year Penetration
60% 39% 99% 78% 26% 87% 95% 77% 84% 77% 82% 98% 34% 74% 86% 0% 92% 44% 78% #DIV/0! 93% 20% 100% 96% 94% 88% 100% 81% 97% 87% 58% 95% 57%
5-Year Penetration
58% 30% 97% 78% 25% 82% 95% 78% 82% 73% 80% 98% 41% 72% 85% 0% 85% 39% 77% #DIV/0! 93% 19% 100% 96% 93% 87% 100% 74% 95% 90% 59% 95% 54%
This P C Marketplace Summary classifies insurers into distribution styles based on the insurer’s reported marketing type(s).These marketing types are provided in what is known as a “Gallery Report” and made available by A M Best as part of various insurer attributes in their Best’s Financial Suite Below are the various marketing types reported by insurers in 2021
Affinity Group Marketing Bank
Broker
Career Agent
Direct Response
Exclusive/Captive Agent
General Agent
Inactive
Independent Agency Internet
Managing General Agent
Not Available Other Other Agency
Other Direct Worksite Marketing
The approach used by this P C Marketplace Summary is take each insurer’s reported marketing type and put data from that insurer into one of 6 distribution styles Some insurer classifications are obvious and straight forward Others are less so When insurers list multiple market types more weight is given to the marketing type listed first that closest aligns to each distribution style. About 10% of insurers have “Not Available” for their listed marketing type. These insurers represent less than 1% of all written premiums in 2021 and those insurers are categorized as “Other.”
Highlighted in the table below is All Distribution and then the 6 possible distribution styles used is this summary: (1) Pure IA or Broker, (2) MGA/Wholesale, (3) IA Mixed, (4) Exclusive Captive, (5) Direct and (6) Other. To arrive at figures generally for independent agent distribution, data from insurers categorized as (1) Pure IA or Broker, (2) MGA/Wholesale and (3) IA Mixed are combined. Other industry analysis of distribution may vary in how distribution styles are categorized Generally, however, the results are similar to the approach taken in this report
By controlling this distribution style classification for each insurer, flexibility is attained in providing data that matches an independent agent’s view of the marketplace. It allows determination of approximate penetrations of the distributions styles by line of business It allows creating lists of insurers by line of business for each distribution style To provide examples of the classification approach results, the top insurers in the in each distribution style are shown below under the heading “Largest Insurers by Distribution Style”, with the reported marketing type and premiums in Louisiana.
2021 Louisiana: All Lines of Business Distribution Style DPW (Premiums) in Millions of Dollars
Louisiana All P-C Lines of P C Business
Accident & Health Aggregate Write ins Aircraft (all perils)
All Commercial Auto
All Private Passenger Auto Allied Perils Only Boiler & Machinery Burglary & Theft Commercial Multi Peril Credit Earthquake
Excess Workers' Comp Farmowners Multi Peril Federal Flood Fidelity Financial Guaranty Fire Peril Only Homeowners Multi Peril Inland Marine International Medical Malpractice Mortgage Guaranty Multi Peril Crop Ocean Marine Other Liability (Claims made) Other Liability (Occurrence) Private Crop Private Flood Products Liability Surety Warranty Workers' Compensation Total (All Lines) Total (IA Focused Lines)
All Distribution (1+2+3+4+5+6) 82 17 49 989 4,833 592 45 5 590 28
48 15 283 14
423 2,055 512
109 65 129 156 272 896 6 25
135
805 13,249 13,040
Pure IA or Broker
MGA/ Wholesale
IA Mixed
Exclusive Captive
Direct
2021 Louisiana: All Lines of Business Distribution Style DPW (Premiums) in Millions of Dollars
Louisiana Policy Issuing Insurers
Progressive Security Insurance Company
Louisiana Workers' Compensation Corp
Imperial Fire and Casualty Insurance Co
Continental Casualty Company
Scottsdale Insurance Company
Safeco Insurance Company of Oregon
Progressive Property Insurance Company
National Union Fire Ins Co Pittsburgh PA
Travelers Property Casualty Co of Amer Foremost Insurance Co Grand Rapids, MI
Group
Progressive Insurance Group
Allstate Insurance Group
CNA Insurance Companies
Nationwide Group
Liberty Mutual Insurance Companies Progressive Insurance Group American International Group Travelers Group Farmers Insurance Group
2021 DPW 600 2 229 8 168 2 166 7 136.1 120.8 111.6 102 9 86 0 85 0
Listed Marketing Type
Independent Agency Independent Agency Independent Agency Independent Agency Independent Agency Independent Agency Independent Agency Broker Independent Agency Independent Agency
Top 10 Insurers Classified as MGA/Wholesale DPW (Premiums) in Millions of Dollars
Louisiana Policy Issuing Insurers
GoAuto Insurance Company
Wright National Flood Insurance Company
Houston Specialty Insurance Company
United Property & Casualty Ins Co
Old American Indemnity Company
Allied Trust Insurance Company
Occidental Fire and Casualty Co of NC
FedNat Insurance Company
Centauri National Insurance Company
Evanston Insurance Company
Group
...
Skyward Specialty Insurance Group United Insurance Group Old American Capital Group
IAT Insurance Group FedNat Insurance Group AU Holding Company Group Markel Corporation Group
2021 DPW 167 4 97.2 82.7 74.5 65 2 47 4 46 9 43 5 43 3 39 8
Listed Marketing Type
Managing General Agent Managing General Agent Managing General Agent Managing General Agent Managing General Agent Managing General Agent General Agent Managing General Agent Managing General Agent Managing General Agent
Top 10 Insurers Classified as IA-Mixed - DPW (Premiums) in Millions of Dollars
Louisiana Policy Issuing Insurers
Factory Mutual Insurance Company
American Agri Business Insurance Company
Louisiana Citizens Property Ins Corp LAMMICO
American Modern Property & Casualty Ins
Church Mutual Insurance Company, S I Automobile Club Inter Insurance Exchange
United Financial Casualty Company Affiliated FM Insurance Company Permanent General Assurance Corporation
Group
FM Global Group Sompo Holdings US Group
LAMMICO Group Munich American Holding Corp Co Church Mutual Insurance Group Auto Club Enterprises Ins Group Progressive Insurance Group FM Global Group American Family Insurance Group
2021 DPW 86.6 79 9 75 9
3
8 23 1 21 1 19 5 15 9
3
Listed Marketing Type Direct Response, Broker Other Agency Other Direct Response, Independent Agency Worksite Marketing Direct Response, Independent Agency Independent Agency, Exclusive/Captive Agent Independent Agency, Direct Response Broker, Direct Response Independent Agency, Other Direct
Top 10 Insurers Classified as Exclusive Captive DPW (Premiums) in Millions of Dollars
Louisiana Policy Issuing Insurers
State Farm Mutual Automobile Ins Co State Farm Fire and Casualty Company Allstate Property and Casualty Ins Co Allstate Insurance Company
Louisiana Farm Bureau Casualty Ins Co
Shelter Mutual Insurance Company ANPAC Louisiana Insurance Company Allstate Indemnity Company Liberty Insurance Underwriters, Inc Farmers Property and Casualty Ins Co
State Farm Group State Farm Group Allstate Insurance Group Allstate Insurance Group
Southern Farm Bureau Casualty Group Shelter Insurance Companies American National Prop & Cas Group Allstate Insurance Group Liberty Mutual Insurance Companies Farmers Insurance Group
2021 DPW 1,328 2 707 5
Listed Marketing Type Exclusive/Captive Agent Exclusive/Captive Agent Exclusive/Captive Agent Exclusive/Captive Agent Exclusive/Captive Agent Exclusive/Captive Agent Exclusive/Captive Agent Exclusive/Captive Agent Exclusive/Captive Agent, Direct Response Career Agent, Direct Response
Top 10 Insurers Classified as Direct DPW (Premiums) in Millions of Dollars
Louisiana Policy Issuing Insurers
GEICO Casualty Company
Progressive Paloverde Insurance Company
United Services Automobile Association
Louisiana Farm Bureau Mutual Ins Co
USAA General Indemnity Company
USAA Casualty Insurance Company
GEICO Secure Insurance Company
Liberty Personal Insurance Company
Liberty Mutual Fire Insurance Company
Garrison Property and Casualty Ins Co
Group
Berkshire Hathaway Insurance Group
Progressive Insurance Group USAA Group
USAA Group
USAA Group
Berkshire Hathaway Insurance Group
Liberty Mutual Insurance Companies
Liberty Mutual Insurance Companies USAA Group
2021 DPW
Listed Marketing Type Direct Response Direct Response Direct Response Direct Response Direct Response Direct Response Direct Response Direct Response Direct Response Direct Response
Top 10 Insurers Classified as Other DPW (Premiums) in Millions of Dollars
Louisiana Policy Issuing Insurers
Maison Insurance Company
Greenwich Insurance Company
Essent Guaranty, Inc.
Berkshire Hathaway Specialty Ins Co
OOIDA Risk Retention Group, Inc
Blackboard Insurance Company
National Mortgage Insurance Corporation
Endurance Assurance Corporation
Attorneys' Liab Assr Society Ltd , A RRG Vanliner Insurance Company
Group
FedNat Insurance Group
XL Reinsurance America Group
Essent Guaranty Group
Berkshire Hathaway Insurance Group
American International Group National Mortgage Insurance Group Sompo Holdings US Group
Great American P & C Ins Group
DPW
Listed Marketing Type Inactive Not Available Not Available Not Available Not Available Not Available Not Available Not Available Not Available General Agent, Other
Definition
Coverage
aircraft (hull)
liability to
their contents; aircraft owners’ and aircraft
and other third parties
Commercial Auto No Fault (Personal Injury Protection) Other Commercial Auto Passenger Liability (Include BI, PD, UM and UIM) Commercial Auto Physical Damage
Private Passenger Auto No Fault (Personal Injury Protection) Other Private Passenger Auto Liability (Include BI/PD/UM and UIM) Private Passenger Auto Physical Damage
Coverage for the failure of boilers, machinery and electrical equipment Benefits include: (i) property of the insured that has been directly damaged by the accident (ii) Costs of temporary repairs and expediting expenses (iii) Liability for damage to the property of others
Coverage for property taken or destroyed by breaking and entering the insured’s premises, burglary or theft, forgery or counterfeiting, fraud, kidnap and ransom, and off premises exposure
A contract for a commercial enterprise that packages two or more insurance coverages protecting an enterprise from various property and liability risk exposures Frequently includes fire, allied lines, various other coverages (e g , difference in conditions) and liability coverage (such coverages would be included in other annual statement lines, if written individually) Include multi peril policies (other than farmowners, homeowners and automobile policies) that include coverage for liability other than auto (Builders’ Risk Policies, Businessowners, Commercial Package Policies, Manufacturers Output Policies, e Commerce and Difference in Conditions)
Coverage purchased by consumers, manufacturers, merchants, educational institutions or other providers of goods and services extending credit, for indemnification of losses or damages resulting from the nonpayment of debts owed to/from them for goods or services provided in the normal course of their business Indemnification coverage provided to self insured employers on an excess of loss basis
A package policy for farming and ranching risks, similar to a homeowners policy, that has been adopted for farms and ranches and includes both property and liability coverages for personal and business losses Coverages include farm dwellings and their contents, barns, stables, other farm structures and farm inland marine, such as mobile equipment and livestock A commercial package policy for farming and ranching risks that includes both property and liability coverage Coverage includes barns, stables, other farm structures and farm inland marine, such as mobile equipment and livestock
A bond covering an employer’s loss resulting from an employee’s dishonest act (e g , loss of cash, securities, valuables, etc )
A surety bond, insurance policy, or when issued by an insurer, an indemnity contract and any guaranty similar to the foregoing types, under which loss is payable upon proof of occurrence of financial loss to an insured claimant, obligee or indemnitee as a result of failure to perform a financial obligation (see Financial Guaranty Insurance Guideline (#1626))
Fire, Allied Lines, Multi Peril Crop, Federal Flood, Private Crop, Private Flood and Earthquake (see further descriptions of each under Fire & Allied Lines)
A package policy combining broad property coverage for the personal property and/or structure with broad personal liability coverage Coverage applicable to the dwelling, appurtenant structures, unscheduled personal property and additional living expense are typical. Includes mobile homes at a fixed location. (Alternative Workers’ Compensation, Employers’ Liability and Standard Workers’ Compensation)
Coverage for property that may be in transit, held by a bailee, at a fixed location, a movable good that is often at different locations (e g , off road construction equipment) or scheduled property (e g , Homeowners Personal Property Floater), including items such as live animals, property with antique or collector’s value, etc This line also includes instrumentalities of transportation and communication, such as bridges, tunnels, piers, wharves, docks, pipelines, power and phone lines, and radio and television towers (Animal Mortality, EDP Policies, Pet Insurance Plans, Communication Equipment, Event Cancellation, Travel Coverage, Vehicle Excess Waiver, Boatowners, Other Commercial Inland Marine, Other Personal Marine and Cash and Cash in Transit Insurance)
Marine
Other Liability (Claims made)
Other Liability (Occurrence)
Products Liability
Surety Warranty
Workers Compensation
Line 29 Line 11 Line 6 Line 8 Line 17 2 Line 17 1 Line 18 Line 24 Line 30 Line 16
Includes all business transacted outside the U S and its territories and possessions where the appropriate line of business is not determinable
Insurance coverage protecting a licensed health care provider or health care facility against legal liability resulting from the death or injury of any person due to the insured’s misconduct, negligence, or incompetence in rendering professional services Medical Professional Liability is also known as Medical Malpractice
Insurance that indemnifies a lender from loss if a borrower fails to meet required mortgage payments
Coverage for ocean and inland water transportation exposures; goods or cargoes; ships or hulls; earnings; and liability
Same as 17 1 but on a Claims Made Basis These policies cover insured events that are reported (as defined in the policy) within the effective dates of the policy, subject to retroactive dates and extended reporting periods when applicable
Occurrence Based: These policies cover insured events that occur within the effective dates of the policy, regardless of when they are reported to the reporting entity Insurance coverage protecting the insured against legal liability resulting from negligence, carelessness or a failure to act, causing property damage or personal injury to others Typically, coverages include construction and alteration liability; contingent liability; contractual liability; elevators and escalators liability; errors and omissions liability, environmental pollution liability; excess stop loss, excess over insured or self insured amounts and umbrella liability; liquor liability; personal injury liability; premises and operations liability; completed operations liability, nonmedical professional liability, etc Also includes indemnification coverage provided to self insured employers on an excess of loss basis (excess workers’ compensation) (Completed Operations, Construction Liability, Contingent Liability, Contractual Liability, Elevators, Error and Omissions, Environmental Pollution, Excess and Umbrella, Personal Liability, Premises and Operations, Excess Workers’ Compensation, Commercial General Liability, Comprehensive Personal Liability, Day Care Centers, Directors and Officers, Employee Benefit Liability, Employers’ Liability, Employment Practices, Fire Legal, Municipal Liability, Nuclear Energy, Veterinarian, Internet Liability and Cyber Liability) Excludes excess workers’ compensation
Insurance coverage protecting the manufacturer, distributor, seller or lessor of a product against legal liability resulting from a defective condition causing personal injury, or damage, to any individual or entity, associated with the use of the product
A three party agreement where the insurer agrees to pay a second party (the obligee) or make complete an obligation in response to the default, acts or omissions of a third party (the principal)
Coverage that protects against manufacturer’s defects past the normal warranty period and for repair after breakdown to return a product to its originally intended use Warranty insurance generally protects consumers from financial loss caused by the seller’s failure to rectify or compensate for defective or incomplete work and cost of parts and labor necessary to restore a product’s usefulness Includes, but is not limited to, coverage for all obligations and liabilities incurred by a service contract provider, mechanical breakdown insurance and service contracts written by insurers (Mechanical Breakdown and Service Contracts)
Insurance that covers an employer’s liability for injuries, disability or death to persons in their employment, without regard to fault, as prescribed by state or Federal workers’ compensation laws and other statutes Includes employer’s liability coverage against the common law liability for injuries to employees (as distinguished from the liability imposed by Workers’ Compensation Laws) Excludes excess workers’ compensation
Coverage protecting the insured against the loss to real or personal property from damage caused by the peril of fire or lightning, including business interruption, loss of rents, etc
Extended coverage; glass; tornado, windstorm and hail; sprinkler and water damage; explosion, riot and civil commotion; rain; and damage from aircraft and vehicle
Insurance protection that is subsidized or reinsured by the Federal Crop Insurance Corporation for protection against losses due to damage, decreases in revenues and/or gross margins from crop, livestock and other agricultural related production from unfavorable weather conditions, drought, wind, frost, fire or lightning, flood, hail, insect infestation, disease or other yield reducing conditions or perils
Coverage provided by the Federal Insurance Administration (FIA) of the Federal Emergency Management Agency (FEMA) through insurers participating in the National Flood Insurance Program’s (NFIP) Write Your Own (WYO) program Coverage is subject to the terms and conditions provided in the Financial Assistance/Subsidy Arrangement between the reporting entity and the FIA
Private market coverage for crop insurance and agricultural related protection, such as hail and fire, and is not reinsured by the Federal Crop Ins
Private market coverage (primary standalone, first dollar policies that cover the flood peril and excess flood) for flood insurance that is not offered through the National Flood Insurance Program (Sewer/water backup coverage issued as an endorsement homeowners or commercial policy )
Property coverages for losses resulting from a sudden trembling or shaking of the earth, including that caused by volcanic eruption. Excluded are losses resulting from fire, explosion, flood or tidal wave following the covered event.
Below is an image of a sample Top Line of Business detail page. It is provided with notations (A I) to assist in understanding the components of the product details provided for each Line of Business.
2021 Louisiana P C Marketplace Summary
provided the reader with both visual and numeric presentations of the Louisiana P C marketplace data, as a benefit of your membership with the Independent Insurance Agents & Brokers of Louisiana All questions and comments, or need for further analysis, are welcomed at the contact information