
Harris County 2025:
Texas Congressional District 18
July 2025
The Hobby School of Public Affairs at the University of Houston conducted a survey of Harris County registered voters to assess their preferences and opinions about a wide range of salient local issues andpublicofficials.Thesurvey wasfieldedbetween July9and July18,2025 bycontac ngHarrisCounty registered voters via SMS text messages through which they were directed to an online survey pla orm with the op on to answer the survey in English or Spanish. Representative of the Harris County population of registered voters, the analysis population of 2,300 has a margin of error of +/- 2.04%. Within this overall Harris County survey population, representative samples also were collected for Harris County’s four county commissioner precincts, with analysis populations of 550 for Precincts 2, 3, and 4 (margin of error of +/-4.18%) and of 650 for Precinct 1 (+/- 3.84%).
This report also utilizes a unique survey population drawn from this larger survey project (and augmented by additional targeted sampling of likely voters) to analyze the candidate evaluations and vote intention of Harris County registered voters who are likely to vote in the November 2025 Texas Congressional District 18 (TX-18) special election. The size of the analysis population of TX-18 likely voters is 400, with a margin of error of +/- 4.90%.
The overall study includes three reports in addition to this report on the TX-18 special election. The first report examines Harris County registered voters’ opinions on the direction in which the county is headed, the most important problems facing Harris County, the impact of factors on the quality of life in their neighborhood, the job performance of county elected officials, and on potential candidates for the position of Harris County Judge. The second report gauges the level of enthusiasm among Harris County registered voters for a destination theme park and for a motor speedway being built in Harris County and for Houston obtaining a Women’s National Basketball Association (WNBA) team and a National Hockey League (NHL) team as well as their level of support for using public funds to renovate NRG Stadium and the Astrodome. The third and final report assesses Harris County registered voters’ concerns about the potential impact of severe summer weather as well as their evaluation of CenterPoint’s efforts to harden the region’s electrical grid over the past year.
EXECUTIVE SUMMARY
Approximately 100 days before the November 4, 2025 Texas Congressional District 18 special election, four candidates are effectively deadlocked in their respective bids to obtain one of the two positions in an all but certain runoff election that will be held in either January or February of 2026.
Democrats Christian Menefee and Amanda Edwards are tied with a vote intention of 19%, enjoying a modest advantage over Republican Carmen Maria Montiel and Democrat Jolanda Jones who are tied at 14%. The field of the six most visible candidates who were included on this test ballot is rounded out by George Foreman IV, who is running under the Independence Party label, with 4%, and Democrat
Isaiah Martin with a vote intention of 3%. More than one in four (27%) of these likely voters remain undecided about for whom they will vote in the TX-18 special election.
SURVEY POPULATION DEMOGRAPHICS OF CONGRESSIONAL DISTRICT 18 (TX-18) LIKELY VOTERS
Black likely voters account for 42% of this survey population, White likely voters for 38%, Latino likely voters for 16%, and others for 4%. Women represent 56% of this population and men 44%. More than three-fifths (62%) of this population of likely voters is age 55 or older, while 27% is between the ages of 35 and 54, and 11% is between the ages of 18 and 34. A little more than two-thirds (68%) of these likely voters have a four-year college degree while slightly less than one-third (32%) do not. Democrats account for 62% of this population of likely voters, Republicans for 21% and Independents for 14%, with 3% either unsure of their partisan identification or identifying with another party or group.
FAVORABLE AND UNFAVORABLE EVALUATIONS OF SIX TX-18 CANDIDATES
As of July 9, when the fielding of the survey began and as of the wri ng of this report on July 27, 23 people had filed statements of candidacy in TX-18 with the U.S. Federal Elec on Commission (16 using the Democra c Party label, 3 using the Republican Party label, 2 as Independents, 1 using the Independence Party label, and 1 using the label of Other).
The names of the six most visible candidates at the me of the fielding of the survey, which were presented to the likely voters to be evaluated, included the following: Amanda Edwards (Democra c Party), George Foreman IV (Independence Party), Jolanda Jones (Democra c Party), Isaiah Mar n (Democra c Party), Chris an Menefee (Democra c Party), and Carmen Maria Mon el (Republican Party). The par san labels of the candidates were not included in the ini al survey ques on in which likely voters were asked if they had a favorable or unfavorable opinion of the candidate but were included in the subsequent vote inten on ques on.
The TX-18 likely voters were asked if they had a favorable or unfavorable opinion of each of these six TX-18 candidates, or, if they did not know enough about the candidate to have an opinion. Table 1 reveals that the propor on of TX-18 likely voters with a favorable opinion of these candidates ranges from highs of 43% (Edwards), 40% (Menefee) and 38% (Jones) to lows of 22% (Foreman), 16% (Mar n) and 11% (Mon el). The propor on of likely voters with an unfavorable opinion of these candidates rangesfrom ahighof27%(Jones)toa setoflowsclusteredinanarrowbandof between10%(Menefee) and 13% (Edwards), with Foreman (11%), Mon el (11%) and Mar n (12%) in between. The propor on of TX-18 likely voters who do not know enough about the candidates to have an opinion of them ranges from highs of 78% (Mon el), 72% (Mar n) and 67% (Foreman) to lows of 50% (Menefee), 44% (Edwards) and 35% (Jones). Of note, even the best-known candidate (Jones) is unknown to more than a third of TX-18 likely voters.
Table1:Favorable&UnfavorableEvaluationsofTX-18SpecialElectionCandidates(%)
Figure 1 provides the net-favorability ra ng (percentage favorable minus percentage unfavorable) for each one of these six TX-18 candidates. Edwards (30%) and Menefee (30%) have the highest netfavorability ra ngs while Mar n (4%) and Mon el (0%) have the lowest net-favorability ra ngs, with Jones (11%) and Foreman (11%) in between.
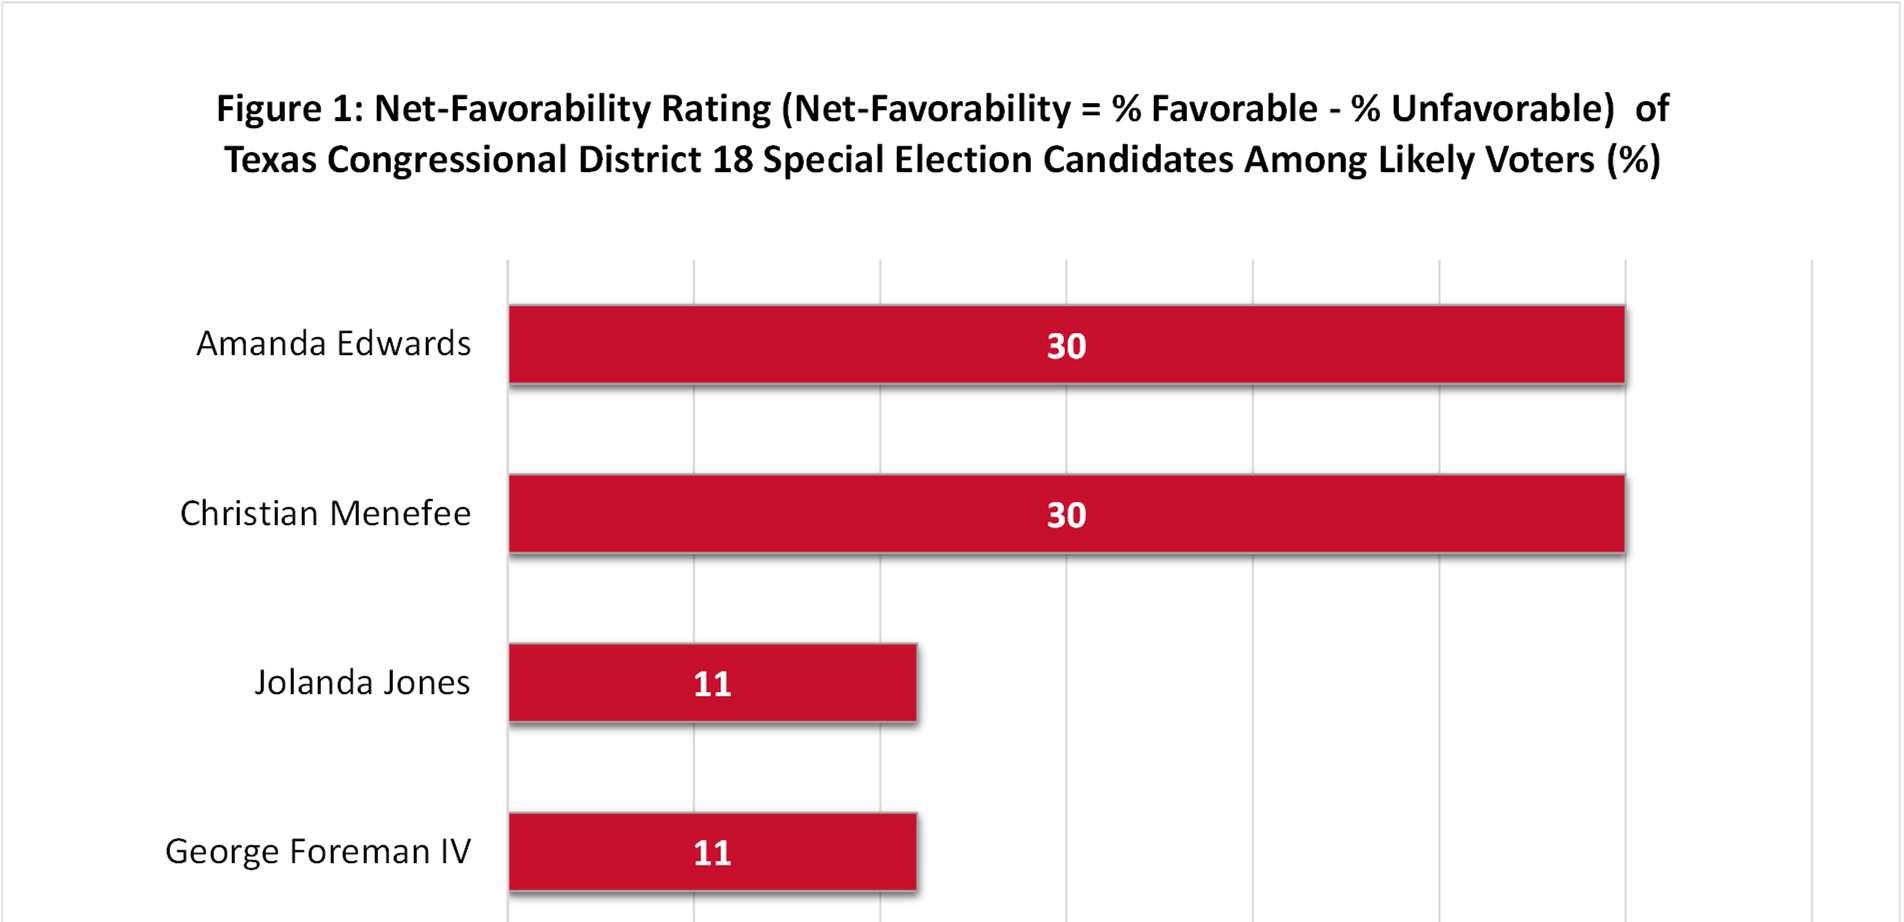
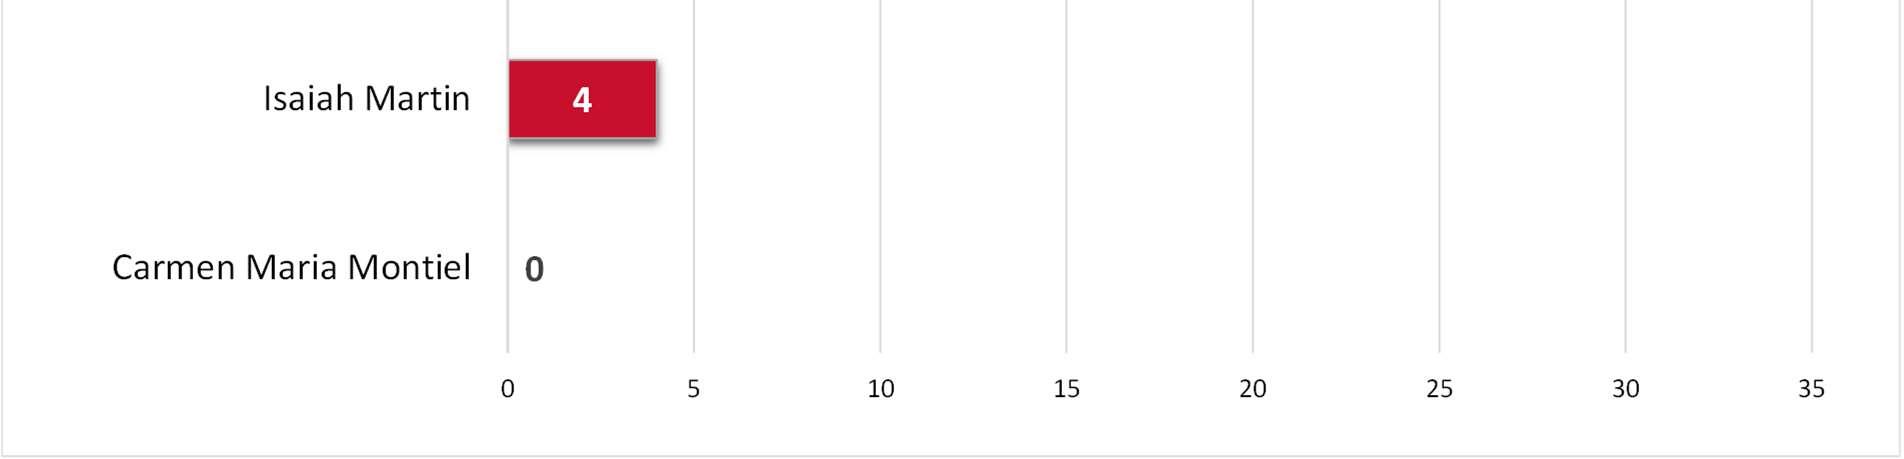
Figure 2 provides the vote inten on of likely voters in the November 2025 Texas Congressional District 18 special elec on. The likely voters were given the op on of cas ng a ballot for one of the six highest profile candidates (Edwards, Foreman, Jones, Mar n, Menefee, Mon el) or of responding that they were unsure of how they would vote if the elec on were held today.
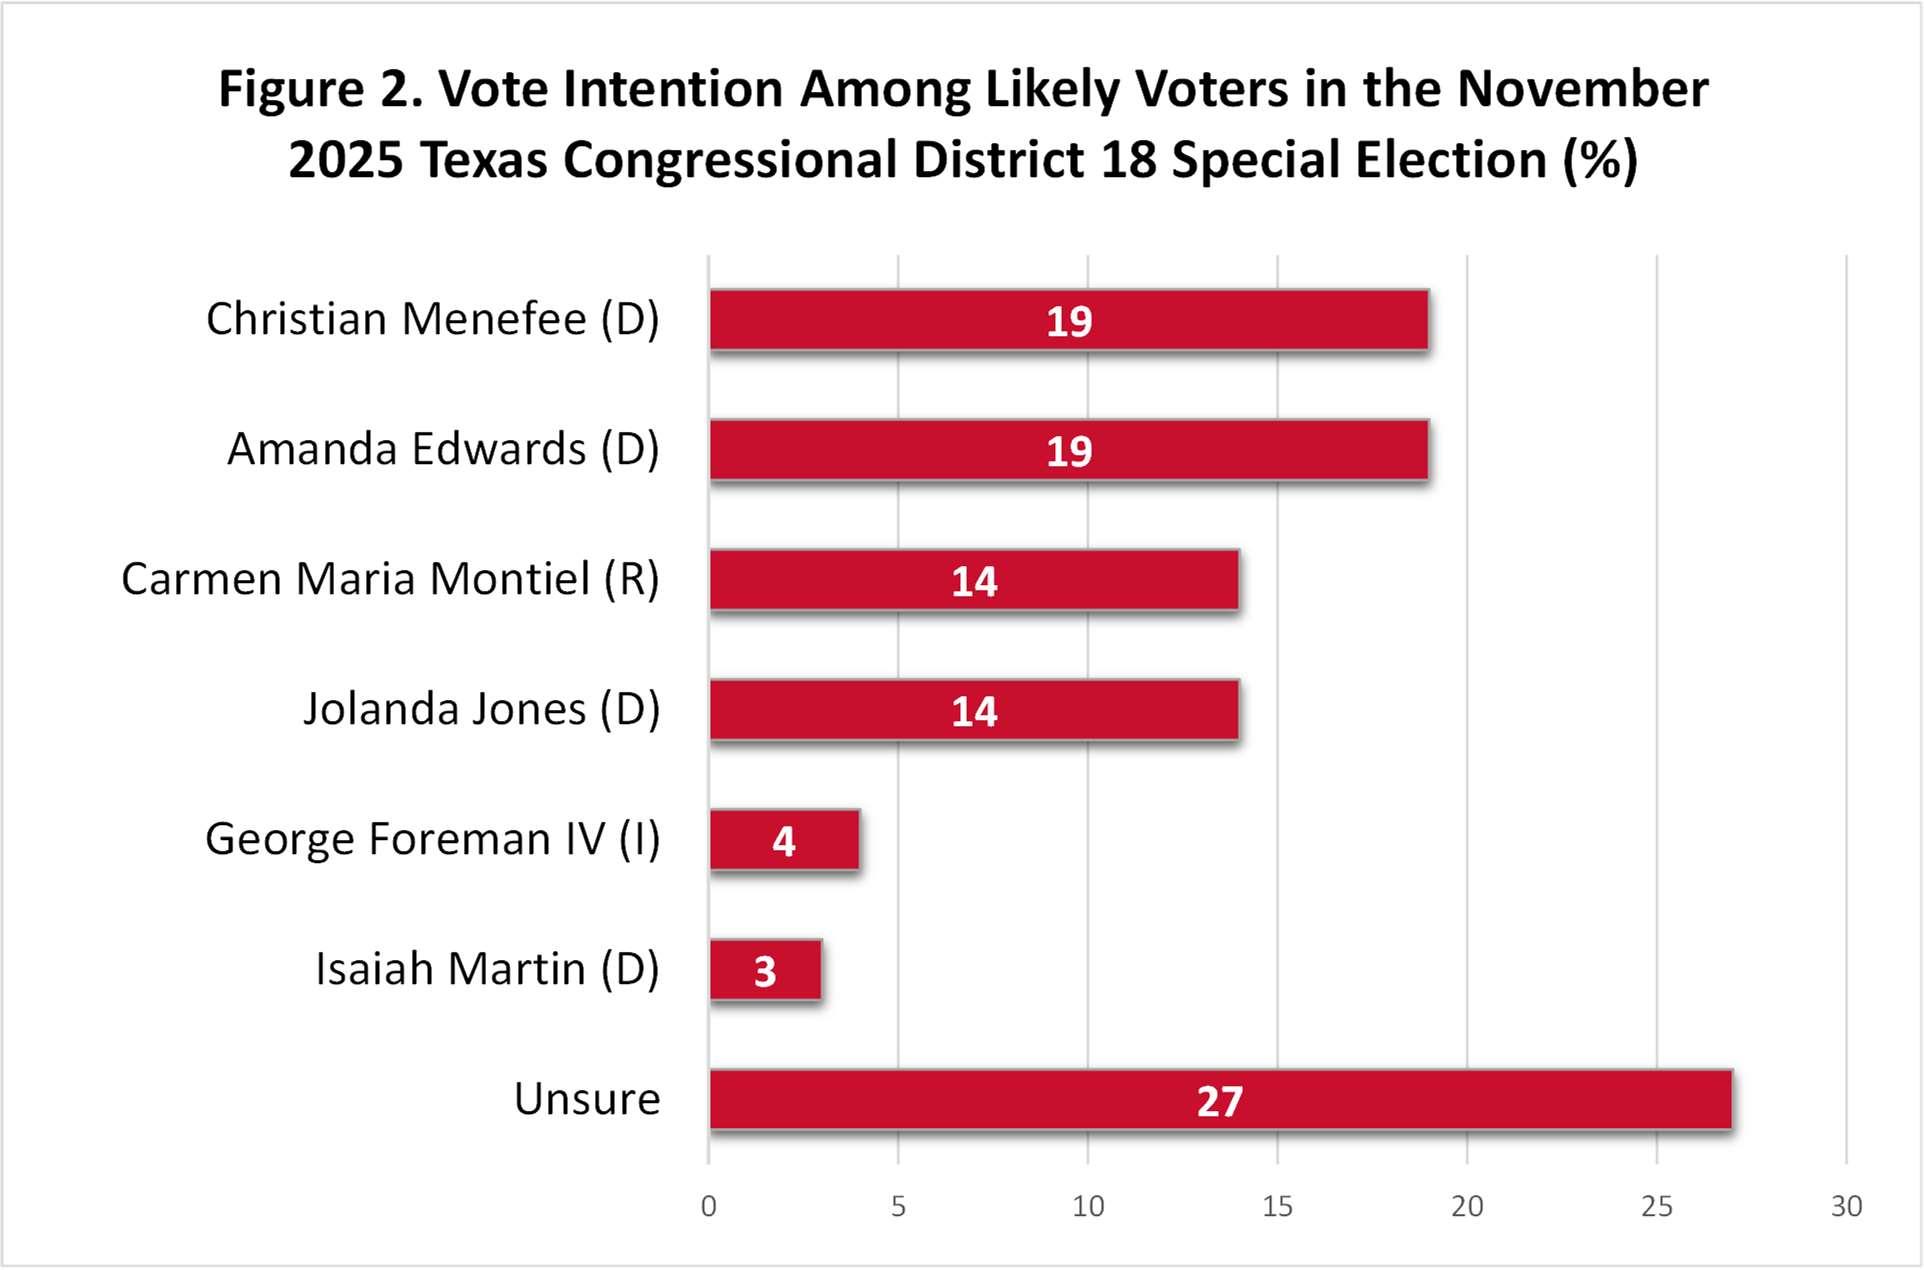
The two candidates with the highest vote inten on are Democrats Chris an Menefee (19%) and Amanda Edwards (19%), followed closely by Republican Carmen Maria Mon el (14%) and Democrat Jolanda Jones (14%). They are followed by George Foreman IV (4%), who is running under the Independence Party banner, and Democrat Isaiah Mar n (3%). A li le more than three months prior to elec on day, more than one in four likely voters (27%) remain unsure about for whom they would vote in this contest.
Among the 27% of likely voters who are undecided, an overwhelming majority report that they don’t know enough about the six candidates to have an opinion about them. More than three out of four of these undecided voters don’t know enough about Edwards (76%), Foreman (80%), Menefee (80%), Mon el (86%) and Mar n (87%) to have an opinion about them, and even the best-known candidate among these undecided likely voters, Jones, is unknown to almost two-thirds of them (65%). Among these undecided likely voters with an opinion of the candidate, Jones is viewed favorably by 21% and unfavorably by 14%, Edwards is viewed favorably by 17% and unfavorably by 7%, Menefee is viewed favorably by 15% and unfavorably by 5%, Foreman is viewed favorably by 13% and unfavorably by 7%, Mar n is viewed favorably by 8% and unfavorably by 5%, and Mon el is viewed favorably by 4% and unfavorably by 10%.
Table 2 provides the vote inten on for the four candidates with the highest vote inten on (Menefee, Edwards, Mon el, Jones) along with that for Foreman and Mar n combined (Others) and the propor on who are unsure about their vote inten on, broken down by gender, ethnicity/race, age, educa on, and par sanship
Table2:VoteIntentionintheTexasCongressionalDistrict18SpecialElection,bySub-Group(%)
Socio-DemographicSub-Group
Gender
Ethnicity/Race
Age
Education
Partisanship
The vote inten on for the four leading candidates among women likely voters ranges from a high of 22% (Edwards) to a low of 9% (Mon el). The vote inten on among men ranges from a high of 21% (Menefee and Mon el) to a low of 12% (Jones).
The vote inten on of Black likely voters is split rela vely evenly among Menefee (24%), Edwards (21%) and Jones (21%), with Mon el (5%) receiving only minimal support from Black voters. The vote inten on of White likely voters is split rela vely evenly among Mon el (21%), Menefee (19%) and Edwards (18%), with Jones (7%) receiving only minimal support from White voters.
While there are not any noteworthy differences in vote inten on for the six candidates based on age, likely voters under the age of 35 are much more likely to be undecided at the present me than are their elders, with 61% of the youngest likely voters unsure about their vote inten on compared to 27% of those between the ages of 35 and 54 and 22% of those age 55 and older.
The vote inten on for the four leading candidates among likely voters with a four-year college degree ranges from a high of 24% (Menefee) to a low of 10% (Jones), with these posi ons reversed among those likely voters who do not have a four-year college degree, 9% vs. 20%, respec vely.
The vote inten on of Democra c likely voters is split rela vely evenly among Menefee (24%), Edwards (24%) and Jones (21%), while 0% of Democra c likely voters intend to vote for Mon el. The vote inten on of Republican likely voters is overwhelmingly (62%) for Mon el, the only Republican listed on the test ballot. A er Mon el, the candidate with the highest vote inten on among Republicans is Foreman (8%), with more than one-in-five (21%) Republicans undecided.
More than half (56%) of the Republicans who responded that they intend to vote for Mon el also reported that they do not know enough about her to have either a favorable or unfavorable opinion. Her vote inten on at the present me should therefore be interpreted as being based at least in part on her par san label (Republican) and status as the only Republican on the test ballot, sugges ng that her vote inten on could both go down (to the extent to which other Republicans are on the November 2025 ballot) or go up (if adver sing and other outreach result in a lion’s share of GOP voters perceiving her as the only or most legi mate and viable Republican candidate).
CO-INVESTIGATORS & REPORT AUTHORS
Renée Cross, Senior Executive Director & Researcher, Hobby School of Public Affairs
Mark P. Jones, James A. Baker III Institute for Public Policy's Fellow in Political Science, Rice University; Senior Research Fellow, Hobby School of Public Affairs
RESEARCH TEAM
Maria P. Perez Argüelles, Research Associate, Hobby School of Public Affairs
Savannah Sipole, Research Associate, Hobby School of Public Affairs
COMMUNICATIONS TEAM
Diana Benitez, Program Director, Web & Graphic Design, Hobby School of Public Affairs
Victoria Cordova, Executive Director of Communications, Hobby School of Public Affairs
Jeannie Kever, Communications Consultant
Celeste Zamora, Communications Manager, Hobby School of Public Affairs
RECOMMENDED CITATION
University of Houston Hobby School of Public Affairs, July 2025, “Harris County 2025: Texas Congressional District 18”