Market Report


Q1-2023
GREENWICH
Home buyers in Greenwich, Connecticut remain hungry for new inventory and continue to joust with each other over well-priced, beautiful homes. Despite higher mortgage rates, this ongoing supply constraint has extended a bullish window of opportunity for home sellers. While the inventory of homes for sale here has increased 15% this year, we remain more than 60% below pre-pandemic levels.
Sales of single-family homes declined 40% in the first quarter, back to levels not seen since 2019. However, average prices rose modestly, and “days on market” contracted, suggesting the pool of interested buyers here remains robust and ready to pounce when opportunity knocks. Many sellers have found success by strategically pricing their homes to attract the attention of multiple buyers, which can yield bidding wars with favorable terms to choose from.
In the pages that follow, you’ll see how the markets in our enchanting sub-markets fared in the quarter. The coastal neighborhood of Riverside experienced the fastest selling times at just 47 days on market, and homes there closed, on average, at more than 3% over the asking price. Conversely, homes that sold at the greatest discount to the asking price were in Greenwich’s North of the Parkway area at 5% below ask.
As temperatures warm in Greenwich, we begin to turn our attention to life outdoors and the many events and amenities that make living here so special. Our town-operated golf, tennis, pickleball, and beach and boating operations all begin to ramp up. And we’ll gather once again over Memorial Day weekend at the annual Greenwich Town Party for a music-filled day celebrating our wonderful community. We hope to see you there.
With Warm Regards,
Liz Nunan President and CEO
GREENWICH, CT · $15,900,000
Luxuriate in resort-style living off Round Hill Road. Fabulous indoor and outdoor entertaining space characterizes this magnificent Mid-Country compound set back on 4.75 gated acres with pool, pool house, tennis court, two-bedroom guest house and spacious party barn featuring: a catering kitchen, multiple game rooms, lounge with stone fireplace and bar. Maria Kelce Crowley | M 203.536.5534
203.869.0700 · 203.698.1234 · HOULIHANLAWRENCE.COM @AROUNDGREENWICH @AROUNDGREENWICH /GREENWICHCTREALESTATE
Q1-2023
MARKET REPORT
Source: 1/1/23 – 3/31/23, total sales both on and off MLS.
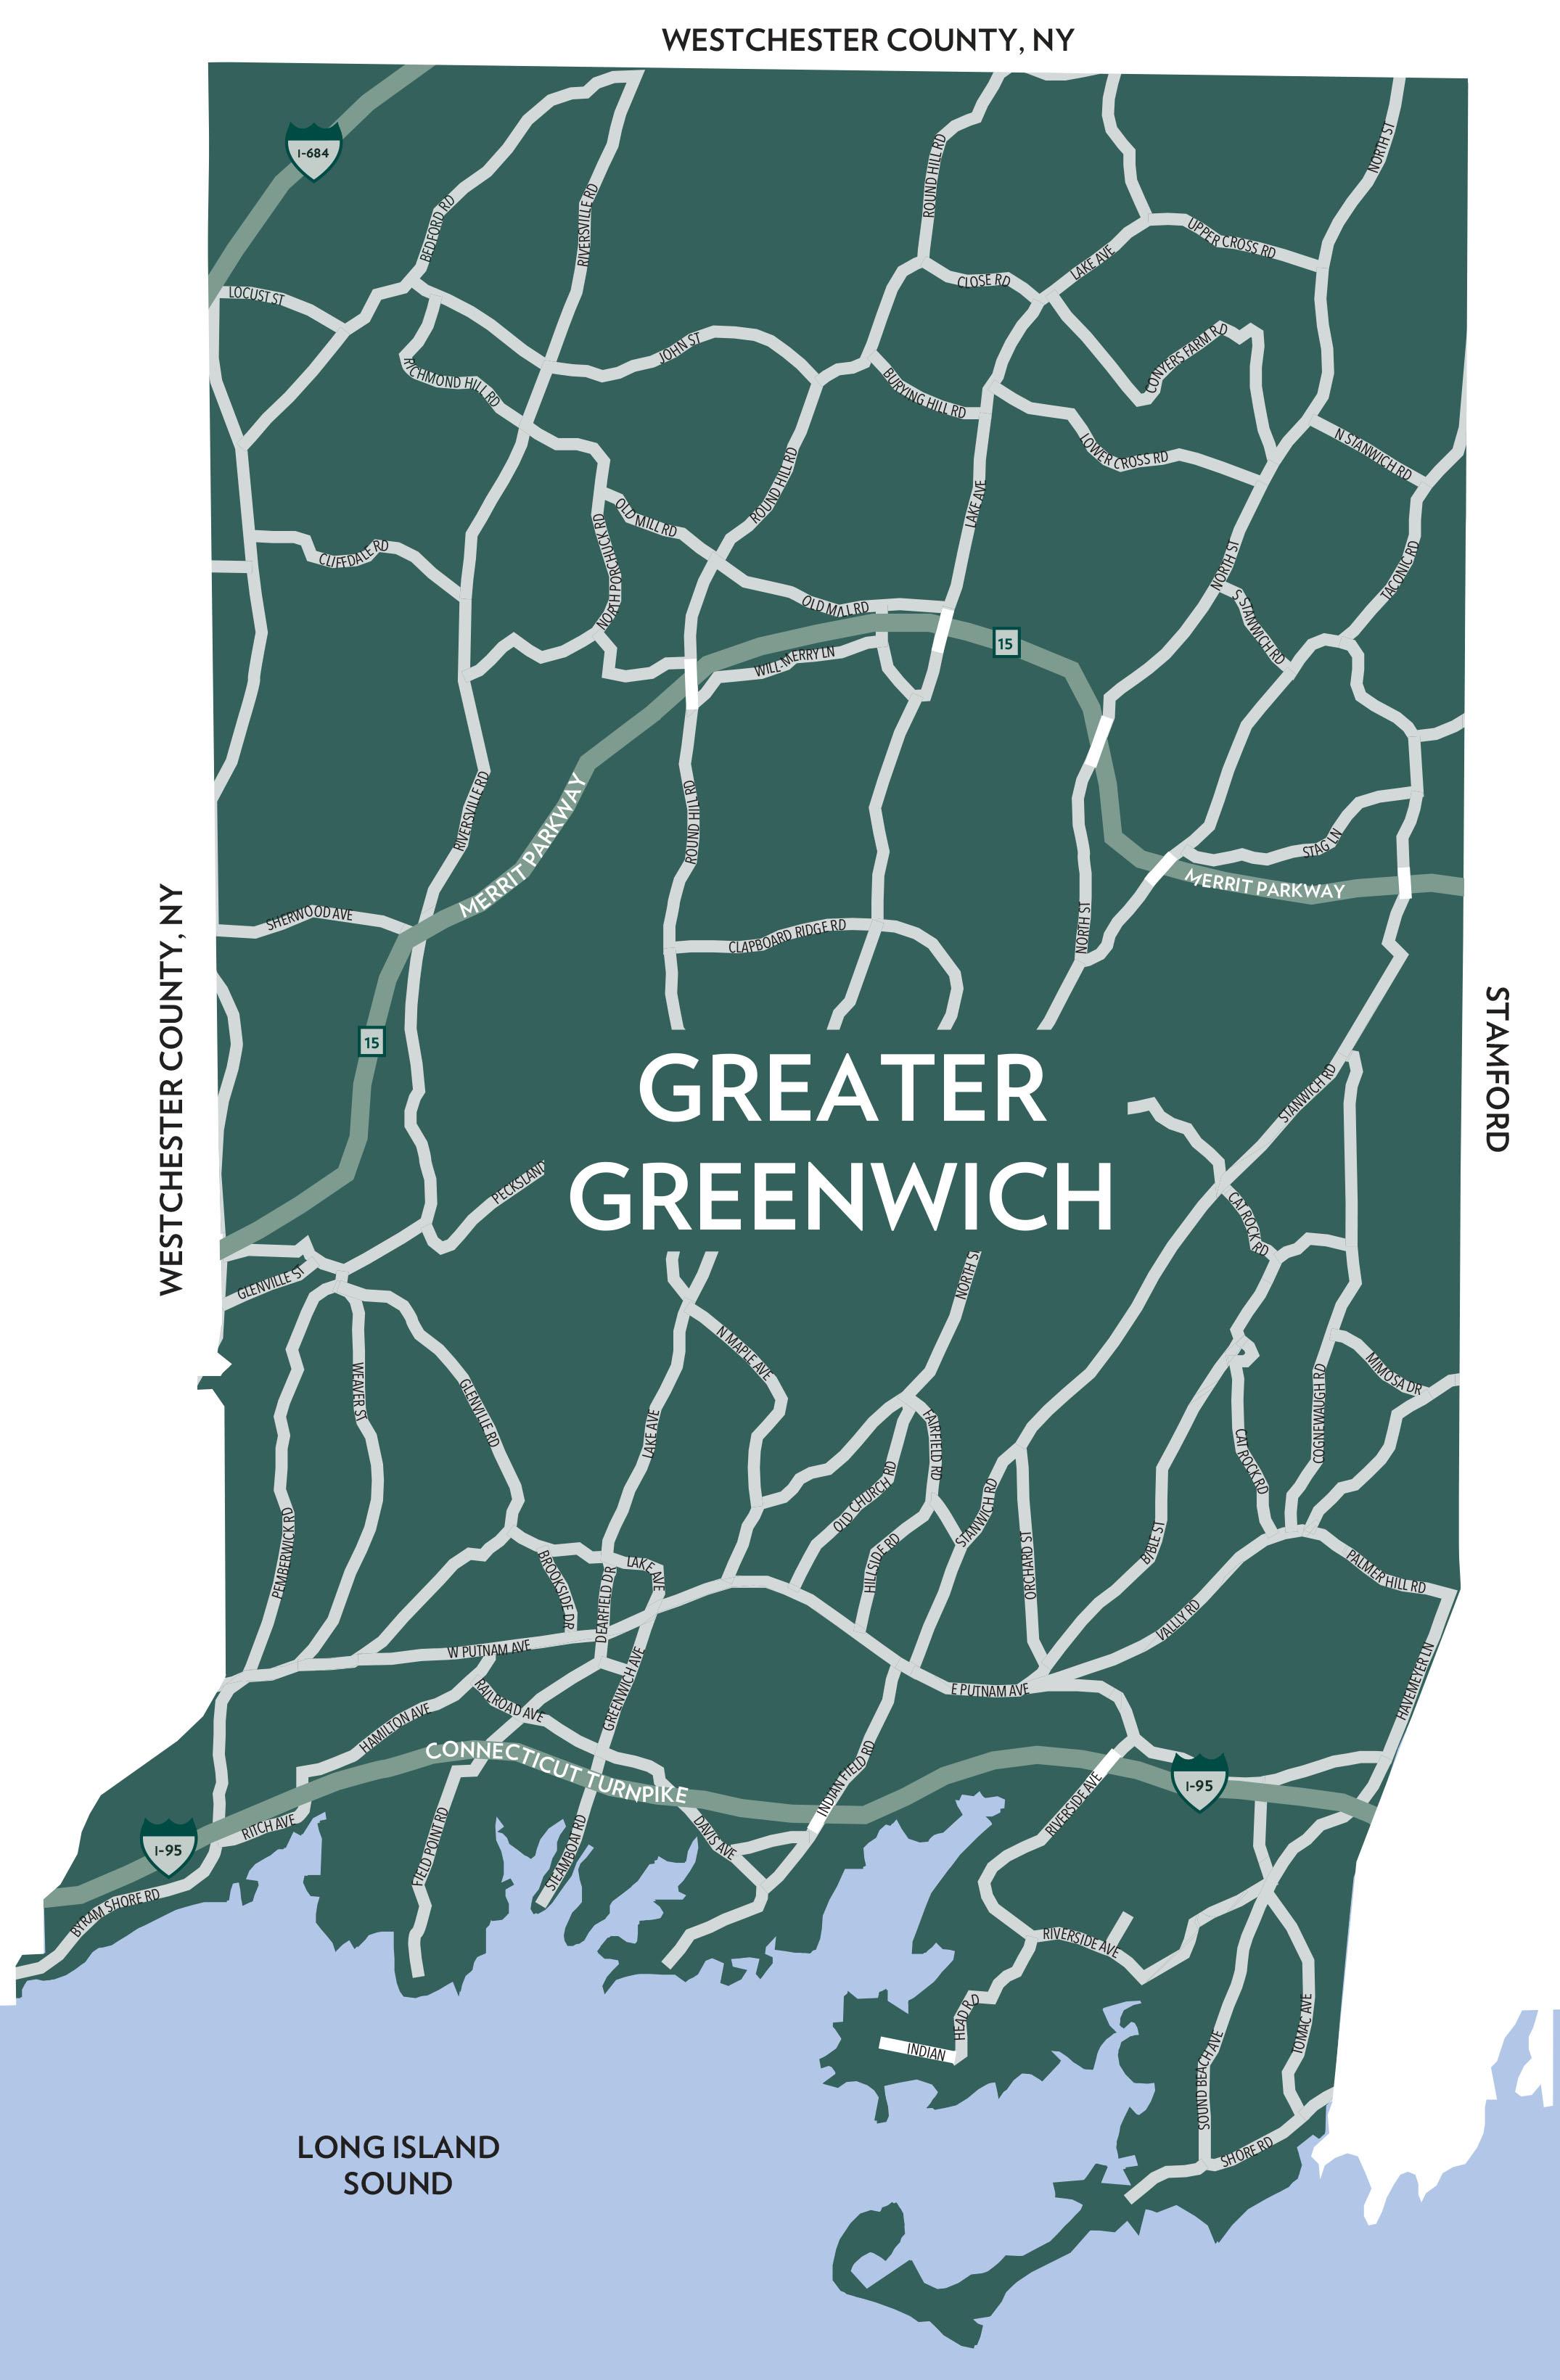
TABLE OF CONTENTS FIRST QUARTER 2023
GREENWICH SingleFamilyHomeOverview GREENWICH NorthoftheParkway GREENWICH SouthoftheParkway GREENWICH SouthofthePostRoad COS COB RIVERSIDE
GREENWICH GREATER GREENWICH CondominiumOverview HOULIHANLAWRENCE.COM
GREATER
OLD
QUARTERLY MARKET OVERVIEW
TEN-YEAR MARKET HISTORY
* Homes sold for 2023 are annualized based on actual sales year-to-date.
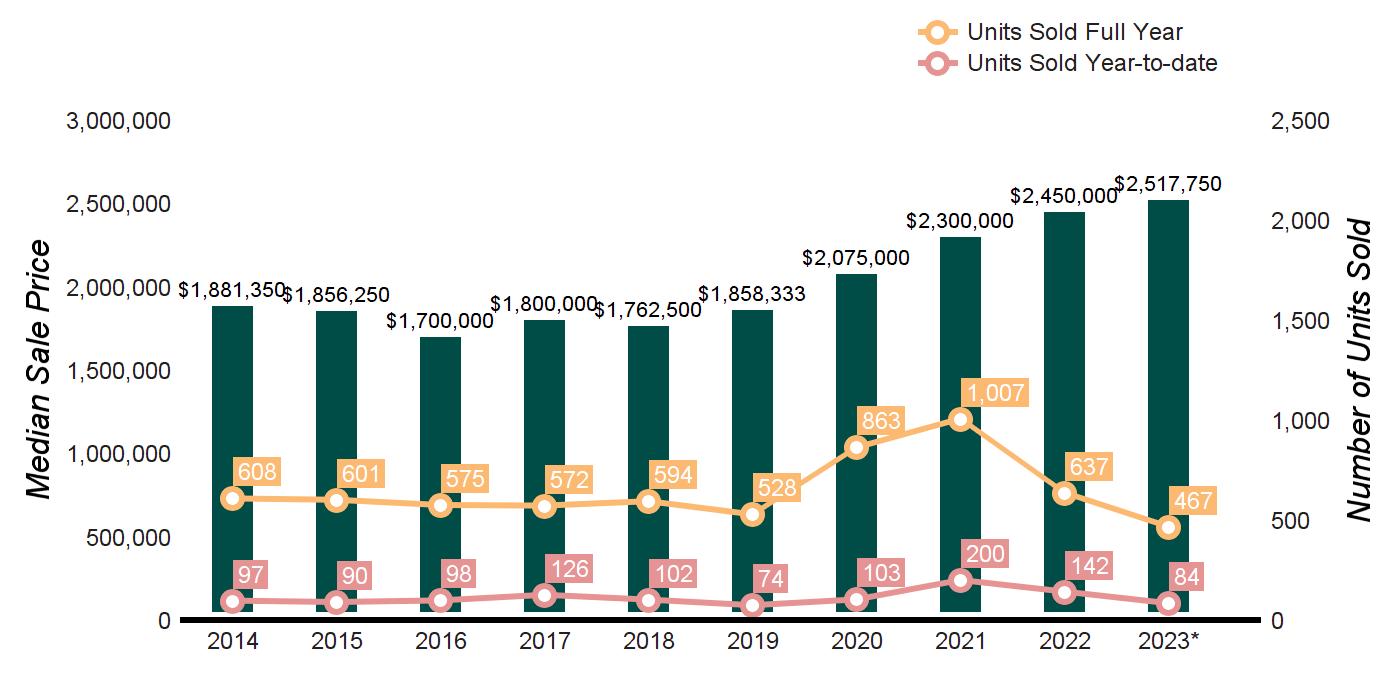
GREATER GREENWICH
Q1 2023 Q1 2022 % CHANGE FULL YEAR 2022 FULL YEAR 2021 % CHANGE HOMES SOLD 84 142 -40.8% 637 1007 -36.7% AVERAGE SALE PRICE $3,128,138 $3,023,819 3.4% $3,050,065 $3,005,642 1.5% MEDIAN SALE PRICE $2,517,750 $2,525,000 -0.3% $2,450,000 $2,300,000 6.5% AVERAGE PRICE PER SQUARE FOOT $670 $640 4.7% $696 $635 9.6% AVERAGE DAYS ON MARKET 88 118 -25.4% 76 109 -30.3% % SALE PRICE TO LIST PRICE 97.1% 97.5% -0.4% 99.7% 97.4% 2.4%
Average Sale Price $2,688,907 $2,421,486 $2,203,756 $2,574,993 $2,393,006 $2,376,330 $2,667,708 $3,005,642 $3,050,065 $3,128,138 Average Sale Price Average Price/SqFt $611 $592 $564 $578 $563 $545 $557 $635 $696 $670 Average Price/SqFt Days On Market 155 161 157 183 179 199 171 109 76 88 Days On Market %Sale Price to List Price 93.7 94.4 94.1 92.5 93.7 92.4 94.4 97.4 99.7 97.1 %Sale Price to List Price
SUPPLY DEMAND ANALYSIS
SOLD PROPERTIES
GREATER GREENWICH
AS OF MARCH 31, 2023 AS OF MARCH 31, 2022 2023 vs. 2022 PRICE RANGE SUPPLY: ACTIVE LISTINGS DEMAND: PENDING SALES SUPPLY/ DEMAND RATIO* SUPPLY: ACTIVE LISTINGS DEMAND: PENDING SALES SUPPLY/ DEMAND RATIO* % CHANGE IN LISTINGS % CHANGE IN PENDINGS $0 - $999,999 8 5 2 6 15 1 33.3% -66.7% $1,000,000 - $1,999,999 26 18 1 19 34 1 36.8% -47.1% $2,000,000 - $2,999,999 24 18 1 25 24 1 -4.0% -25.0% $3,000,000 - $3,999,999 22 14 2 17 21 1 29.4% -33.3% $4,000,000 - $4,999,999 20 12 2 17 14 1 17.6% -14.3% $5,000,000 - $5,999,999 19 4 5 13 7 2 46.2% -42.9% $6,000,000 - $7,999,999 10 10 1 23 11 2 -56.5% -9.1% $8,000,000 - $9,999,999 2 4 1 6 1 6 -66.7% 300.0% $10,000,000 and up 24 4 6 19 3 6 26.3% 33.3% MarketTotals 155 89 2 145 130 1 6.9% -31.5% *Supply Demand Ratio Key 1-4: High Demand 5-6: Balanced 7-9: Low Demand 10+: Very Low Demand
YEAR-TO-DATE YEAR-OVER-YEAR 01/01/202303/31/2023 01/01/202203/31/2022 % CHANGE 2023/2022 04/01/202203/31/2023 04/01/202103/31/2022 % CHANGE 2023/2022 $0 - $999,999 10 16 -37.5% 56 101 -44.6% $1,000,000 - $1,999,999 22 42 -47.6% 163 269 -39.4% $2,000,000 - $2,999,999 18 27 -33.3% 140 234 -40.2% $3,000,000 - $3,999,999 9 21 -57.1% 69 139 -50.4% $4,000,000 - $4,999,999 9 18 -50.0% 54 78 -30.8% $5,000,000 - $5,999,999 9 6 50.0% 45 41 9.8% $6,000,000 - $7,999,999 3 4 -25.0% 34 53 -35.8% $8,000,000 - $9,999,999 3 6 -50.0% 10 21 -52.4% $10,000,000 and up 1 2 -50.0% 8 13 -38.5% MarketTotals 84 142 -40.8% 579 949 -39.0%
Source: Greenwich Multiple Listing Service, Single-family homes
QUARTERLY MARKET OVERVIEW
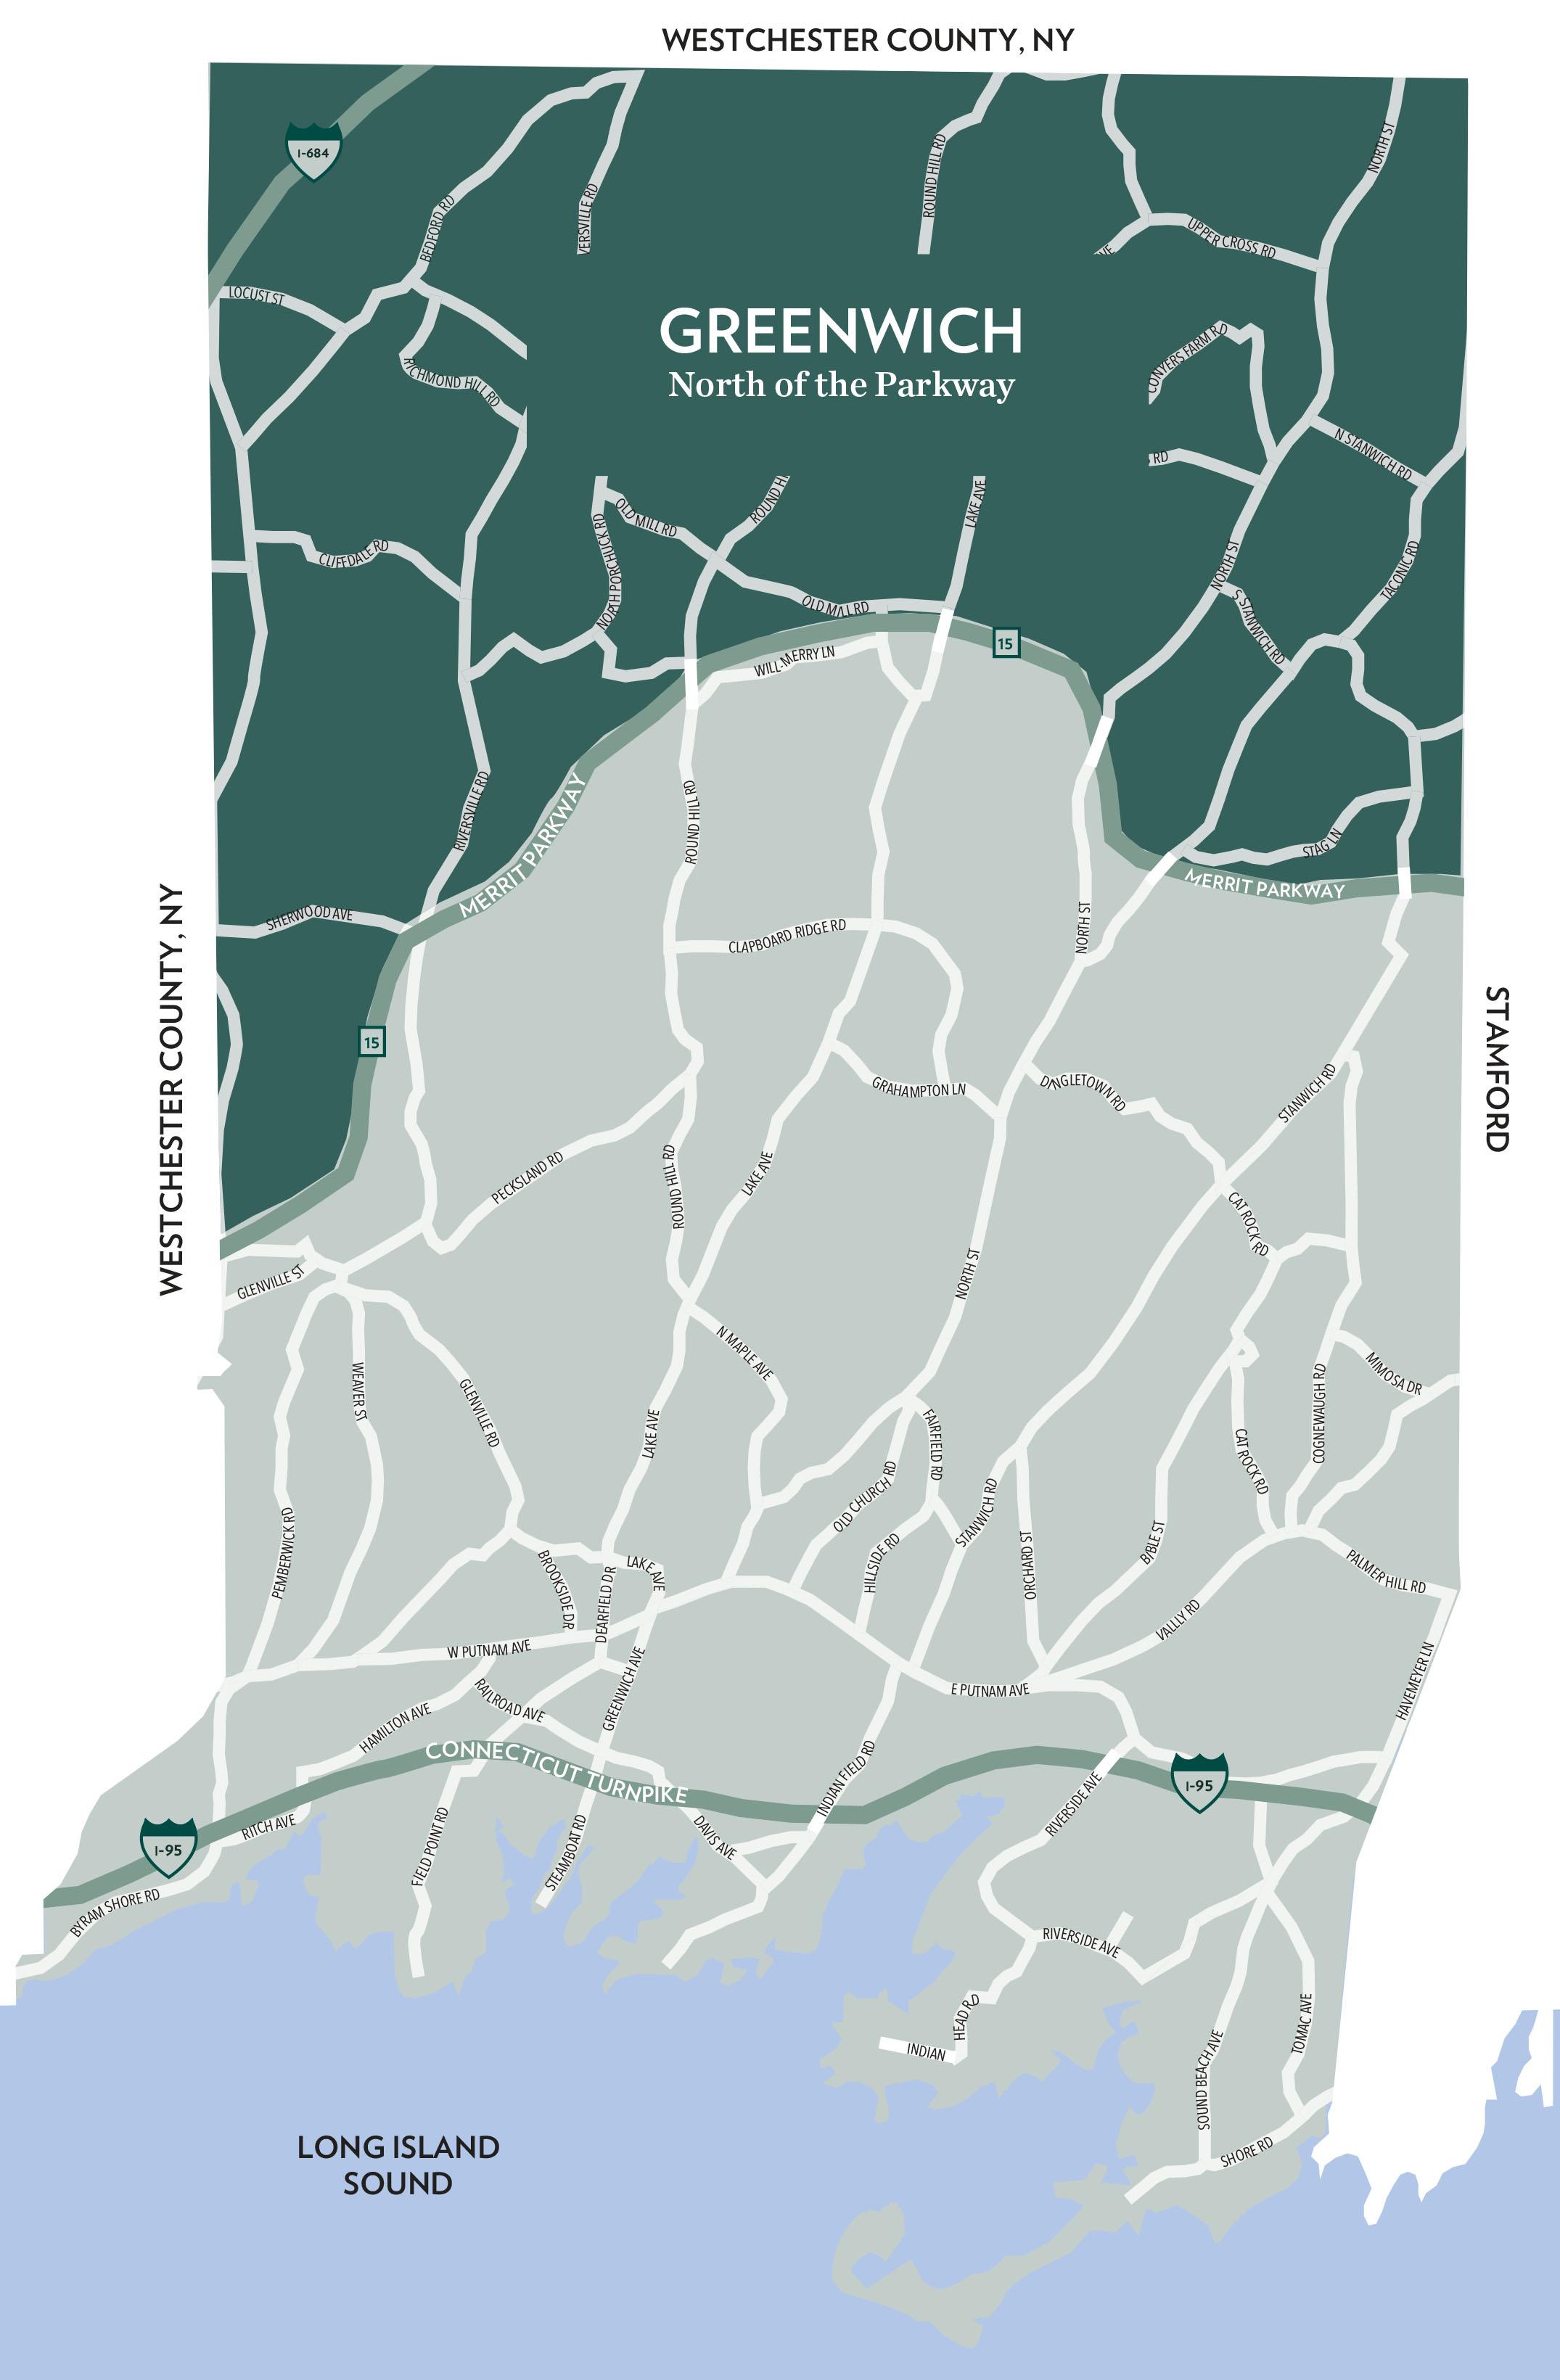
NORTH OF THE PARKWAY
TEN-YEAR MARKET HISTORY
* Homes sold for 2023 are annualized based on actual sales year-to-date.
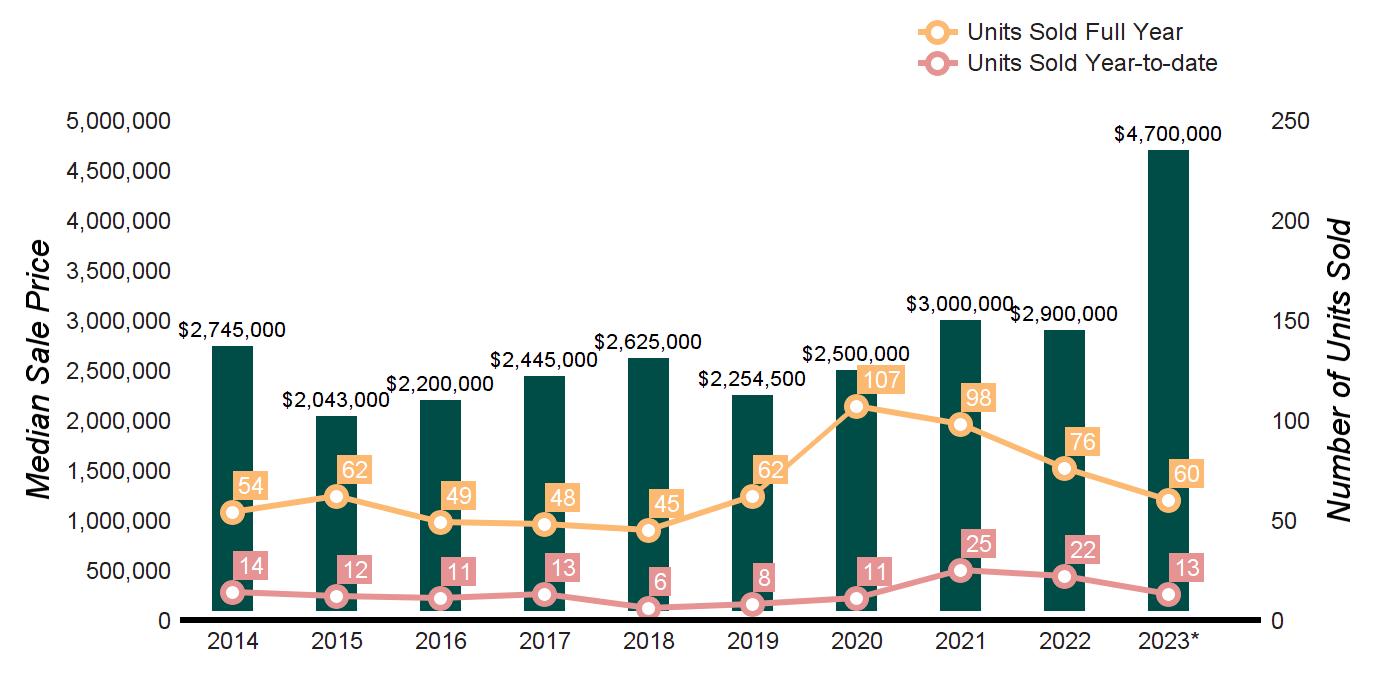
GREENWICH
Q1 2023 Q1 2022 % CHANGE FULL YEAR 2022 FULL YEAR 2021 % CHANGE HOMES SOLD 13 22 -40.9% 76 98 -22.4% AVERAGE SALE PRICE $5,157,280 $3,159,886 63.2% $3,494,702 $3,919,488 -10.8% MEDIAN SALE PRICE $4,700,000 $2,937,500 60.0% $2,900,000 $3,000,000 -3.3% AVERAGE PRICE PER SQUARE FOOT $631 $550 14.7% $596 $553 7.8% AVERAGE DAYS ON MARKET 129 134 -3.7% 102 167 -38.9% % SALE PRICE TO LIST PRICE 94.8% 95.9% -1.1% 97.3% 96.5% 0.8%
Average Sale Price $4,136,921 $2,834,463 $2,939,222 $3,590,745 $3,264,086 $3,156,247 $2,851,219 $3,919,488 $3,494,702 $5,157,280 Average Sale Price Average Price/SqFt $559 $524 $470 $501 $495 $503 $455 $553 $596 $631 Average Price/SqFt Days On Market 321 250 237 310 210 251 231 167 102 129 Days On Market %Sale Price to List Price 90.5 92.7 91.8 85.7 91.9 90.1 94.2 96.5 97.3 94.8 %Sale Price to List Price
SUPPLY DEMAND ANALYSIS
NORTH OF THE PARKWAY
GREENWICH
AS OF MARCH 31, 2023 AS OF MARCH 31, 2022 2023 vs. 2022 PRICE RANGE SUPPLY: ACTIVE LISTINGS DEMAND: PENDING SALES SUPPLY/ DEMAND RATIO* SUPPLY: ACTIVE LISTINGS DEMAND: PENDING SALES SUPPLY/ DEMAND RATIO* % CHANGE IN LISTINGS % CHANGE IN PENDINGS $0 - $999,999 0 0 Not Valid 0 1 0 0.0% -100.0% $1,000,000 - $1,999,999 2 2 1 4 1 4 -50.0% 100.0% $2,000,000 - $2,999,999 4 1 4 7 3 2 -42.9% -66.7% $3,000,000 - $3,999,999 3 3 1 3 0 Not Valid 0.0% 0.0% $4,000,000 - $4,999,999 7 1 7 2 1 2 250.0% 0.0% $5,000,000 - $5,999,999 3 0 Not Valid 3 0 Not Valid 0.0% 0.0% $6,000,000 - $7,999,999 1 2 1 7 1 7 -85.7% 100.0% $8,000,000 - $9,999,999 0 2 0 2 1 2 -100.0% 100.0% $10,000,000 and up 6 1 6 6 1 6 0.0% 0.0% MarketTotals 26 12 2 34 9 4 -23.5% 33.3% *Supply Demand Ratio Key 1-4: High Demand 5-6: Balanced 7-9: Low Demand 10+: Very Low Demand SOLD PROPERTIES YEAR-TO-DATE YEAR-OVER-YEAR 01/01/202303/31/2023 01/01/202203/31/2022 % CHANGE 2023/2022 04/01/202203/31/2023 04/01/202103/31/2022 % CHANGE 2023/2022 $0 - $999,999 0 0 Not Valid 1 6 -83.3% $1,000,000 - $1,999,999 2 7 -71.4% 13 14 -7.1% $2,000,000 - $2,999,999 1 5 -80.0% 18 24 -25.0% $3,000,000 - $3,999,999 1 4 -75.0% 11 20 -45.0% $4,000,000 - $4,999,999 3 4 -25.0% 6 12 -50.0% $5,000,000 - $5,999,999 2 0 Not Valid 6 7 -14.3% $6,000,000 - $7,999,999 1 2 -50.0% 7 5 40.0% $8,000,000 - $9,999,999 3 0 Not Valid 4 6 -33.3% $10,000,000 and up 0 0 Not Valid 1 1 0.0% MarketTotals 13 22 -40.9% 67 95 -29.5%
Source: Greenwich Multiple Listing Service, Single-family homes
QUARTERLY MARKET OVERVIEW
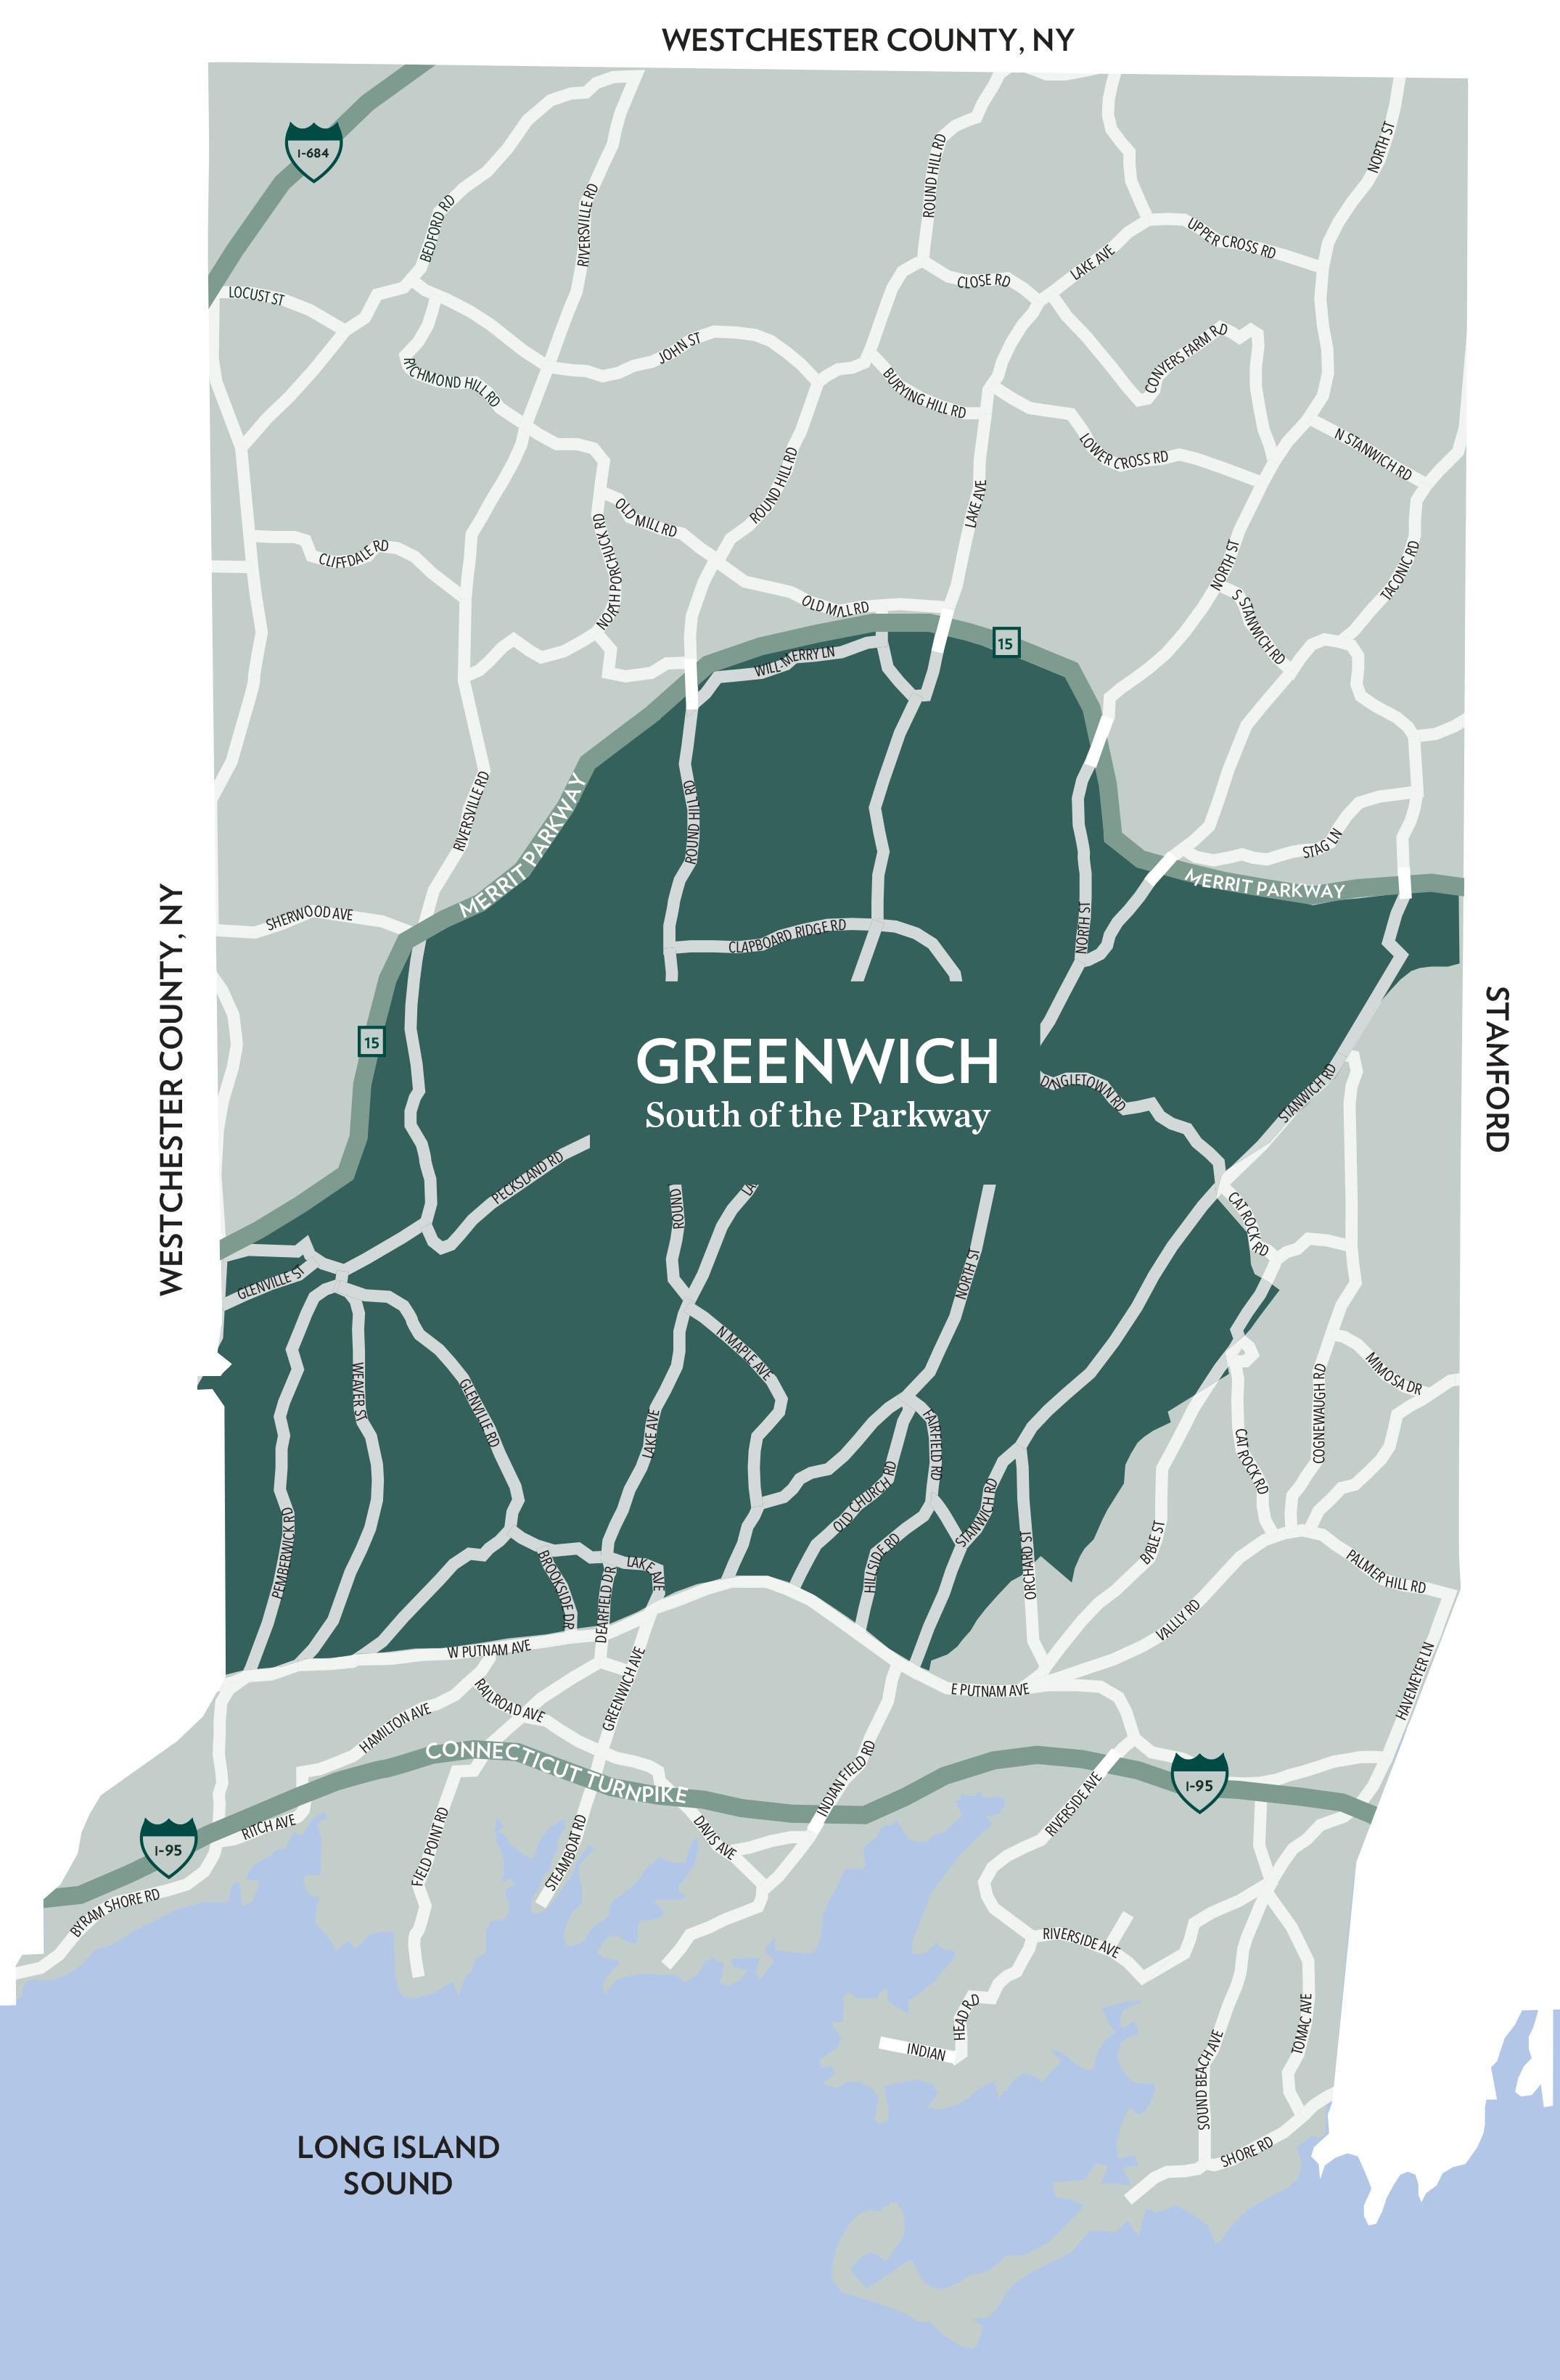
SOUTH OF THE PARKWAY
TEN-YEAR MARKET HISTORY
* Homes sold for 2023 are annualized based on actual sales year-to-date.
GREENWICH
Q1 2023 Q1 2022 % CHANGE FULL YEAR 2022 FULL YEAR 2021 % CHANGE HOMES SOLD 30 56 -46.4% 226 354 -36.2% AVERAGE SALE PRICE $3,429,940 $3,578,341 -4.1% $3,634,903 $3,212,533 13.1% MEDIAN SALE PRICE $3,075,000 $2,895,000 6.2% $3,007,500 $2,587,500 16.2% AVERAGE PRICE PER SQUARE FOOT $618 $630 -1.9% $674 $596 13.1% AVERAGE DAYS ON MARKET 72 141 -48.9% 94 126 -25.4% % SALE PRICE TO LIST PRICE 96.7% 96.8% -0.1% 98.9% 97.0% 2.0%
Average Sale Price $2,698,854 $3,075,190 $2,403,016 $2,769,791 $2,670,378 $2,537,605 $2,941,272 $3,212,533 $3,634,903 $3,429,940 Average Sale Price Average Price/SqFt $567 $587 $535 $550 $537 $499 $530 $596 $674 $618 Average Price/SqFt Days On Market 171 167 176 203 188 234 197 126 94 72 Days On Market %Sale Price to List Price 93.8 93.7 94.0 93.0 92.8 91.9 94.9 97.0 98.9 96.7 %Sale Price to List Price
SUPPLY DEMAND ANALYSIS
SOUTH OF THE PARKWAY
GREENWICH
AS OF MARCH 31, 2023 AS OF MARCH 31, 2022 2023 vs. 2022 PRICE RANGE SUPPLY: ACTIVE LISTINGS DEMAND: PENDING SALES SUPPLY/ DEMAND RATIO* SUPPLY: ACTIVE LISTINGS DEMAND: PENDING SALES SUPPLY/ DEMAND RATIO* % CHANGE IN LISTINGS % CHANGE IN PENDINGS $0 - $999,999 2 2 1 0 4 0 0.0% -50.0% $1,000,000 - $1,999,999 8 3 3 3 6 1 166.7% -50.0% $2,000,000 - $2,999,999 8 6 1 6 11 1 33.3% -45.5% $3,000,000 - $3,999,999 12 4 3 4 11 1 200.0% -63.6% $4,000,000 - $4,999,999 8 7 1 7 9 1 14.3% -22.2% $5,000,000 - $5,999,999 12 4 3 10 6 2 20.0% -33.3% $6,000,000 - $7,999,999 5 8 1 13 8 2 -61.5% 0.0% $8,000,000 - $9,999,999 2 2 1 4 0 Not Valid -50.0% 0.0% $10,000,000 and up 9 3 3 8 2 4 12.5% 50.0% MarketTotals 66 39 2 55 57 1 20.0% -31.6% *Supply Demand Ratio Key 1-4: High Demand 5-6: Balanced 7-9: Low Demand 10+: Very Low Demand SOLD PROPERTIES YEAR-TO-DATE YEAR-OVER-YEAR 01/01/202303/31/2023 01/01/202203/31/2022 % CHANGE 2023/2022 04/01/202203/31/2023 04/01/202103/31/2022 % CHANGE 2023/2022 $0 - $999,999 4 7 -42.9% 22 41 -46.3% $1,000,000 - $1,999,999 5 9 -44.4% 35 70 -50.0% $2,000,000 - $2,999,999 6 13 -53.8% 40 81 -50.6% $3,000,000 - $3,999,999 5 9 -44.4% 30 53 -43.4% $4,000,000 - $4,999,999 4 6 -33.3% 25 32 -21.9% $5,000,000 - $5,999,999 4 4 0.0% 21 19 10.5% $6,000,000 - $7,999,999 1 1 0.0% 17 26 -34.6% $8,000,000 - $9,999,999 0 6 -100.0% 4 14 -71.4% $10,000,000 and up 1 1 0.0% 6 3 100.0% MarketTotals 30 56 -46.4% 200 339 -41.0%
Source: Greenwich Multiple Listing Service, Single-family homes
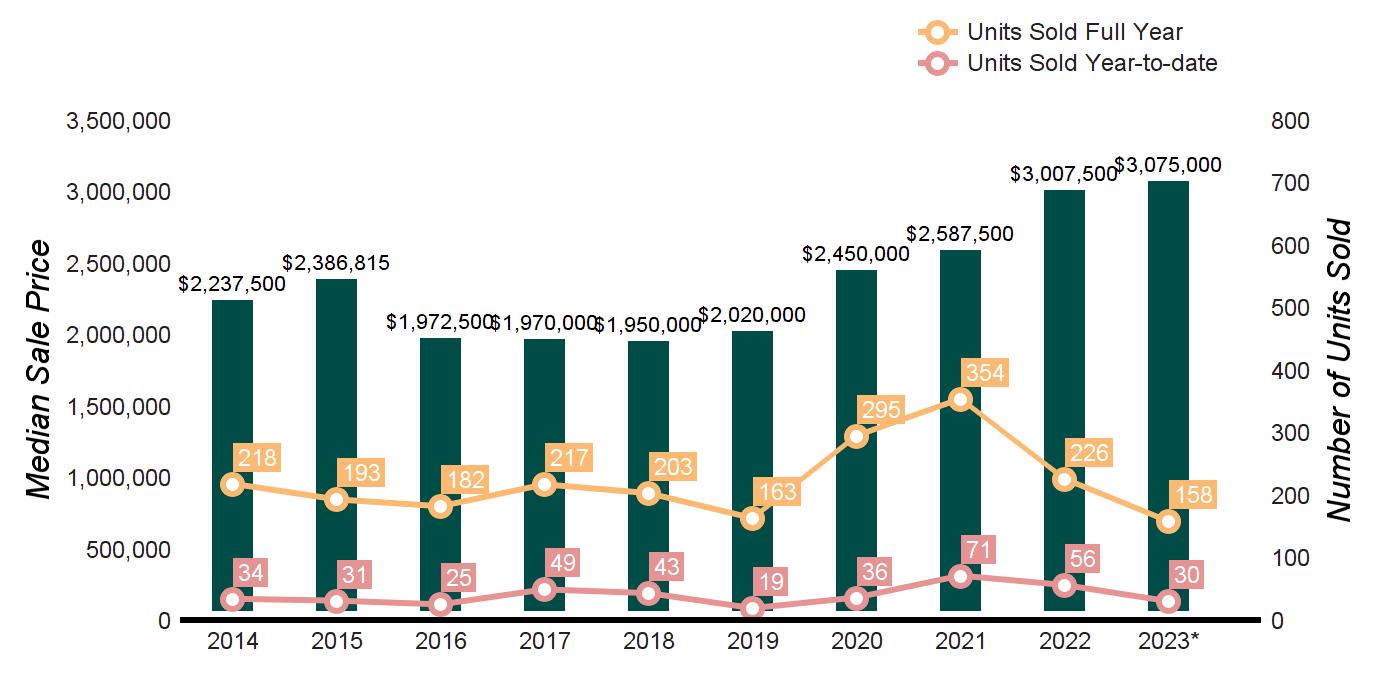
QUARTERLY MARKET OVERVIEW
GREENWICH
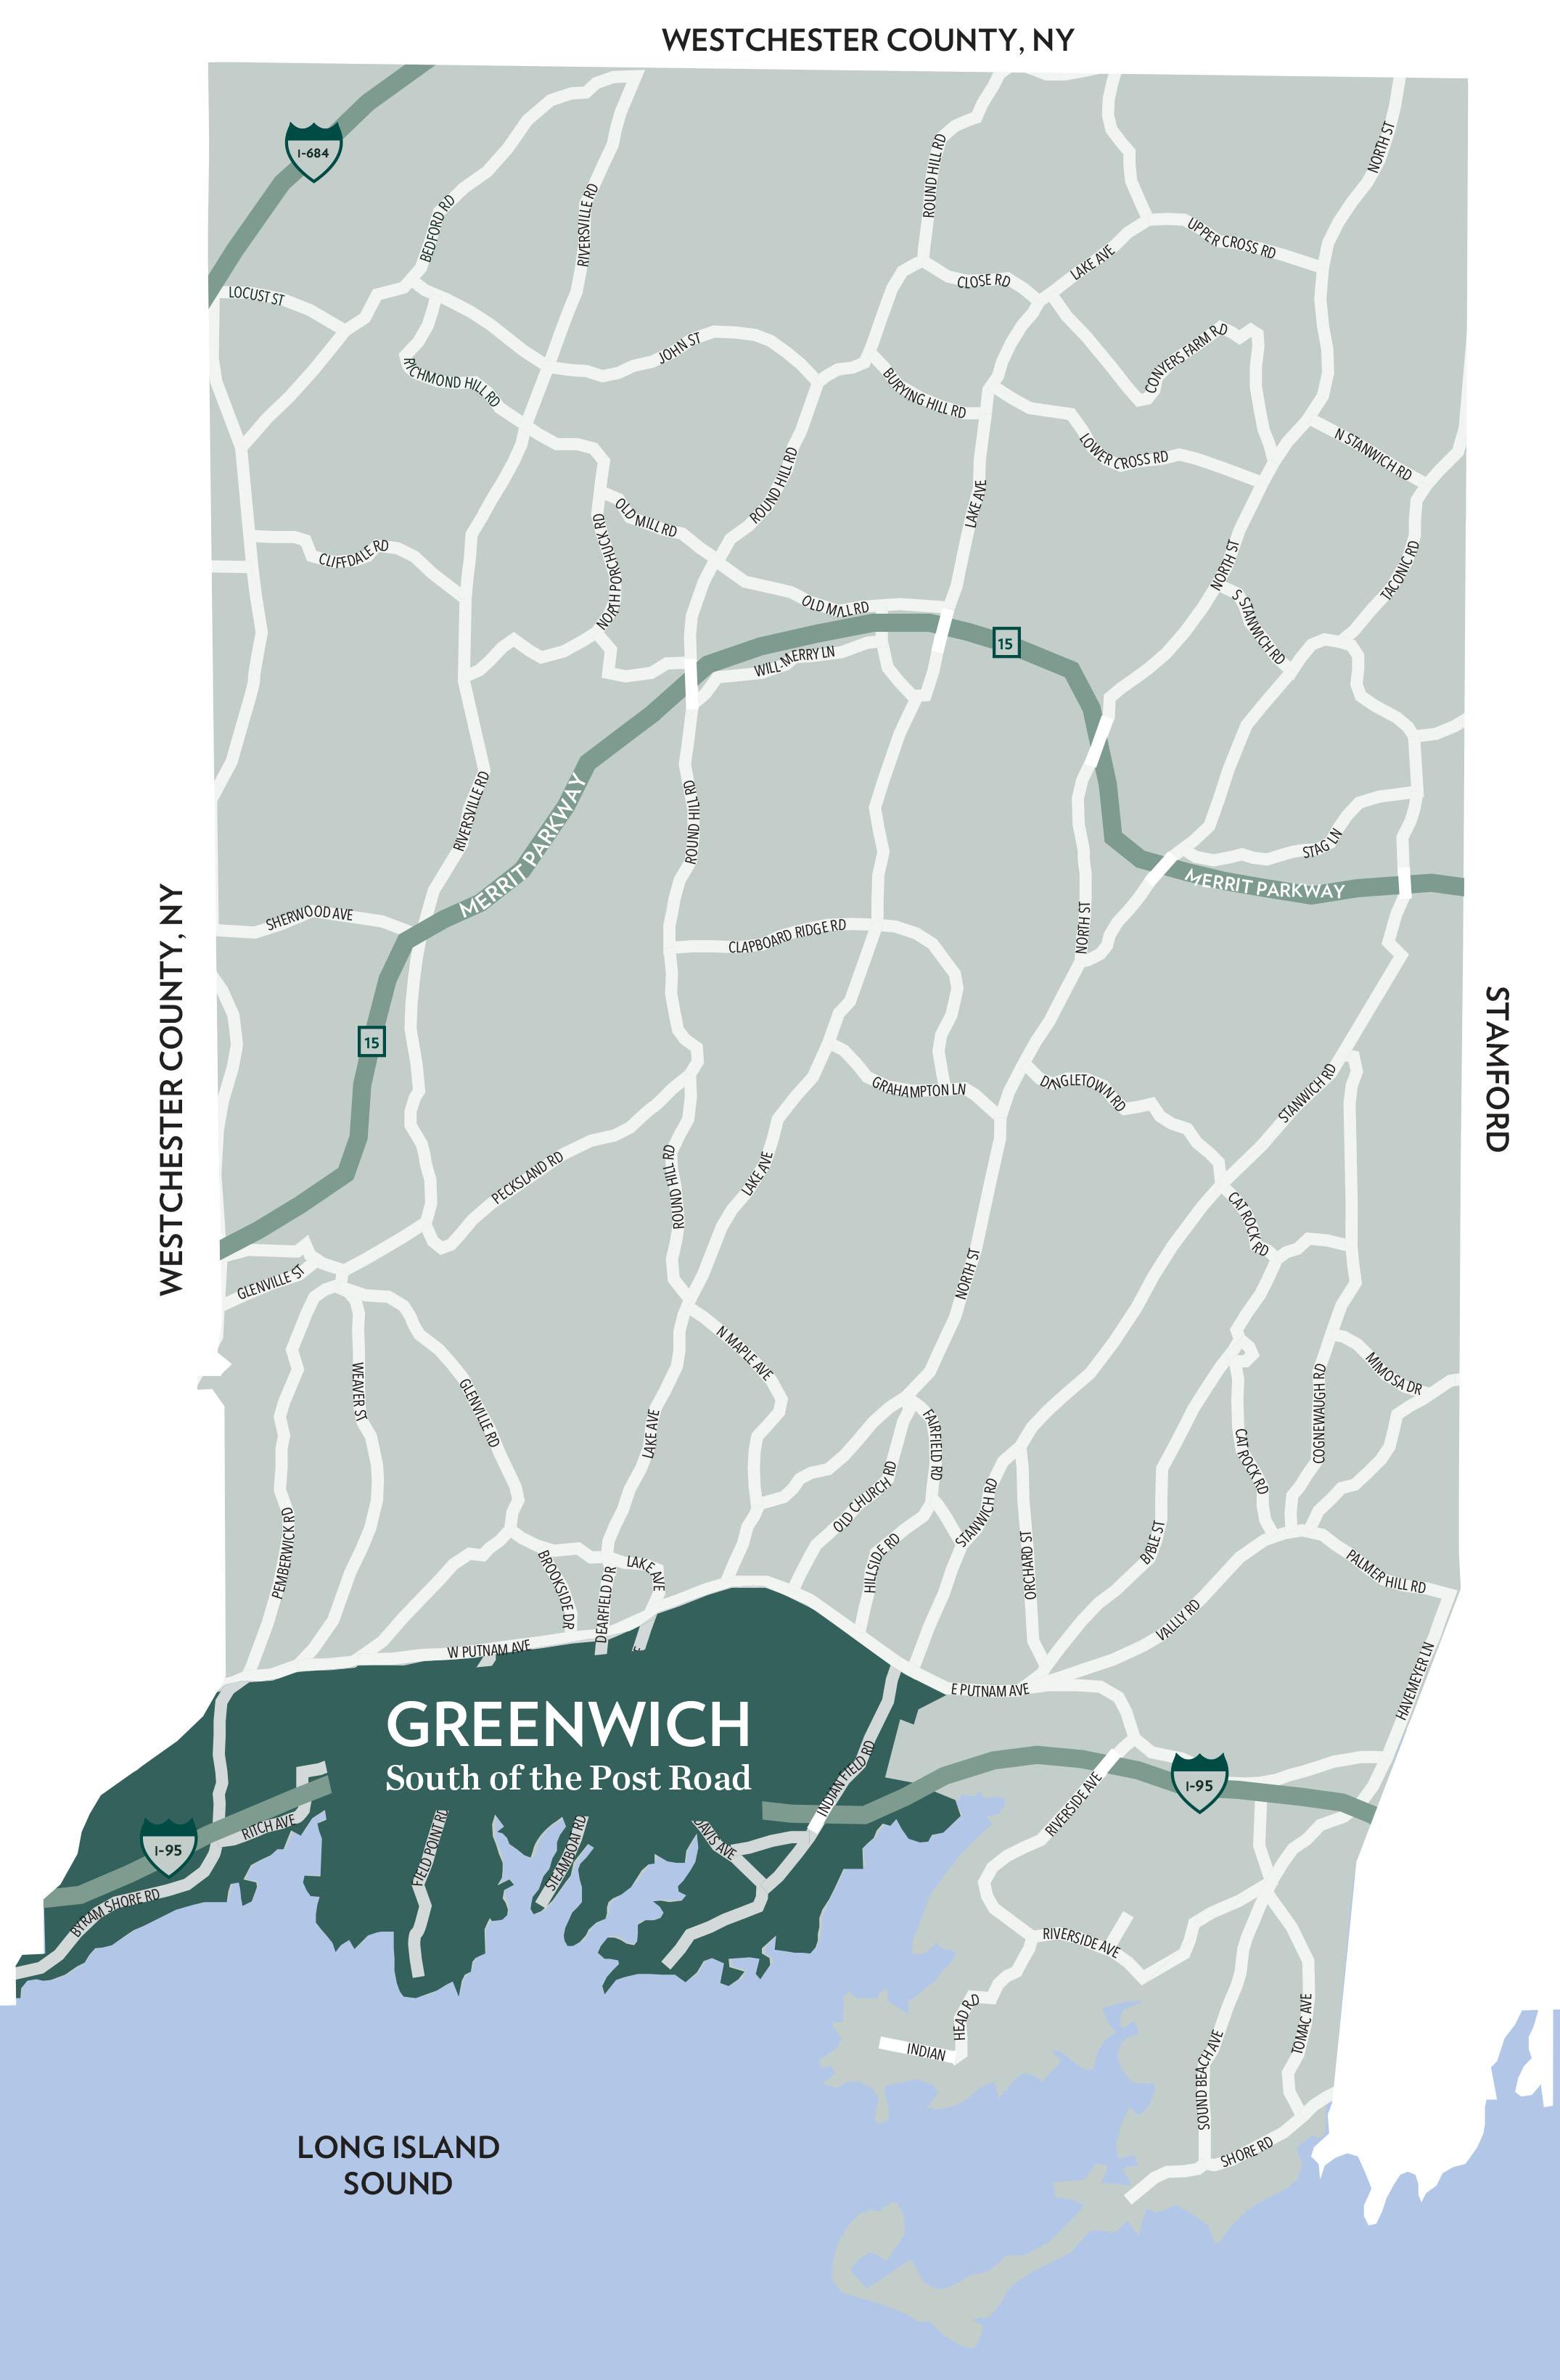
SOUTH OF THE POST ROAD
TEN-YEAR MARKET HISTORY
* Homes sold for 2023 are annualized based on actual sales year-to-date.
Q1 2023 Q1 2022 % CHANGE FULL YEAR 2022 FULL YEAR 2021 % CHANGE HOMES SOLD 6 17 -64.7% 64 124 -48.4% AVERAGE SALE PRICE $3,287,333 $3,398,352 -3.3% $3,288,974 $3,926,817 -16.2% MEDIAN SALE PRICE $3,350,000 $3,500,000 -4.3% $2,505,000 $2,392,500 4.7% AVERAGE PRICE PER SQUARE FOOT $929 $697 33.3% $752 $712 5.6% AVERAGE DAYS ON MARKET 146 167 -12.6% 85 137 -38.0% % SALE PRICE TO LIST PRICE 97.4% 97.3% 0.1% 99.6% 95.6% 4.2%
Average Sale Price $4,083,817 $2,043,325 $2,545,622 $2,977,955 $2,371,594 $2,896,440 $3,458,830 $3,926,817 $3,288,974 $3,287,333 Average Sale Price Average Price/SqFt $726 $598 $623 $639 $666 $667 $676 $712 $752 $929 Average Price/SqFt Days On Market 165 172 133 141 208 211 181 137 85 146 Days On Market %Sale Price to List Price 93.4 96.2 92.3 91.5 94.5 92.6 91.1 95.6 99.6 97.4 %Sale Price to List Price
SUPPLY DEMAND ANALYSIS
SOUTH OF THE POST ROAD
GREENWICH
AS OF MARCH 31, 2023 AS OF MARCH 31, 2022 2023 vs. 2022 PRICE RANGE SUPPLY: ACTIVE LISTINGS DEMAND: PENDING SALES SUPPLY/ DEMAND RATIO* SUPPLY: ACTIVE LISTINGS DEMAND: PENDING SALES SUPPLY/ DEMAND RATIO* % CHANGE IN LISTINGS % CHANGE IN PENDINGS $0 - $999,999 4 2 2 2 2 1 100.0% 0.0% $1,000,000 - $1,999,999 3 0 Not Valid 3 2 2 0.0% -100.0% $2,000,000 - $2,999,999 4 1 4 2 3 1 100.0% -66.7% $3,000,000 - $3,999,999 3 1 3 3 3 1 0.0% -66.7% $4,000,000 - $4,999,999 2 0 Not Valid 1 2 1 100.0% -100.0% $5,000,000 - $5,999,999 0 0 Not Valid 0 1 0 0.0% -100.0% $6,000,000 - $7,999,999 4 0 Not Valid 2 2 1 100.0% -100.0% $8,000,000 - $9,999,999 0 0 Not Valid 0 0 Not Valid 0.0% 0.0% $10,000,000 and up 6 0 Not Valid 4 0 Not Valid 50.0% 0.0% MarketTotals 26 4 7 17 15 1 52.9% -73.3% *Supply Demand Ratio Key 1-4: High Demand 5-6: Balanced 7-9: Low Demand 10+: Very Low Demand
YEAR-TO-DATE YEAR-OVER-YEAR 01/01/202303/31/2023 01/01/202203/31/2022 % CHANGE 2023/2022 04/01/202203/31/2023 04/01/202103/31/2022 % CHANGE 2023/2022 $0 - $999,999 1 3 -66.7% 9 15 -40.0% $1,000,000 - $1,999,999 0 2 -100.0% 12 24 -50.0% $2,000,000 - $2,999,999 2 2 0.0% 9 21 -57.1% $3,000,000 - $3,999,999 0 3 -100.0% 1 13 -92.3% $4,000,000 - $4,999,999 2 5 -60.0% 6 13 -53.8% $5,000,000 - $5,999,999 1 1 0.0% 11 5 120.0% $6,000,000 - $7,999,999 0 0 Not Valid 4 7 -42.9% $8,000,000 - $9,999,999 0 0 Not Valid 1 1 0.0% $10,000,000 and up 0 1 -100.0% 0 9 -100.0% MarketTotals 6 17 -64.7% 53 108 -50.9%
SOLD PROPERTIES
Source: Greenwich Multiple Listing Service, Single-family homes
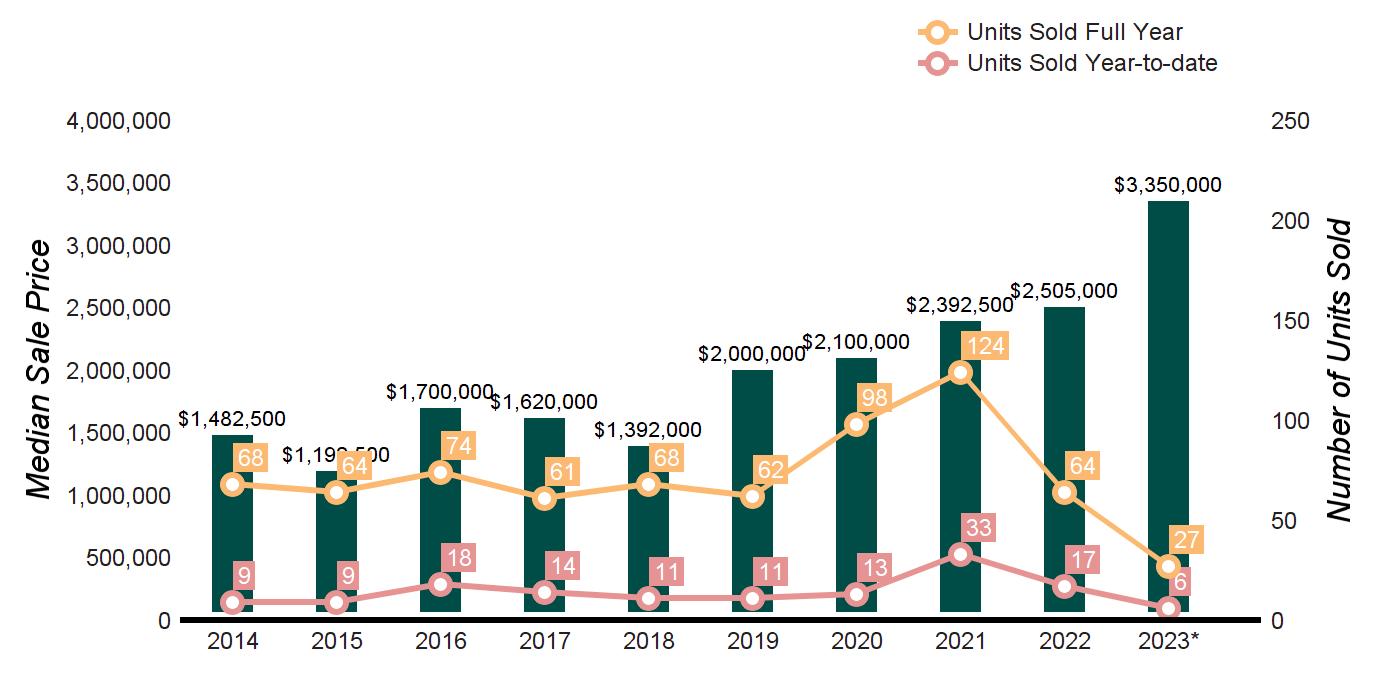
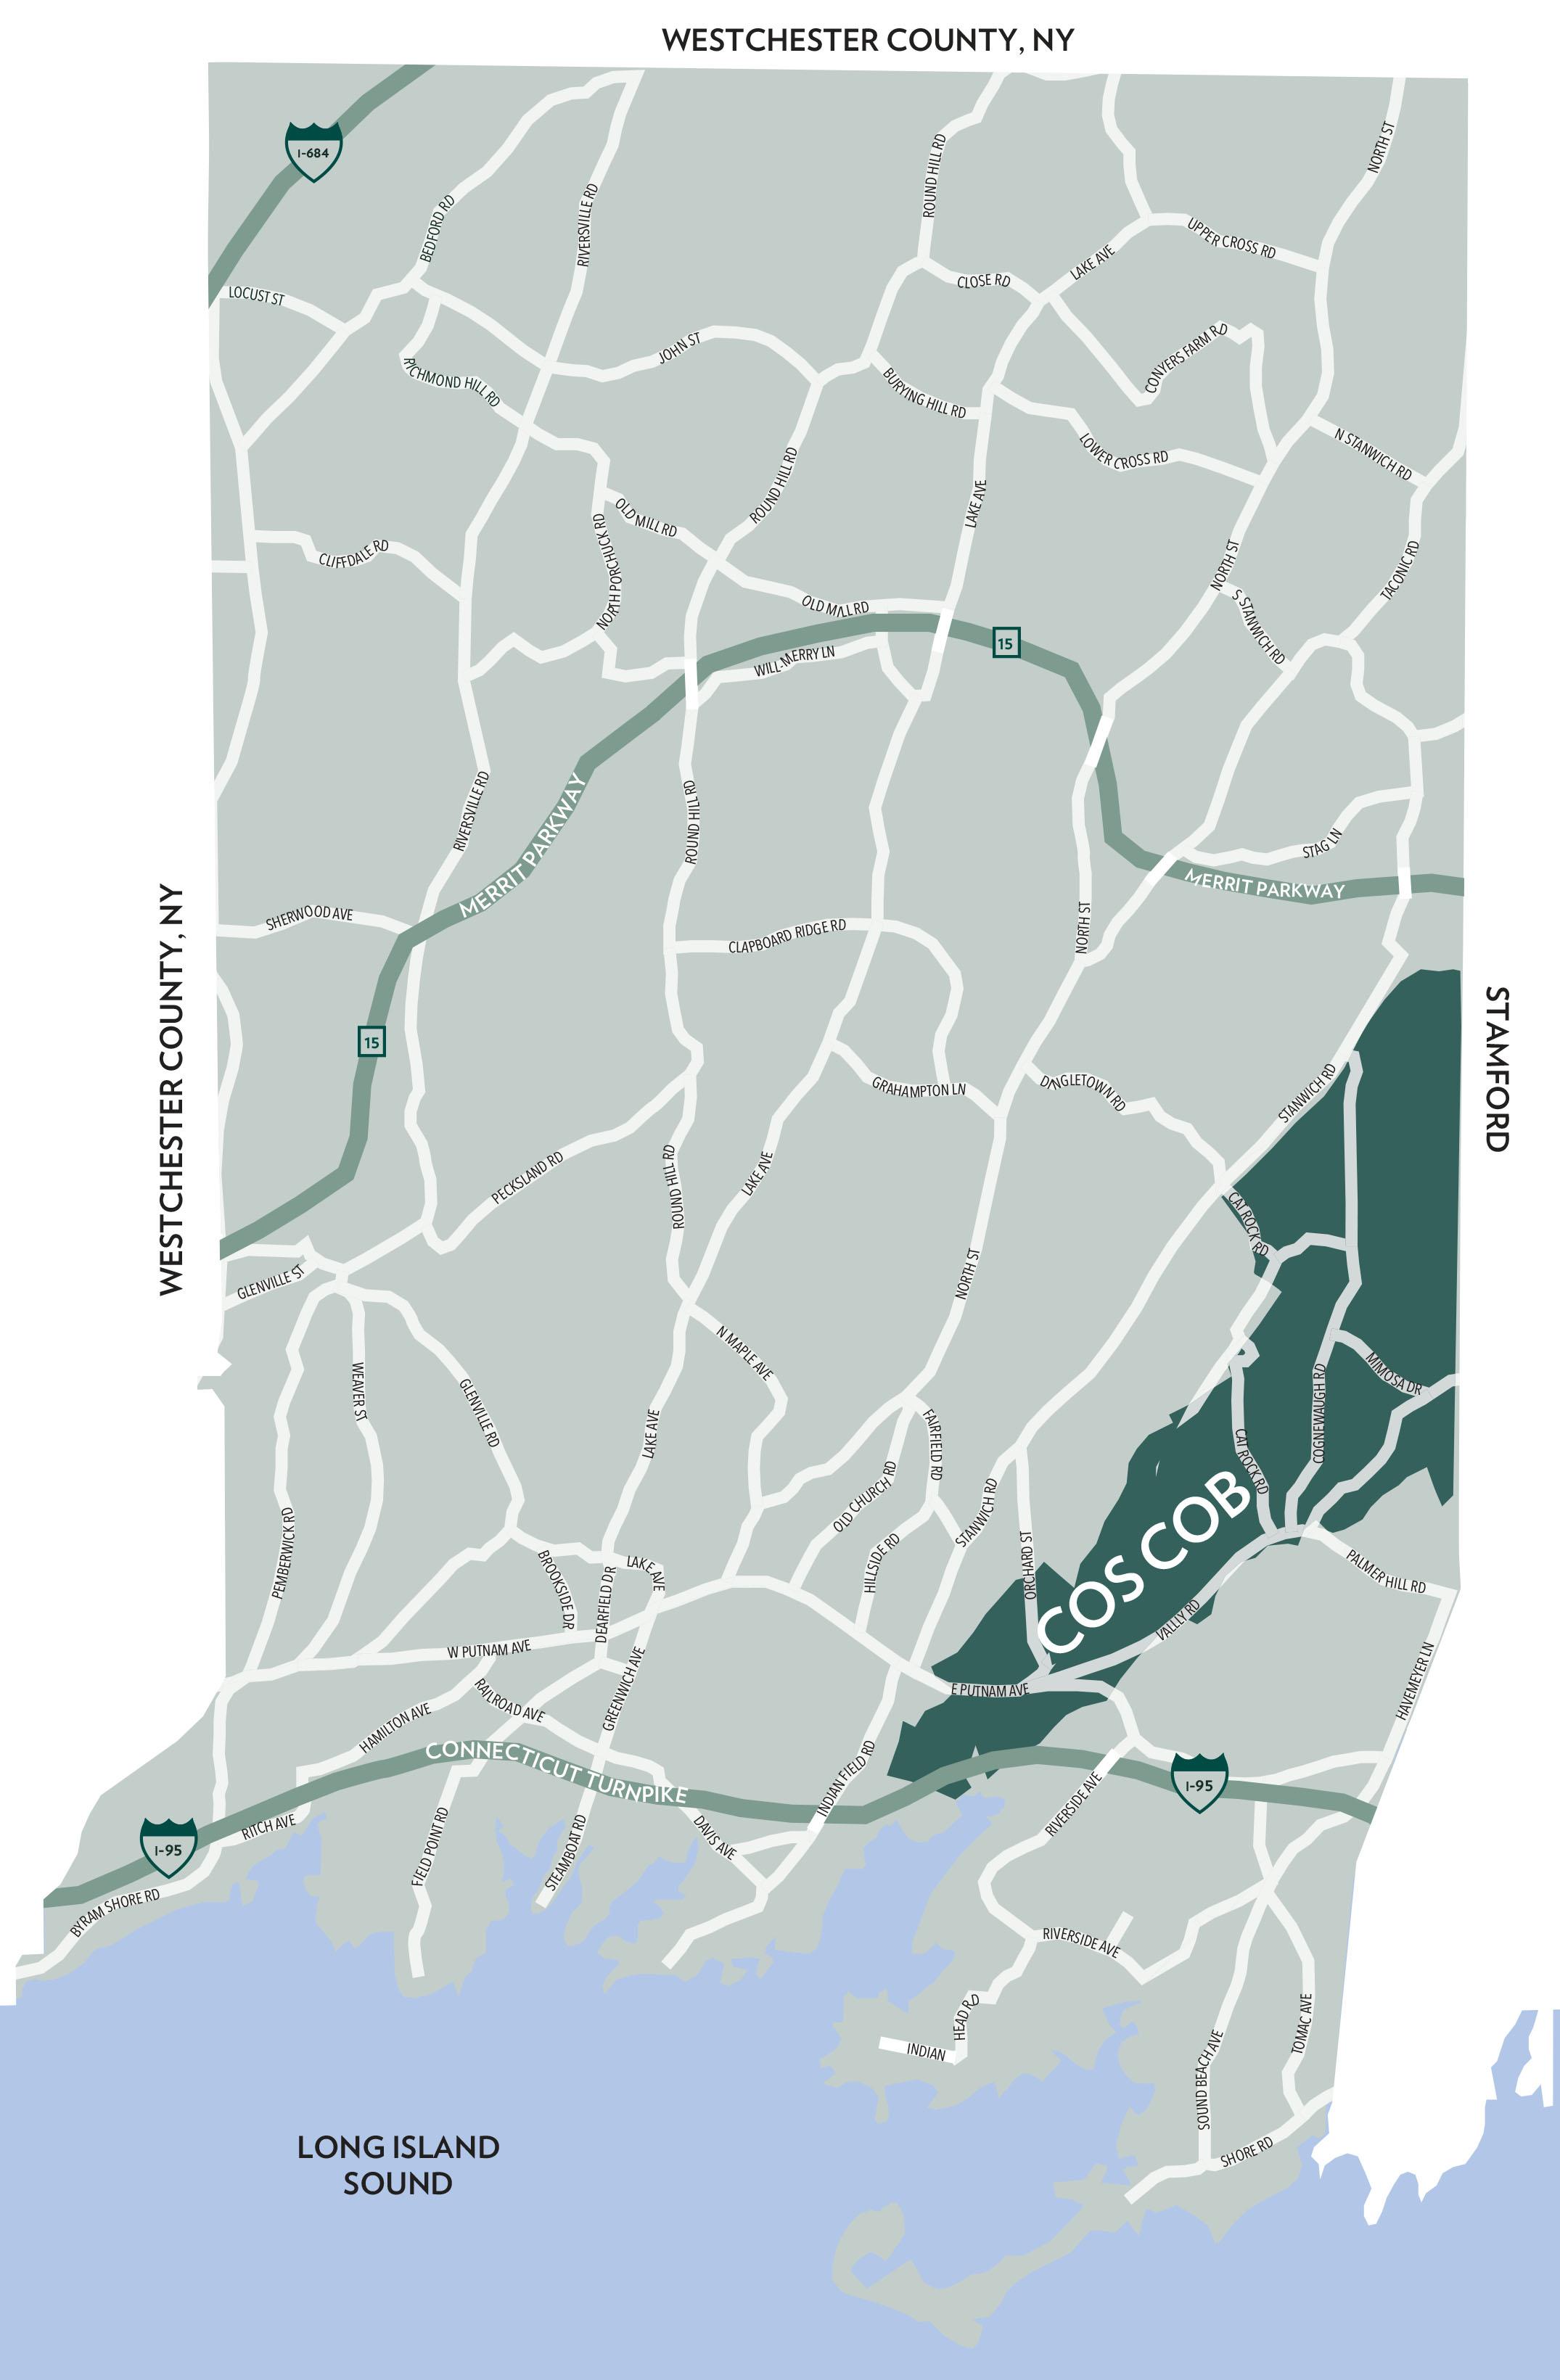
QUARTERLY MARKET OVERVIEW
COS COB
TEN-YEAR MARKET HISTORY
* Homes sold for 2023 are annualized based on actual sales year-to-date.
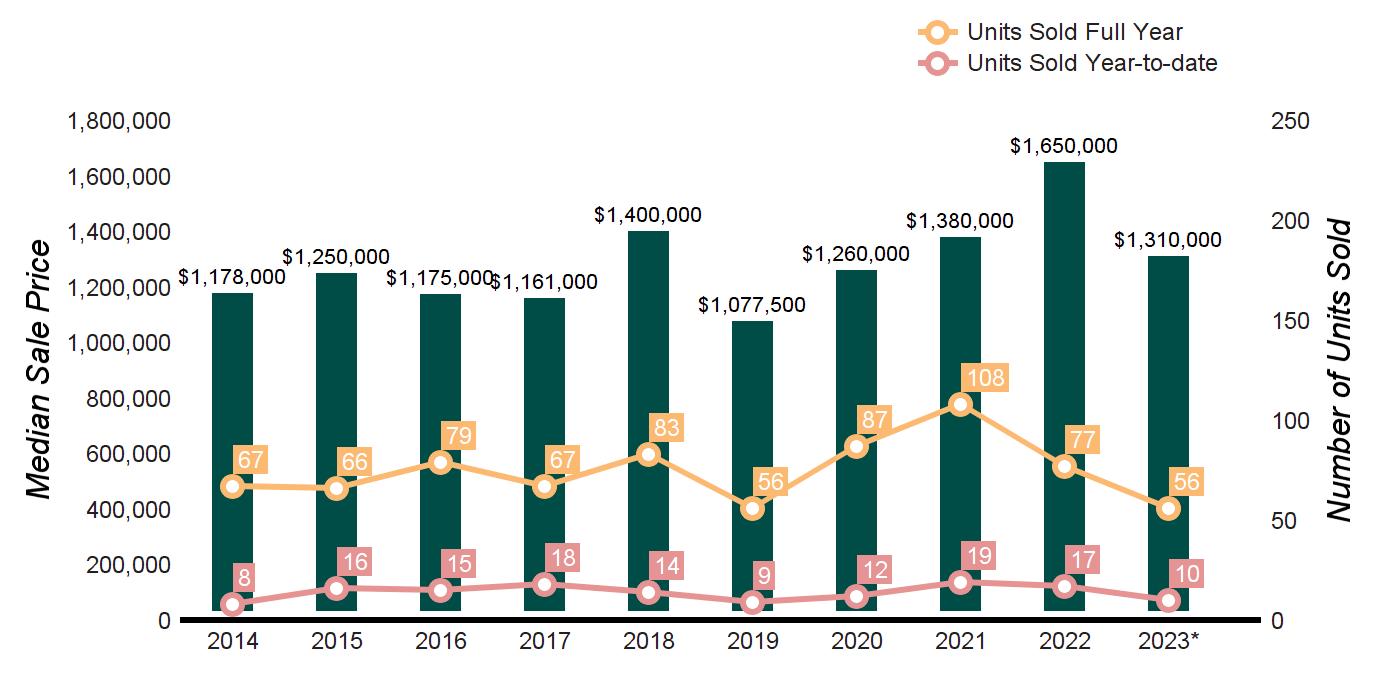
Q1 2023 Q1 2022 % CHANGE FULL YEAR 2022 FULL YEAR 2021 % CHANGE HOMES SOLD 10 17 -41.2% 77 108 -28.7% AVERAGE SALE PRICE $1,393,680 $1,666,251 -16.4% $1,815,667 $1,645,808 10.3% MEDIAN SALE PRICE $1,310,000 $1,450,000 -9.7% $1,650,000 $1,380,000 19.6% AVERAGE PRICE PER SQUARE FOOT $519 $538 -3.5% $583 $532 9.6% AVERAGE DAYS ON MARKET 97 70 38.6% 51 100 -49.0% % SALE PRICE TO LIST PRICE 97.2% 99.4% -2.2% 101.0% 98.1% 3.0%
Average Sale Price $1,254,598 $1,365,294 $1,321,116 $1,331,751 $1,564,416 $1,248,246 $1,408,910 $1,645,808 $1,815,667 $1,393,680 Average Sale Price Average Price/SqFt $466 $506 $490 $456 $486 $436 $444 $532 $583 $519 Average Price/SqFt Days On Market 103 137 139 142 153 141 157 100 51 97 Days On Market %Sale Price to List Price 96.1 96.2 96.0 95.0 95.4 94.4 96.1 98.1 101.0 97.2 %Sale Price to List Price
SUPPLY DEMAND ANALYSIS
SOLD PROPERTIES
COS COB
AS OF MARCH 31, 2023 AS OF MARCH 31, 2022 2023 vs. 2022 PRICE RANGE SUPPLY: ACTIVE LISTINGS DEMAND: PENDING SALES SUPPLY/ DEMAND RATIO* SUPPLY: ACTIVE LISTINGS DEMAND: PENDING SALES SUPPLY/ DEMAND RATIO* % CHANGE IN LISTINGS % CHANGE IN PENDINGS $0 - $999,999 1 1 1 2 0 Not Valid -50.0% 0.0% $1,000,000 - $1,999,999 6 5 1 4 8 1 50.0% -37.5% $2,000,000 - $2,999,999 3 1 3 2 2 1 50.0% -50.0% $3,000,000 - $3,999,999 2 0 Not Valid 2 2 1 0.0% -100.0% $4,000,000 - $4,999,999 0 1 0 0 1 0 0.0% 0.0% $5,000,000 - $5,999,999 0 0 Not Valid 0 0 Not Valid 0.0% 0.0% $6,000,000 - $7,999,999 0 0 Not Valid 0 0 Not Valid 0.0% 0.0% $8,000,000 - $9,999,999 0 0 Not Valid 0 0 Not Valid 0.0% 0.0% $10,000,000 and up 0 0 Not Valid 0 0 Not Valid 0.0% 0.0% MarketTotals 12 8 2 10 13 1 20.0% -38.5% *Supply Demand Ratio Key 1-4: High Demand 5-6: Balanced 7-9: Low Demand 10+: Very Low Demand
YEAR-TO-DATE YEAR-OVER-YEAR 01/01/202303/31/2023 01/01/202203/31/2022 % CHANGE 2023/2022 04/01/202203/31/2023 04/01/202103/31/2022 % CHANGE 2023/2022 $0 - $999,999 3 3 0.0% 11 20 -45.0% $1,000,000 - $1,999,999 6 10 -40.0% 37 56 -33.9% $2,000,000 - $2,999,999 1 3 -66.7% 16 22 -27.3% $3,000,000 - $3,999,999 0 1 -100.0% 4 7 -42.9% $4,000,000 - $4,999,999 0 0 Not Valid 2 1 100.0% $5,000,000 - $5,999,999 0 0 Not Valid 0 0 Not Valid $6,000,000 - $7,999,999 0 0 Not Valid 0 0 Not Valid $8,000,000 - $9,999,999 0 0 Not Valid 0 0 Not Valid $10,000,000 and up 0 0 Not Valid 0 0 Not Valid MarketTotals 10 17 -41.2% 70 106 -34.0%
Greenwich Multiple Listing Service, Single-family homes
Source:
QUARTERLY MARKET OVERVIEW
TEN-YEAR MARKET HISTORY
* Homes sold for 2023 are annualized based on actual sales year-to-date.
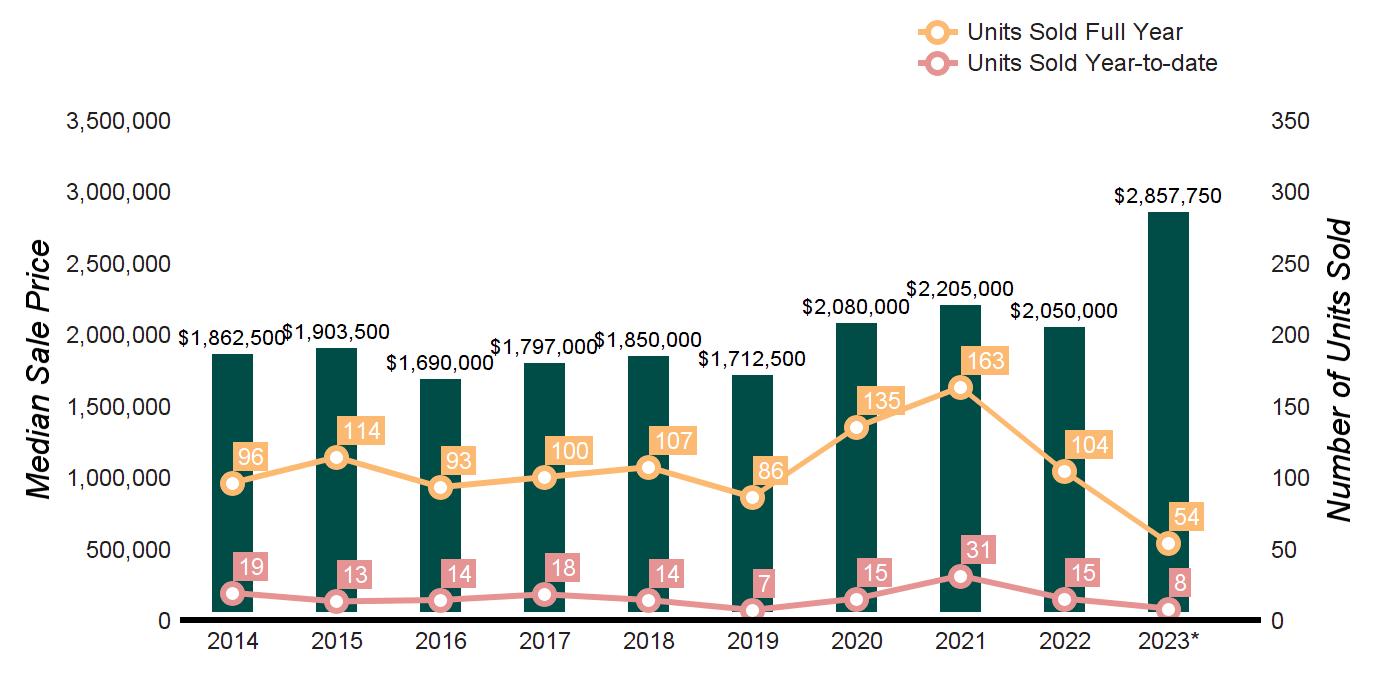
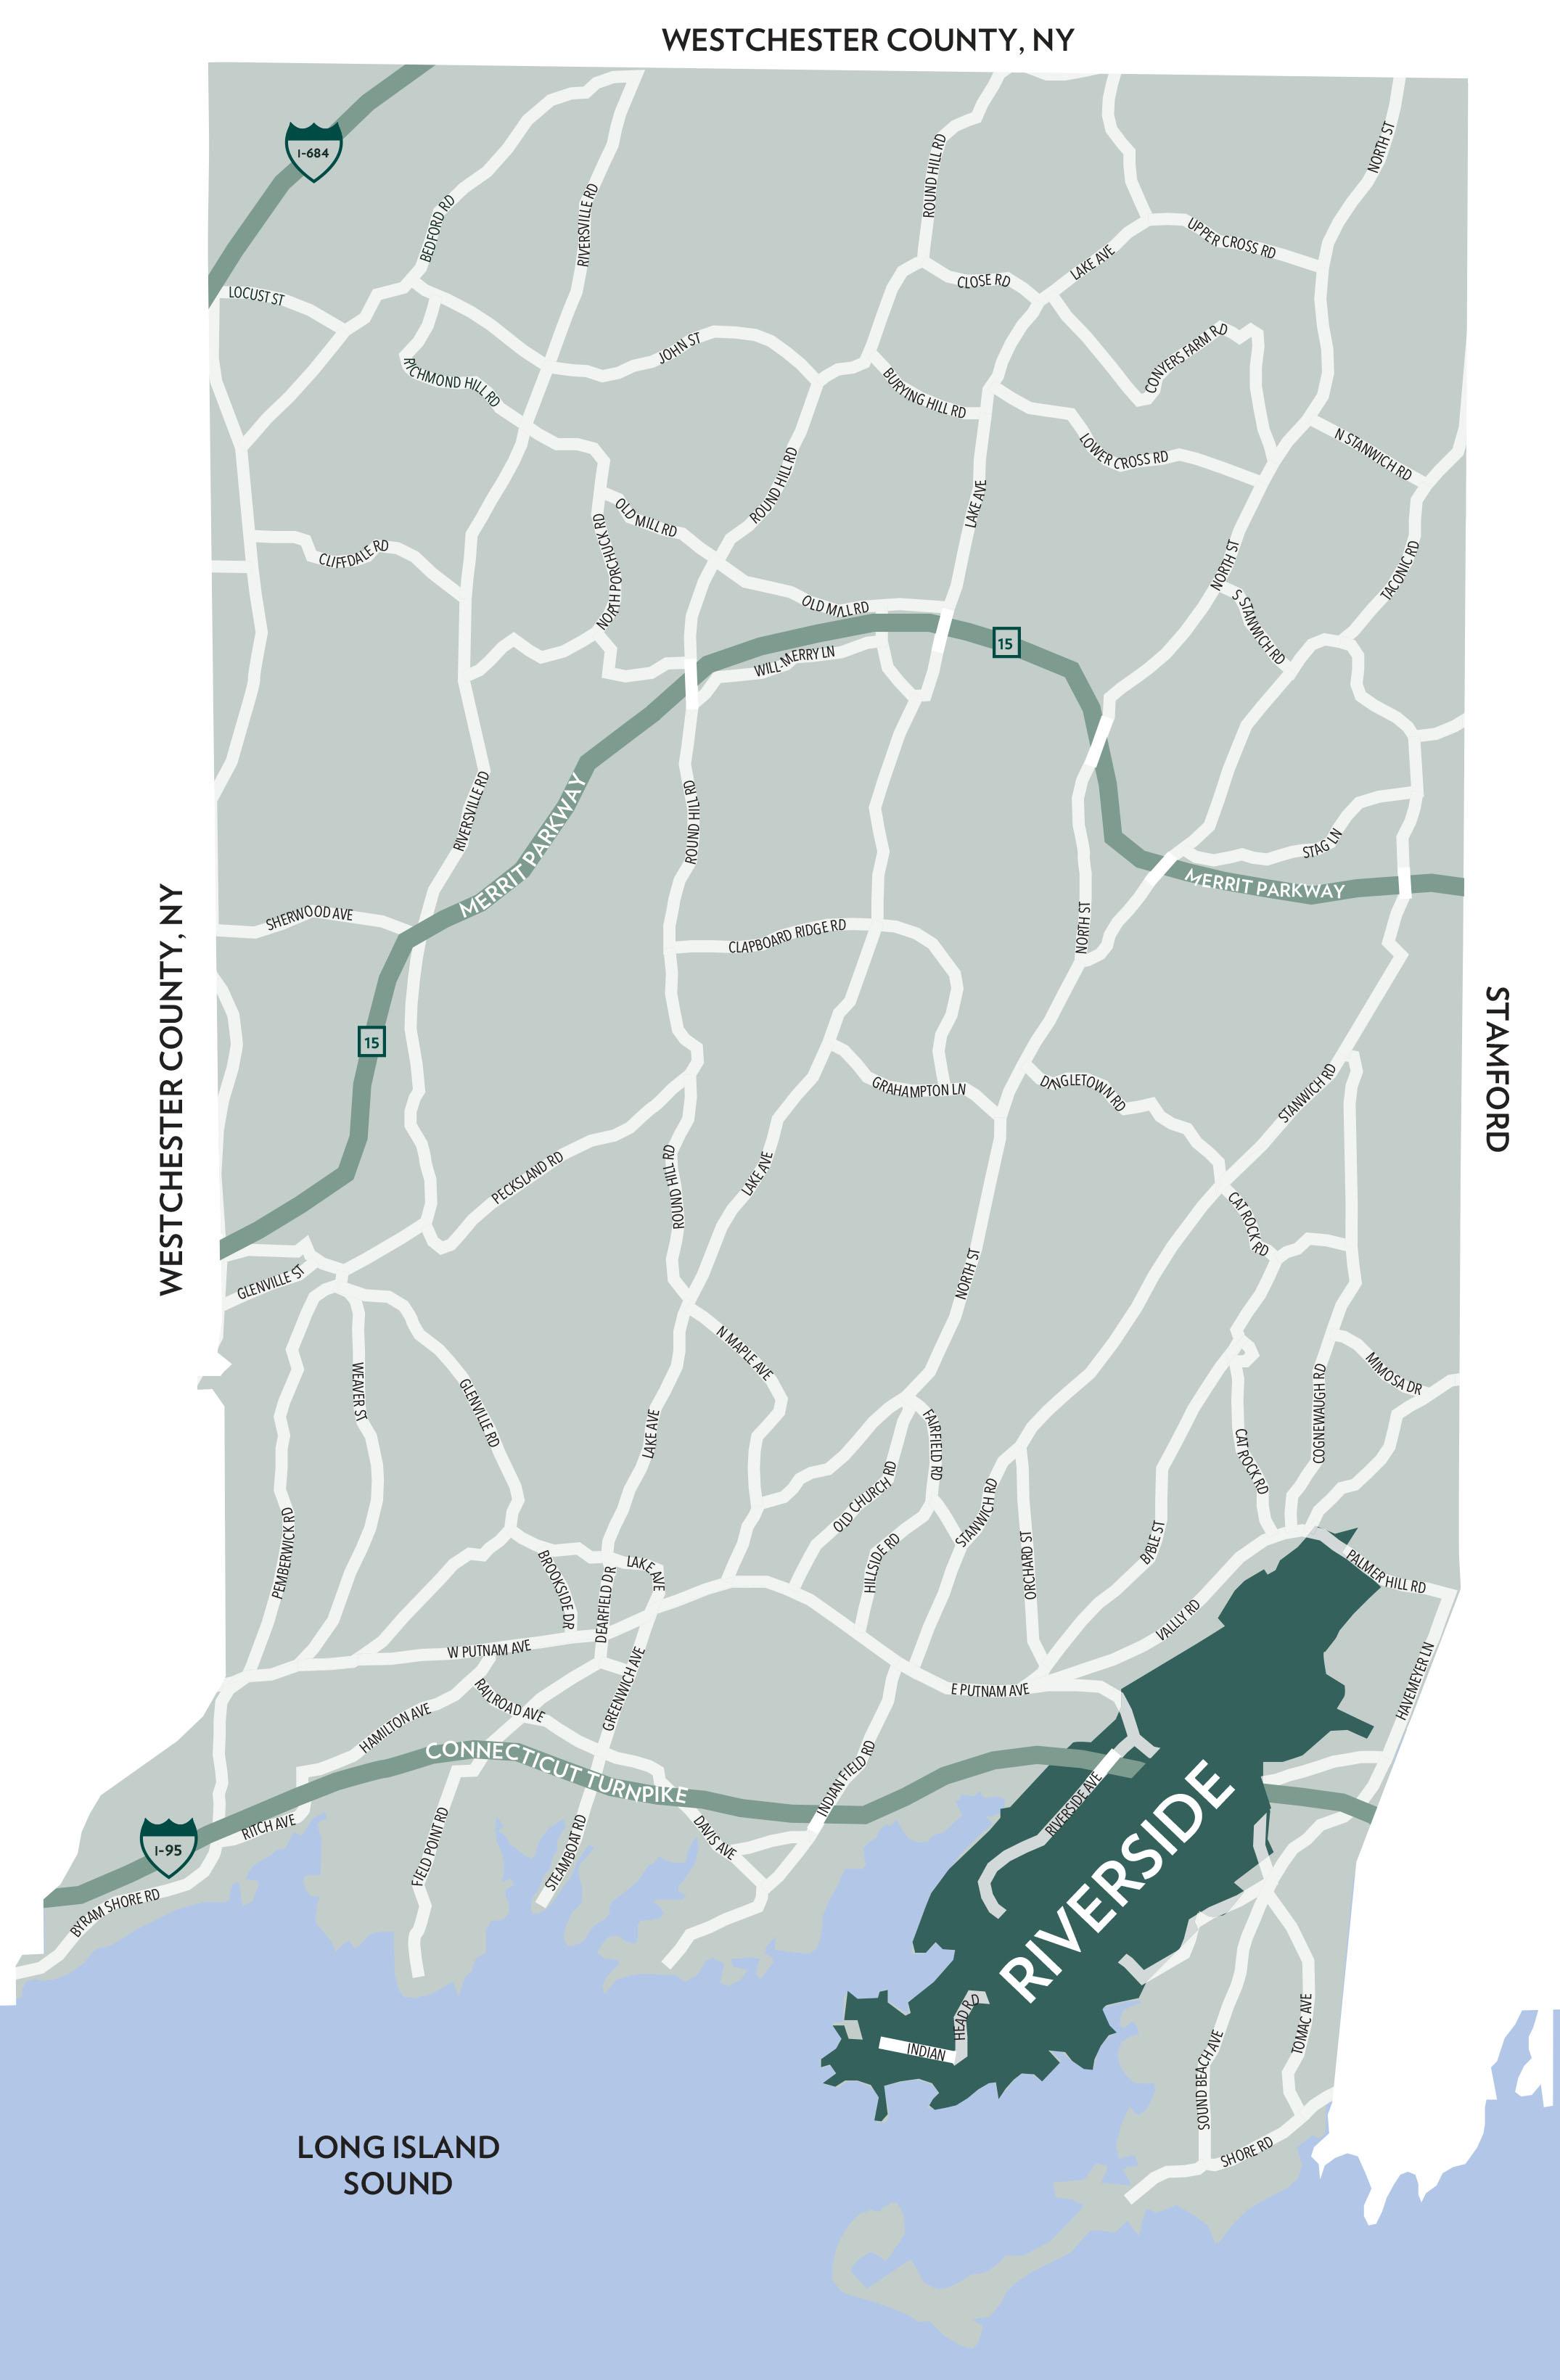
RIVERSIDE
Q1 2023 Q1 2022 % CHANGE FULL YEAR 2022 FULL YEAR 2021 % CHANGE HOMES SOLD 8 15 -46.7% 104 163 -36.2% AVERAGE SALE PRICE $3,450,407 $2,189,633 57.6% $2,507,628 $2,614,485 -4.1% MEDIAN SALE PRICE $2,857,750 $1,850,000 54.5% $2,050,000 $2,205,000 -7.0% AVERAGE PRICE PER SQUARE FOOT $844 $695 21.4% $757 $678 11.7% AVERAGE DAYS ON MARKET 47 61 -23.0% 54 75 -28.0% % SALE PRICE TO LIST PRICE 103.6% 100.9% 2.7% 102.0% 99.7% 2.3%
Average Sale Price $2,000,919 $2,275,811 $2,121,616 $2,371,435 $2,353,592 $1,945,173 $2,587,852 $2,614,485 $2,507,628 $3,450,407 Average Sale Price Average Price/SqFt $599 $634 $601 $619 $595 $542 $618 $678 $757 $844 Average Price/SqFt Days On Market 107 122 138 147 168 180 125 75 54 47 Days On Market %Sale Price to List Price 96.6 94.6 93.9 94.7 94.9 94.1 94.3 99.7 102.0 103.6 %Sale Price to List Price
SUPPLY DEMAND ANALYSIS
SOLD PROPERTIES
Greenwich Multiple Listing Service, Single-family homes
RIVERSIDE
AS OF MARCH 31, 2023 AS OF MARCH 31, 2022 2023 vs. 2022 PRICE RANGE SUPPLY: ACTIVE LISTINGS DEMAND: PENDING SALES SUPPLY/ DEMAND RATIO* SUPPLY: ACTIVE LISTINGS DEMAND: PENDING SALES SUPPLY/ DEMAND RATIO* % CHANGE IN LISTINGS % CHANGE IN PENDINGS $0 - $999,999 1 0 Not Valid 0 6 0 0.0% -100.0% $1,000,000 - $1,999,999 1 3 1 2 8 1 -50.0% -62.5% $2,000,000 - $2,999,999 4 5 1 4 3 1 0.0% 66.7% $3,000,000 - $3,999,999 1 5 1 4 4 1 -75.0% 25.0% $4,000,000 - $4,999,999 2 2 1 5 1 5 -60.0% 100.0% $5,000,000 - $5,999,999 2 0 Not Valid 0 0 Not Valid 0.0% 0.0% $6,000,000 - $7,999,999 0 0 Not Valid 0 0 Not Valid 0.0% 0.0% $8,000,000 - $9,999,999 0 0 Not Valid 0 0 Not Valid 0.0% 0.0% $10,000,000 and up 2 0 Not Valid 1 0 Not Valid 100.0% 0.0% MarketTotals 13 15 1 16 22 1 -18.8% -31.8% *Supply Demand Ratio Key 1-4: High Demand 5-6: Balanced 7-9: Low Demand 10+: Very Low Demand
YEAR-TO-DATE YEAR-OVER-YEAR 01/01/202303/31/2023 01/01/202203/31/2022 % CHANGE 2023/2022 04/01/202203/31/2023 04/01/202103/31/2022 % CHANGE 2023/2022 $0 - $999,999 0 2 -100.0% 8 14 -42.9% $1,000,000 - $1,999,999 2 7 -71.4% 33 49 -32.7% $2,000,000 - $2,999,999 2 2 0.0% 26 37 -29.7% $3,000,000 - $3,999,999 1 3 -66.7% 12 25 -52.0% $4,000,000 - $4,999,999 0 0 Not Valid 10 9 11.1% $5,000,000 - $5,999,999 2 1 100.0% 4 9 -55.6% $6,000,000 - $7,999,999 1 0 Not Valid 3 4 -25.0% $8,000,000 - $9,999,999 0 0 Not Valid 1 0 Not Valid $10,000,000 and up 0 0 Not Valid 0 0 Not Valid MarketTotals 8 15 -46.7% 97 147 -34.0%
Source:
QUARTERLY MARKET OVERVIEW
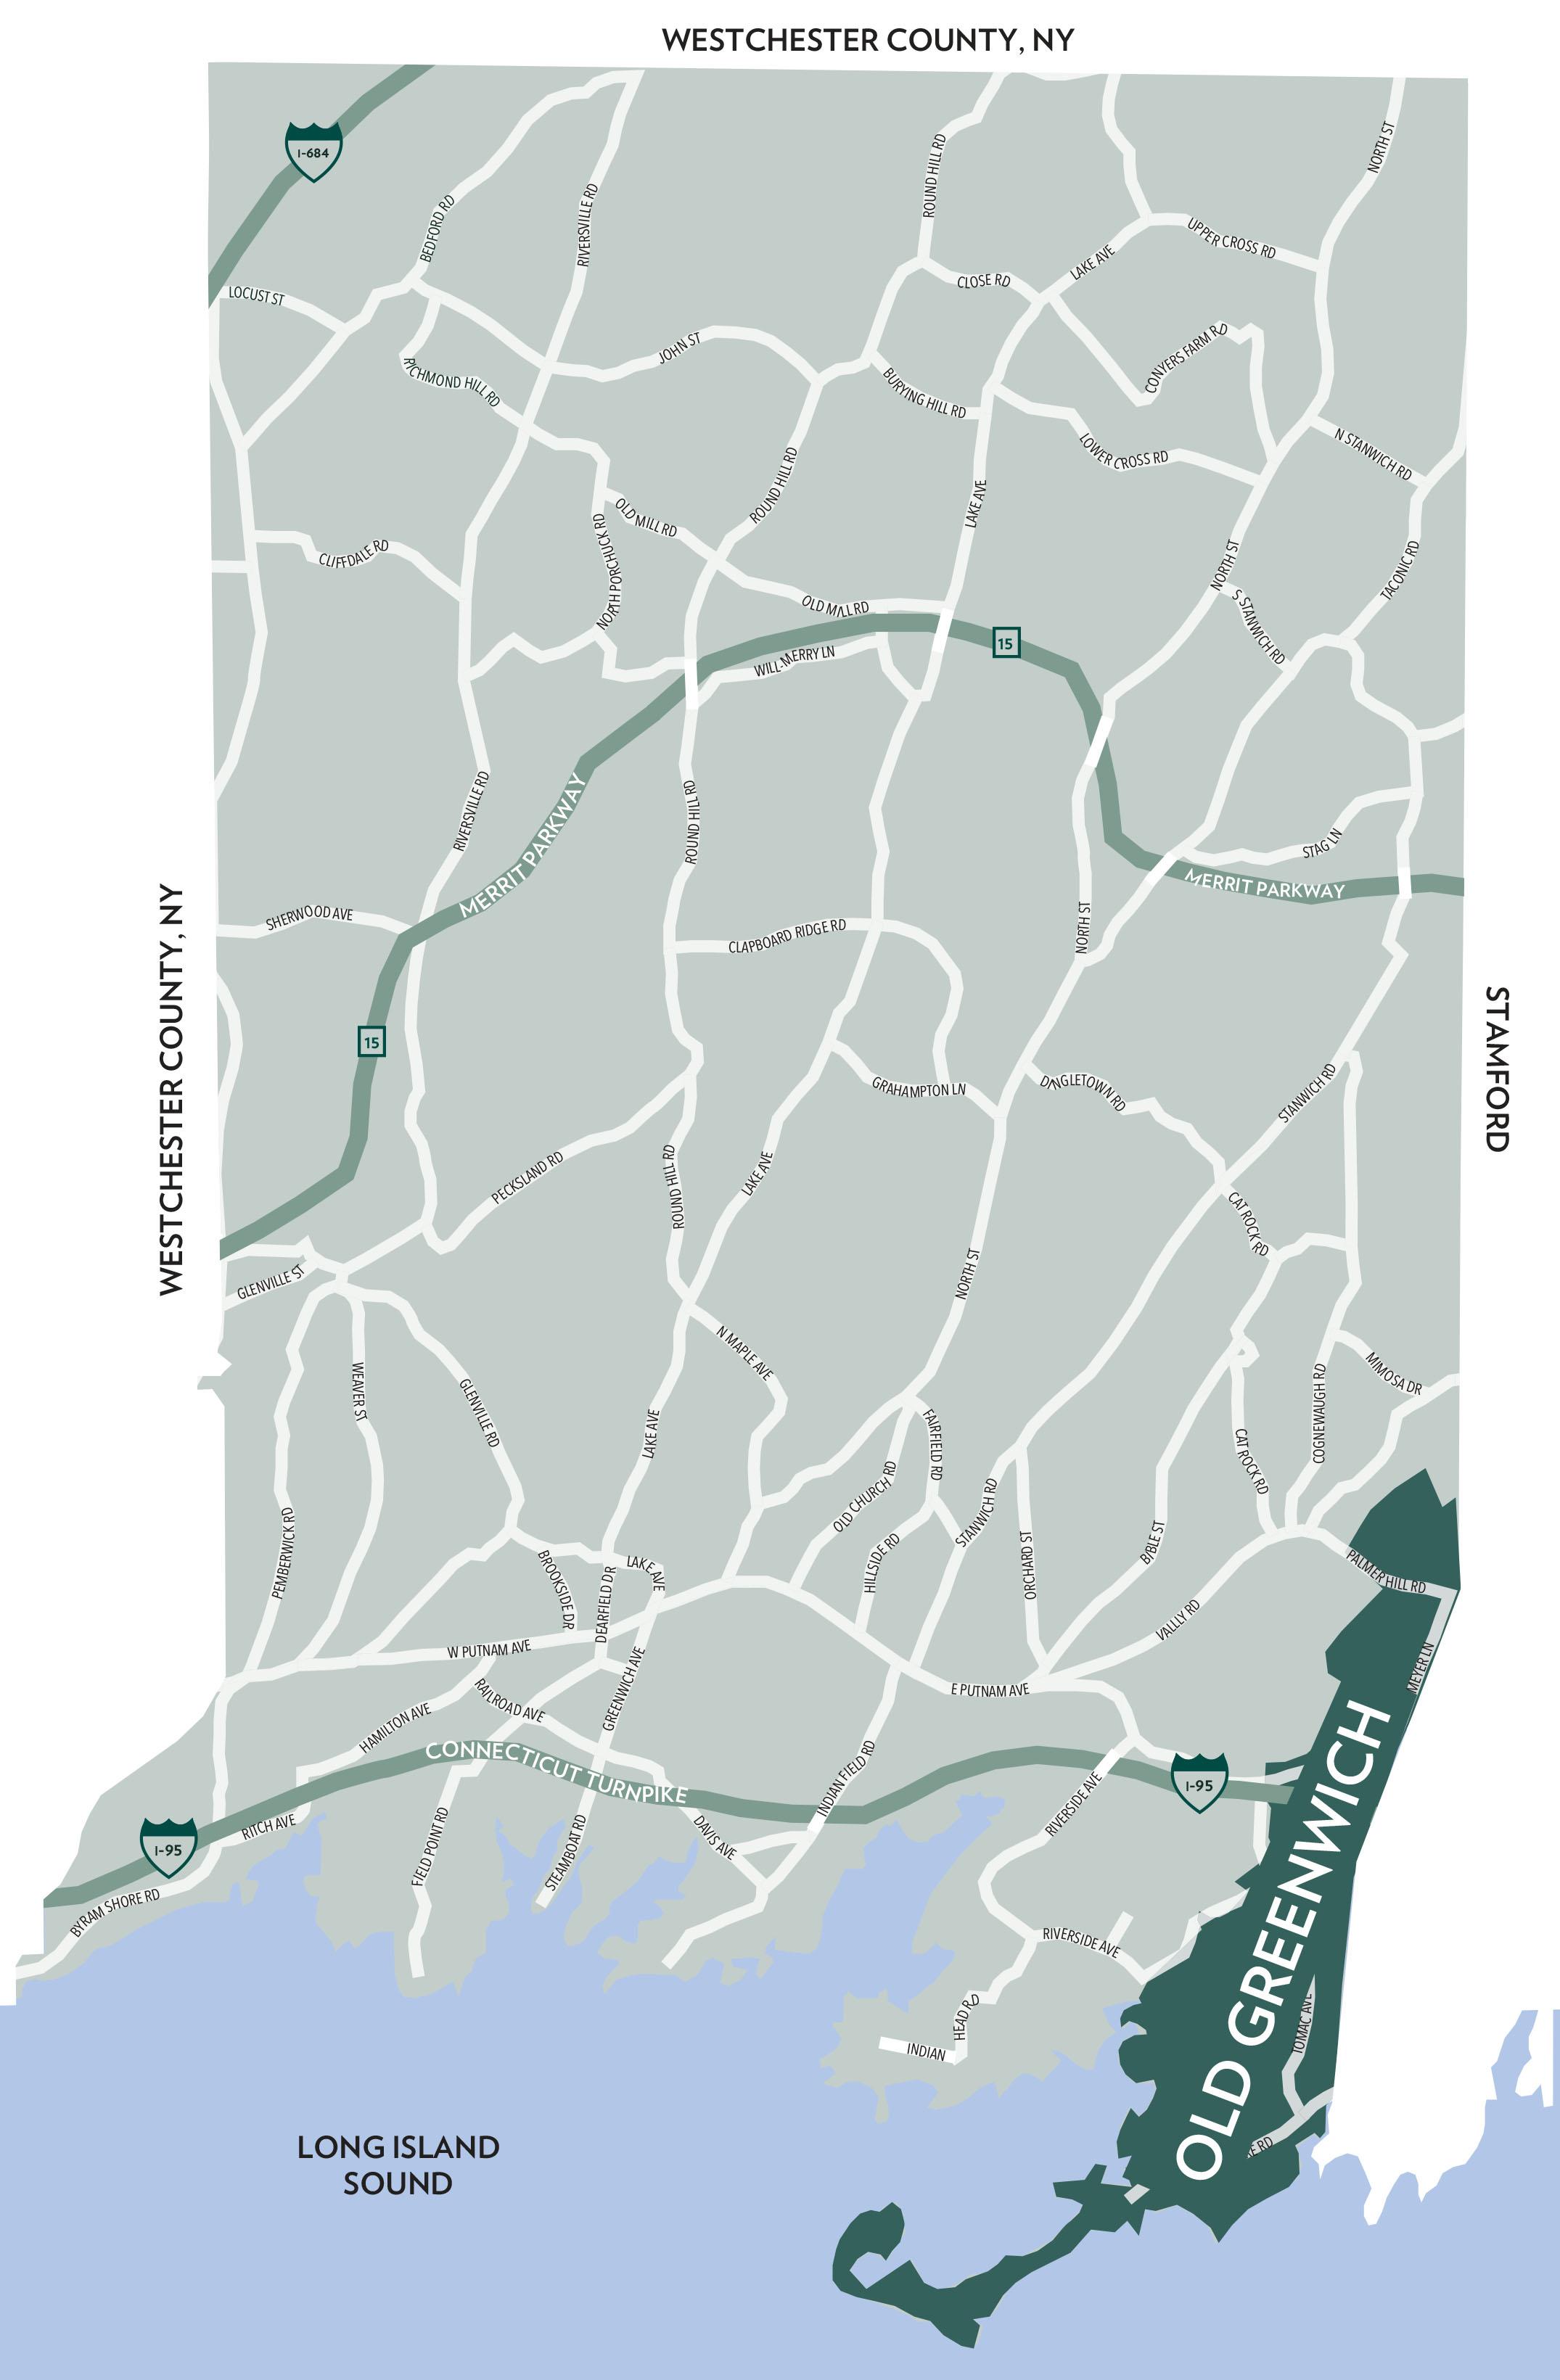
OLD GREENWICH
TEN-YEAR MARKET HISTORY
* Homes sold for 2023 are annualized based on actual sales year-to-date.
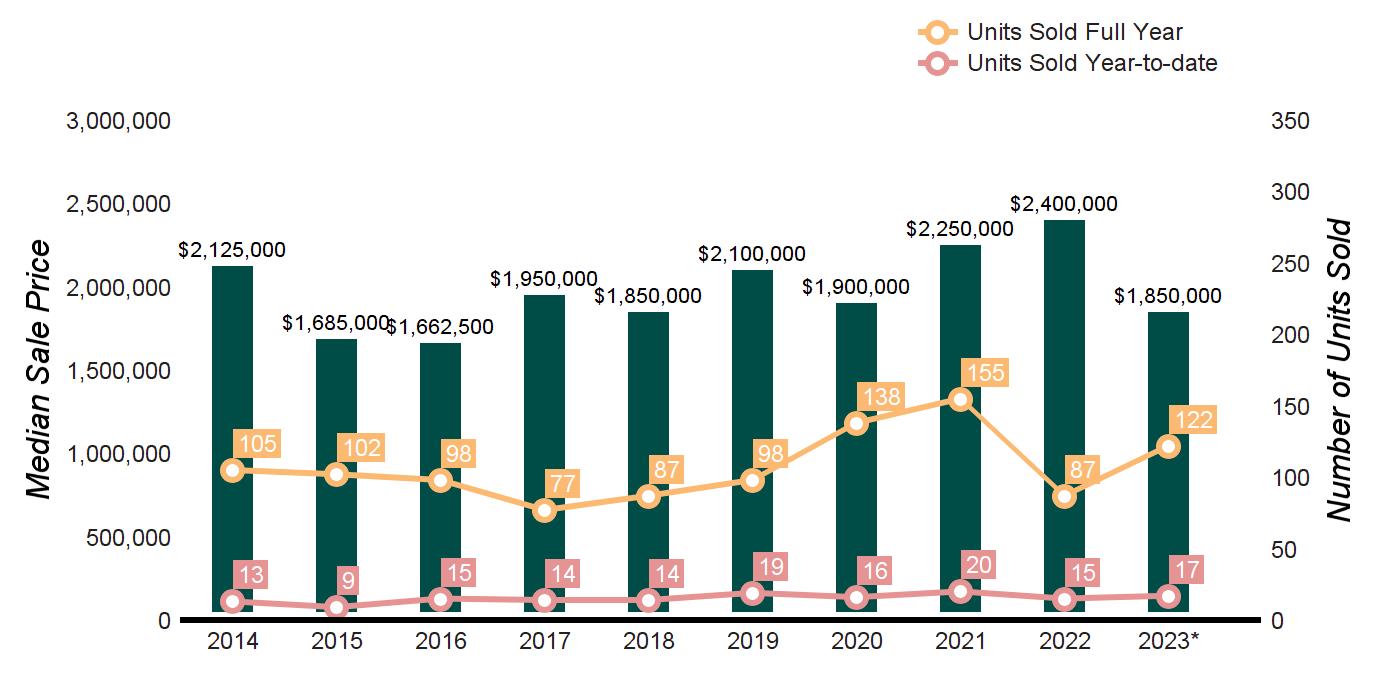
Q1 2023 Q1 2022 % CHANGE FULL YEAR 2022 FULL YEAR 2021 % CHANGE HOMES SOLD 17 15 13.3% 87 155 -43.9% AVERAGE SALE PRICE $1,856,279 $2,702,333 -31.3% $2,731,362 $2,624,038 4.1% MEDIAN SALE PRICE $1,850,000 $1,895,000 -2.4% $2,400,000 $2,250,000 6.7% AVERAGE PRICE PER SQUARE FOOT $716 $811 -11.7% $819 $751 9.1% AVERAGE DAYS ON MARKET 78 65 20.0% 46 58 -20.7% % SALE PRICE TO LIST PRICE 98.0% 100.2% -2.2% 102.3% 99.3% 3.0%
Average Sale Price $2,564,436 $2,017,057 $1,997,289 $2,455,255 $2,166,274 $2,323,307 $2,284,319 $2,624,038 $2,731,362 $1,856,279 Average Sale Price Average Price/SqFt $749 $644 $647 $709 $614 $637 $625 $751 $819 $716 Average Price/SqFt Days On Market 109 147 132 172 159 153 113 58 46 78 Days On Market %Sale Price to List Price 94.1 96.2 96.9 94.7 94.2 93.6 96.3 99.3 102.3 98.0 %Sale Price to List Price
SUPPLY DEMAND ANALYSIS
SOLD PROPERTIES
Greenwich Multiple Listing Service, Single-family homes
OLD GREENWICH
AS OF MARCH 31, 2023 AS OF MARCH 31, 2022 2023 vs. 2022 PRICE RANGE SUPPLY: ACTIVE LISTINGS DEMAND: PENDING SALES SUPPLY/ DEMAND RATIO* SUPPLY: ACTIVE LISTINGS DEMAND: PENDING SALES SUPPLY/ DEMAND RATIO* % CHANGE IN LISTINGS % CHANGE IN PENDINGS $0 - $999,999 0 0 Not Valid 2 2 1 -100.0% -100.0% $1,000,000 - $1,999,999 6 5 1 2 9 1 200.0% -44.4% $2,000,000 - $2,999,999 1 4 1 4 2 2 -75.0% 100.0% $3,000,000 - $3,999,999 1 1 1 1 1 1 0.0% 0.0% $4,000,000 - $4,999,999 1 1 1 1 0 Not Valid 0.0% 0.0% $5,000,000 - $5,999,999 2 0 Not Valid 0 0 Not Valid 0.0% 0.0% $6,000,000 - $7,999,999 0 0 Not Valid 1 0 Not Valid -100.0% 0.0% $8,000,000 - $9,999,999 0 0 Not Valid 0 0 Not Valid 0.0% 0.0% $10,000,000 and up 1 0 Not Valid 0 0 Not Valid 0.0% 0.0% MarketTotals 12 11 1 11 14 1 9.1% -21.4% *Supply Demand Ratio Key 1-4: High Demand 5-6: Balanced 7-9: Low Demand 10+: Very Low Demand
YEAR-TO-DATE YEAR-OVER-YEAR 01/01/202303/31/2023 01/01/202203/31/2022 % CHANGE 2023/2022 04/01/202203/31/2023 04/01/202103/31/2022 % CHANGE 2023/2022 $0 - $999,999 2 1 100.0% 5 4 25.0% $1,000,000 - $1,999,999 7 7 0.0% 31 54 -42.6% $2,000,000 - $2,999,999 6 2 200.0% 31 48 -35.4% $3,000,000 - $3,999,999 2 1 100.0% 11 21 -47.6% $4,000,000 - $4,999,999 0 3 -100.0% 4 11 -63.6% $5,000,000 - $5,999,999 0 0 Not Valid 3 1 200.0% $6,000,000 - $7,999,999 0 1 -100.0% 3 11 -72.7% $8,000,000 - $9,999,999 0 0 Not Valid 0 0 Not Valid $10,000,000 and up 0 0 Not Valid 1 0 Not Valid MarketTotals 17 15 13.3% 89 150 -40.7%
Source:
QUARTERLY MARKET OVERVIEW
GREATER GREENWICH CONDOMINIUMS
TEN-YEAR MARKET HISTORY
* Homes sold for 2023 are annualized based on actual sales year-to-date.
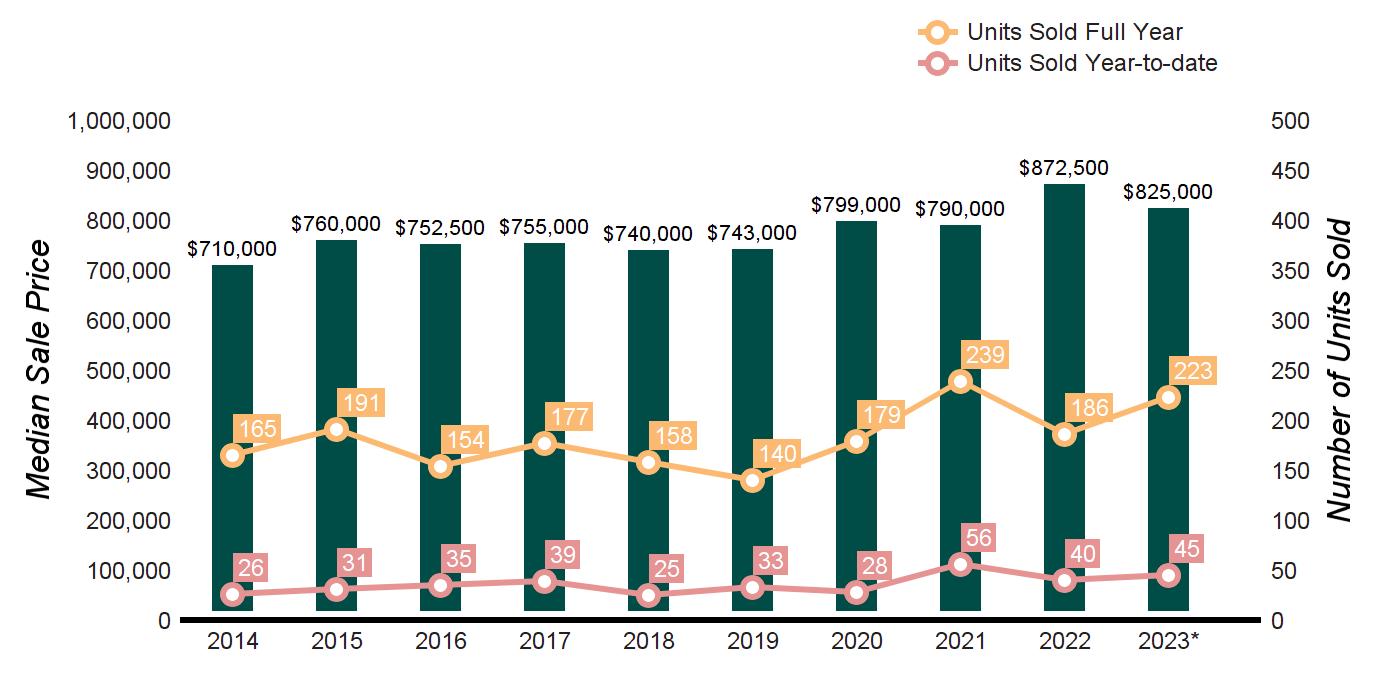
Q1 2023 Q1 2022 % CHANGE FULL YEAR 2022 FULL YEAR 2021 % CHANGE HOMES SOLD 45 40 12.5% 186 239 -22.2% AVERAGE SALE PRICE $1,172,255 $1,169,673 0.2% $1,185,880 $1,088,265 9.0% MEDIAN SALE PRICE $825,000 $781,250 5.6% $872,500 $790,000 10.4% AVERAGE PRICE PER SQUARE FOOT $684 $598 14.4% $625 $548 14.1% AVERAGE DAYS ON MARKET 71 78 -9.0% 60 114 -47.4% % SALE PRICE TO LIST PRICE 100.8% 100.4% 0.4% 101.1% 97.6% 3.6%
Average Sale Price $901,903 $1,028,489 $981,069 $1,030,294 $1,003,349 $959,215 $1,084,790 $1,088,265 $1,185,880 $1,172,255 Average Sale Price Average Price/SqFt $457 $495 $488 $492 $509 $480 $525 $548 $625 $684 Average Price/SqFt Days On Market 154 137 124 130 166 141 147 114 60 71 Days On Market %Sale Price to List Price 95.6 96.2 96.5 95.0 96.0 95.4 95.4 97.6 101.1 100.8 %Sale Price to List Price
GREATER GREENWICH CONDOMINIUMS
AS OF MARCH 31, 2023 AS OF MARCH 31, 2022 2023 vs. 2022 PRICE RANGE SUPPLY: ACTIVE LISTINGS DEMAND: PENDING SALES SUPPLY/ DEMAND RATIO* SUPPLY: ACTIVE LISTINGS DEMAND: PENDING SALES SUPPLY/ DEMAND RATIO* % CHANGE IN LISTINGS % CHANGE IN PENDINGS $0 - $999,999 13 9 1 11 15 1 18.2% -40.0% $1,000,000 - $1,999,999 12 7 2 12 7 2 0.0% 0.0% $2,000,000 - $2,999,999 7 1 7 9 2 5 -22.2% -50.0% $3,000,000 - $3,999,999 6 3 2 4 1 4 50.0% 200.0% $4,000,000 - $4,999,999 0 0 Not Valid 0 2 0 0.0% -100.0% $5,000,000 - $5,999,999 0 0 Not Valid 0 0 Not Valid 0.0% 0.0% $6,000,000 - $7,999,999 0 0 Not Valid 0 0 Not Valid 0.0% 0.0% $8,000,000 - $9,999,999 0 0 Not Valid 0 0 Not Valid 0.0% 0.0% $10,000,000 and up 0 0 Not Valid 0 0 Not Valid 0.0% 0.0% MarketTotals 38 20 2 36 27 1 5.6% -25.9% *Supply Demand Ratio Key 1-4: High Demand 5-6: Balanced 7-9: Low Demand 10+: Very Low Demand SOLD PROPERTIES YEAR-TO-DATE YEAR-OVER-YEAR 01/01/202303/31/2023 01/01/202203/31/2022 % CHANGE 2023/2022 04/01/202203/31/2023 04/01/202103/31/2022 % CHANGE 2023/2022 $0 - $999,999 29 26 11.5% 113 147 -23.1% $1,000,000 - $1,999,999 10 7 42.9% 51 46 10.9% $2,000,000 - $2,999,999 3 4 -25.0% 14 18 -22.2% $3,000,000 - $3,999,999 2 2 0.0% 9 9 0.0% $4,000,000 - $4,999,999 1 1 0.0% 4 3 33.3% $5,000,000 - $5,999,999 0 0 Not Valid 0 0 Not Valid $6,000,000 - $7,999,999 0 0 Not Valid 0 0 Not Valid $8,000,000 - $9,999,999 0 0 Not Valid 0 0 Not Valid $10,000,000 and up 0 0 Not Valid 0 0 Not Valid MarketTotals 45 40 12.5% 191 223 -14.3%
SUPPLY DEMAND ANALYSIS
Source: Greenwich Multiple Listing Service, Condominium
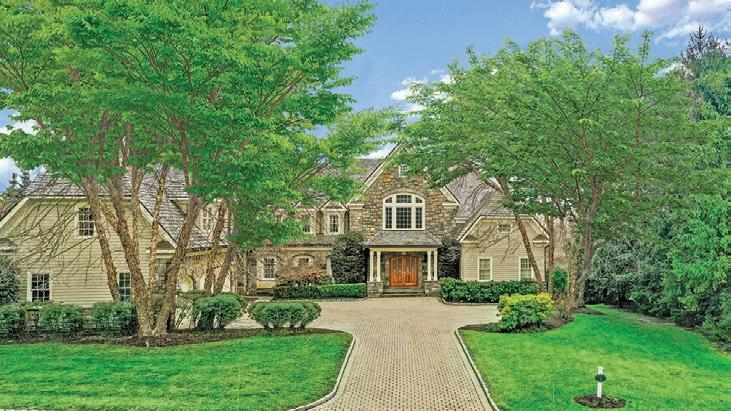
GREENWICH, CT · $12,950,000
Extraordinary custom stone and clapboard home on 2.46 acres with pool and pool cabana.
Ellen Mosher | M 203.705.9680
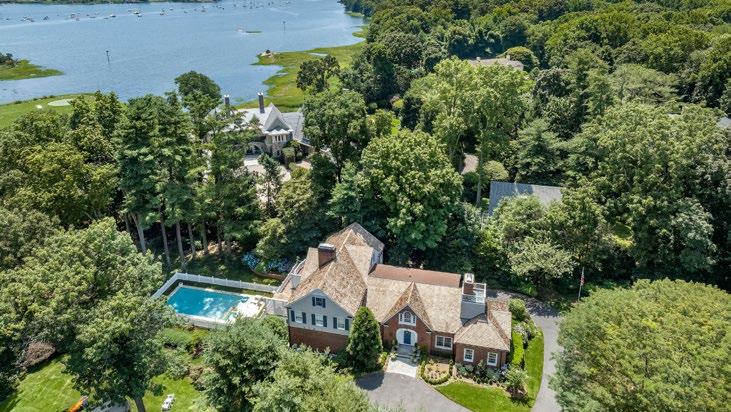
GREENWICH, CT · $6,645,000
Five-bedroom Colonial with pool & water views. Private association close to town.
BK Bates | M 203.536.4997
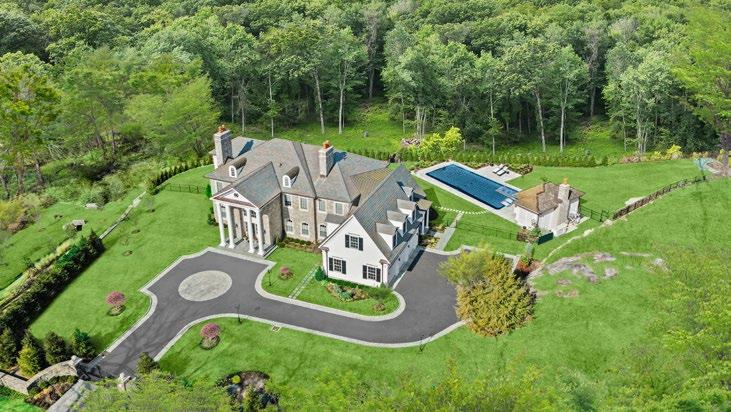
GREENWICH, CT · $6,490,000
Sunlit spectacular new construction. Two acres. Seven bedrooms. Heated pool.
BK Bates | M 203.536.4997
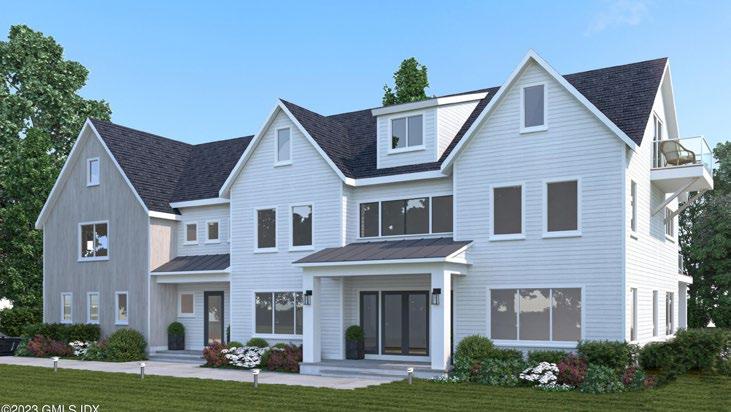
GREENWICH, CT · $4,450,000
Ultra luxurious new construction home with opportunity to customize to make it your own.
Joanne Mancuso | M 203.667.3887
GREENWICH, CT · $3,850,000
Exquisite stone Manor on 1.4 acres bordering conservation land with expansive open views.
Ellen Mosher | M 203.705.9680
GREENWICH, CT · $3,795,000
A 7 bedroom classic on one acre with pool, expansive lawns and babbling brook close to town.
Ellen Mosher | M 203.705.9680
203.869.0700 · 203.698.1234 · HOULIHANLAWRENCE.COM @AROUNDGREENWICH @AROUNDGREENWICH /GREENWICHCTREALESTATE Source: GMLS, 2015, 2016, 2017, 2018, 2019, 2020, 2021, 2022, total dollar volume of single family homes sold by company, Greater Greenwich
8 YEARS IN A ROW
# 1 Brokerage in Greenwich
AREA’S MOST POWERFUL GLOBAL NETWORK Leading Real Estates Companies of the World | Luxury Portfolio International Mayfair International Realty | Board of Regents Luxury Real Estate
