Market Report

Q2-2023
GREENWICH
EXECUTIVE SUMMARY
Houlihan Lawrence is fortunate to operate within the thriving markets north of New York City. The region offers exceptional housing choices, making it accessible to a broad range of buyers. The cultural richness, abundance of parks, proximity to beaches, and recreational opportunities in our counties is unparalleled. As a result, our strong demand for housing over the decades has remained constant, with a few exceptions.
The real estate market in Greenwich faced a continued challenge during the second quarter of 2023 of limited inventory levels. A significant majority of homeowners with mortgages are currently paying below the historical average rate of 6.7%, the highest observed in 20 years. This has thwarted the trade up, trade down activity in all our markets and further exacerbated the already low levels of properties for sale. The limited inventory of homes, including luxury properties, has intensified competition among buyers and led to upward pressure on prices in most areas.
This environment has resulted in a beneficial situation for homeowners who decide to sell, and with mortgage rates currently stabilizing, they are becoming more inclined to make a move. At all price points, sellers are often able to realize top dollar for their properties, when properly priced, and achieve significant returns on their real estate investments.
For eight and half years, Houlihan Lawrence has been the #1 brokerage representing Greenwich, Connecticut. We are grateful for our loyal clients, world-class agents, support team and this incredible community we call home. Thank you.
With Warm Regards,
Liz Nunan President and CEO
Q2-2023
MARKET REPORT
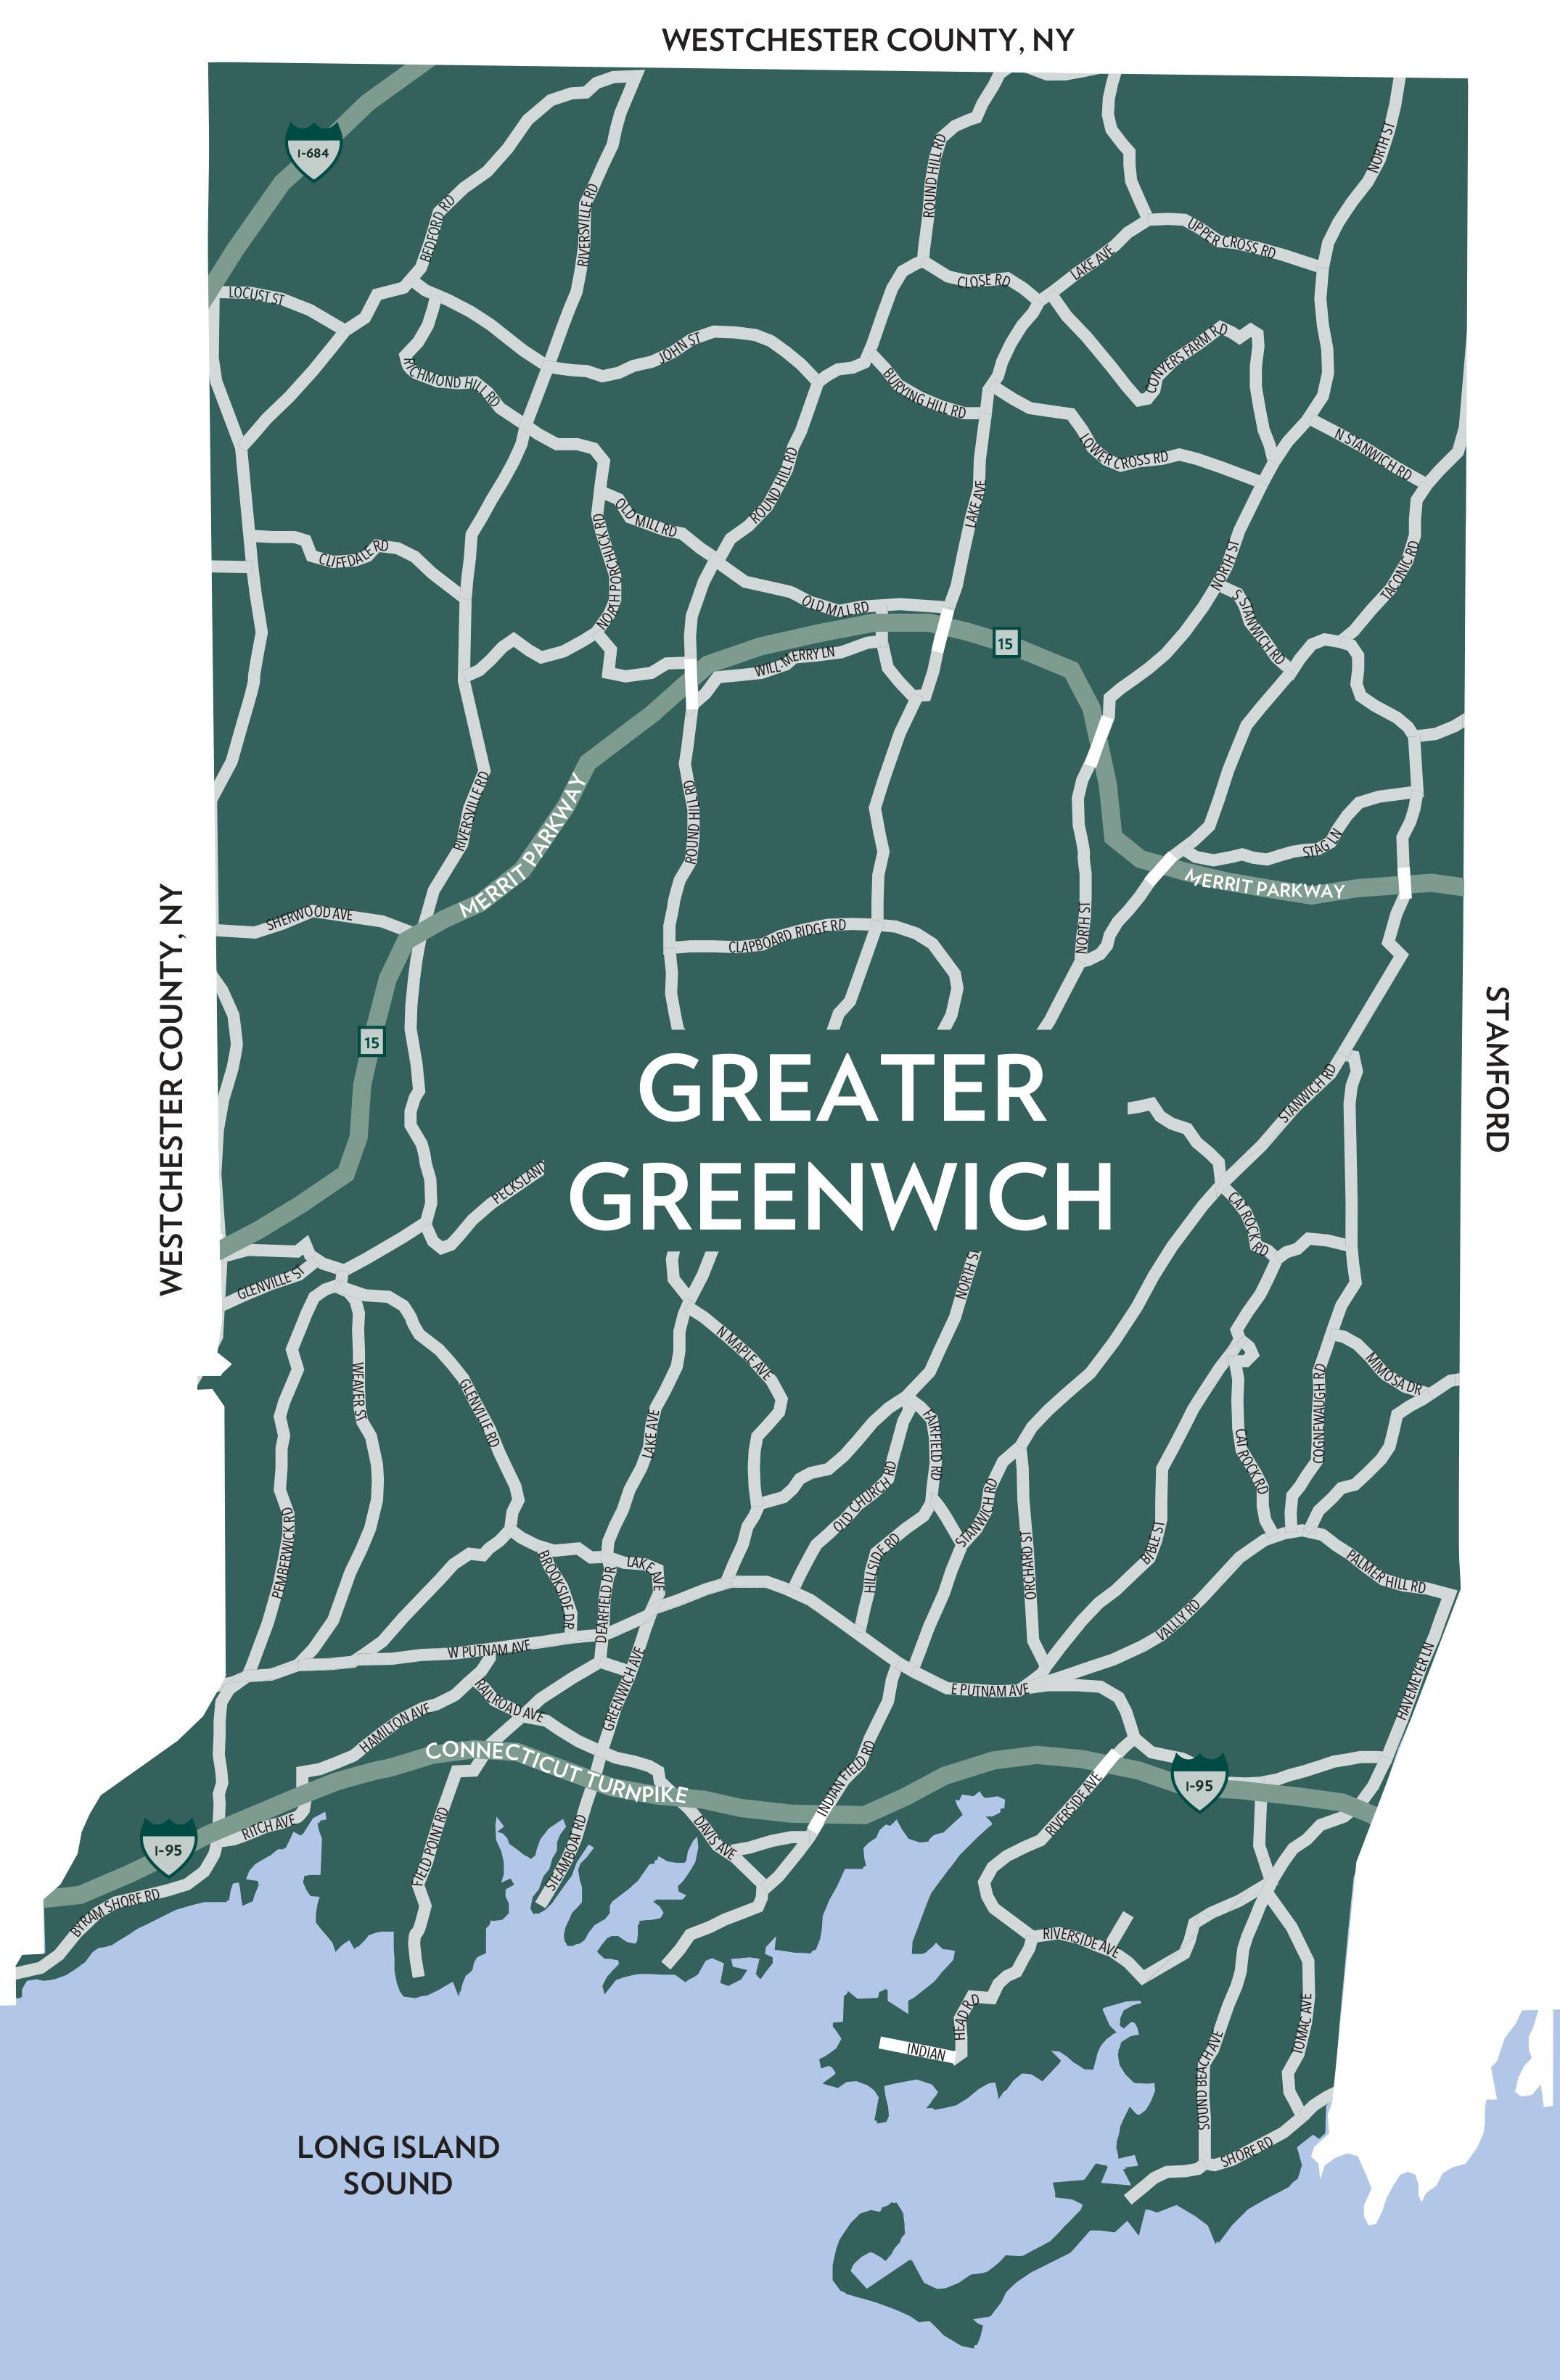
TABLE OF CONTENTS SECOND QUARTER 2023 GREATER GREENWICH SingleFamilyHomeOverview GREENWICH NorthoftheParkway GREENWICH SouthoftheParkway GREENWICH SouthofthePostRoad COS COB RIVERSIDE OLD GREENWICH GREATER GREENWICH CondominiumOverview HOULIHANLAWRENCE.COM
QUARTERLY MARKET OVERVIEW
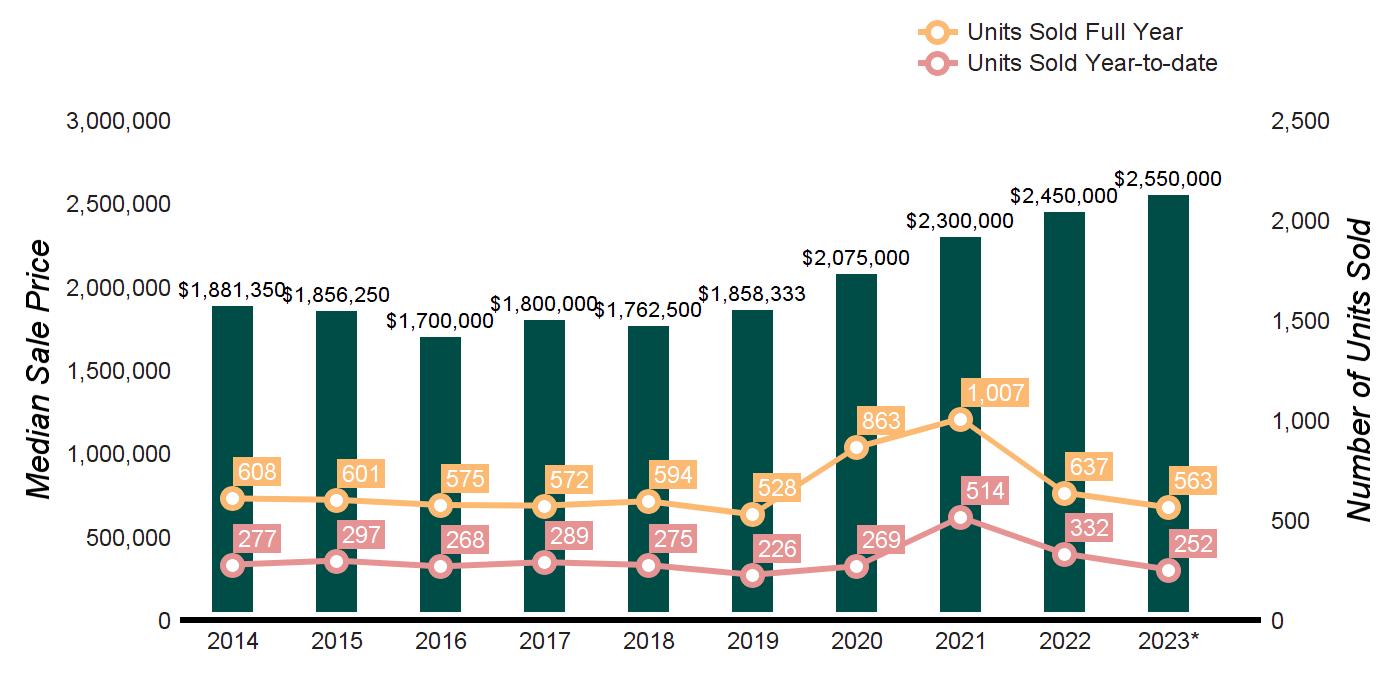
TEN-YEAR MARKET HISTORY
* Homes sold for 2023 are annualized based on actual sales year-to-date.
GREATER GREENWICH
Q2 2023 Q2 2022 % CHANGE YTD 2023 YTD 2022 % CHANGE HOMES SOLD 168 190 -11.6% 252 332 -24.1% AVERAGE SALE PRICE $3,151,325 $3,146,659 0.1% $3,143,596 $3,094,119 1.6% MEDIAN SALE PRICE $2,575,000 $2,534,000 1.6% $2,550,000 $2,525,000 1.0% AVERAGE PRICE PER SQUARE FOOT $709 $710 -0.1% $696 $680 2.4% AVERAGE DAYS ON MARKET 80 72 11.1% 82 92 -10.9% % SALE PRICE TO LIST PRICE 99.2% 100.8% -1.6% 98.5% 99.4% -0.9%
Average Sale Price $2,688,907 $2,421,486 $2,203,756 $2,574,993 $2,393,006 $2,376,330 $2,667,708 $3,005,642 $3,050,065 $3,143,596 Average Sale Price Average Price/SqFt $611 $592 $564 $578 $563 $545 $557 $635 $696 $696 Average Price/SqFt Days On Market 155 161 157 183 179 199 171 109 76 82 Days On Market %Sale Price to List Price 93.7 94.4 94.1 92.5 93.7 92.4 94.4 97.4 99.7 98.5 %Sale Price to List Price
SUPPLY DEMAND ANALYSIS
SOLD PROPERTIES
GREATER GREENWICH
AS OF JUNE 30, 2023 AS OF JUNE 30, 2022 2023 vs. 2022 PRICE RANGE SUPPLY: ACTIVE LISTINGS DEMAND: PENDING SALES SUPPLY/ DEMAND RATIO* SUPPLY: ACTIVE LISTINGS DEMAND: PENDING SALES SUPPLY/ DEMAND RATIO* % CHANGE IN LISTINGS % CHANGE IN PENDINGS $0 - $999,999 12 9 1 12 11 1 0.0% -18.2% $1,000,000 - $1,999,999 17 34 1 43 34 1 -60.5% 0.0% $2,000,000 - $2,999,999 21 24 1 40 33 1 -47.5% -27.3% $3,000,000 - $3,999,999 18 11 2 22 16 1 -18.2% -31.3% $4,000,000 - $4,999,999 18 15 1 22 17 1 -18.2% -11.8% $5,000,000 - $5,999,999 14 7 2 15 11 1 -6.7% -36.4% $6,000,000 - $7,999,999 18 7 3 22 17 1 -18.2% -58.8% $8,000,000 - $9,999,999 6 6 1 8 4 2 -25.0% 50.0% $10,000,000 and up 24 3 8 27 1 27 -11.1% 200.0% MarketTotals 148 116 1 211 144 1 -29.9% -19.4% *Supply Demand Ratio Key 1-4: High Demand 5-6: Balanced 7-9: Low Demand 10+: Very Low Demand
YEAR-TO-DATE YEAR-OVER-YEAR 01/01/202306/30/2023 01/01/202206/30/2022 % CHANGE 2023/2022 07/01/202206/30/2023 07/01/202106/30/2022 % CHANGE 2023/2022 $0 - $999,999 26 39 -33.3% 49 91 -46.2% $1,000,000 - $1,999,999 69 89 -22.5% 163 231 -29.4% $2,000,000 - $2,999,999 54 70 -22.9% 133 199 -33.2% $3,000,000 - $3,999,999 34 43 -20.9% 72 112 -35.7% $4,000,000 - $4,999,999 31 44 -29.5% 50 81 -38.3% $5,000,000 - $5,999,999 13 18 -27.8% 37 38 -2.6% $6,000,000 - $7,999,999 14 16 -12.5% 33 42 -21.4% $8,000,000 - $9,999,999 6 7 -14.3% 12 17 -29.4% $10,000,000 and up 5 6 -16.7% 8 14 -42.9% MarketTotals 252 332 -24.1% 557 825 -32.5%
Source: Greenwich Multiple Listing Service, Single-family homes
QUARTERLY MARKET OVERVIEW
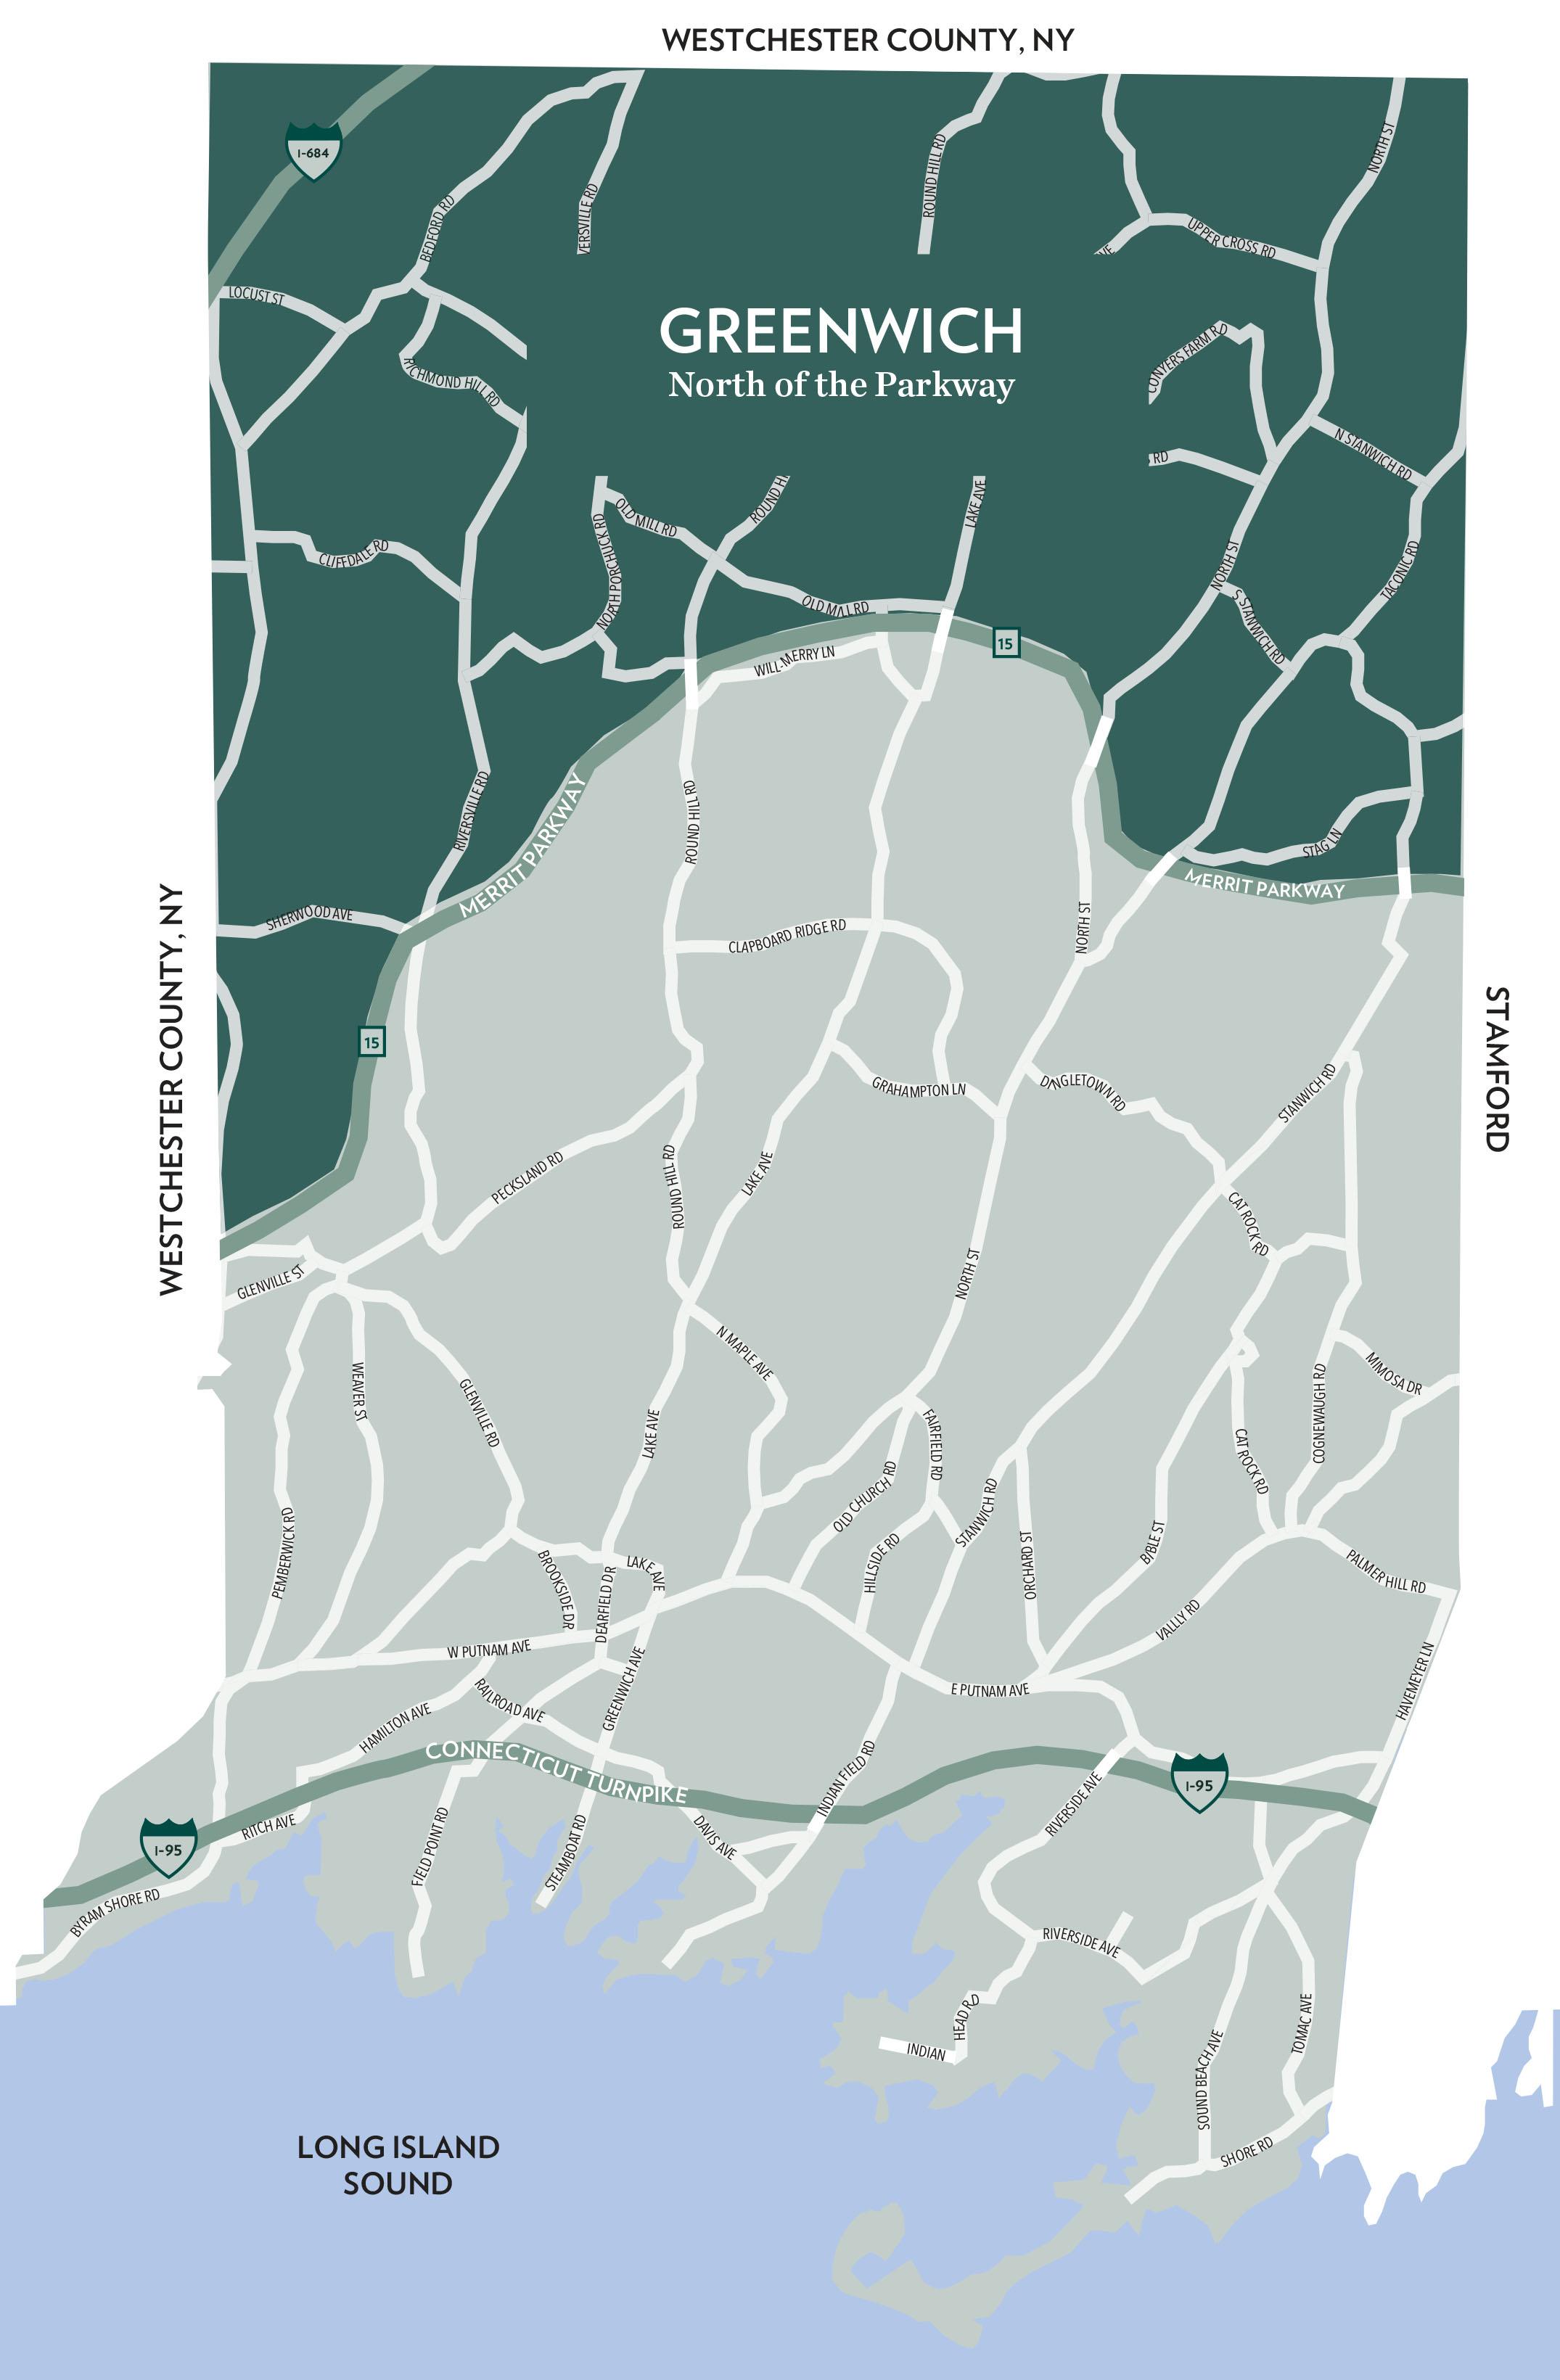
NORTH OF THE PARKWAY
TEN-YEAR MARKET HISTORY
* Homes sold for 2023 are annualized based on actual sales year-to-date.
GREENWICH
Q2 2023 Q2 2022 % CHANGE YTD 2023 YTD 2022 % CHANGE HOMES SOLD 22 16 37.5% 35 38 -7.9% AVERAGE SALE PRICE $4,548,840 $4,088,395 11.3% $4,774,832 $3,550,837 34.5% MEDIAN SALE PRICE $3,622,750 $2,682,500 35.1% $4,100,000 $2,900,000 41.4% AVERAGE PRICE PER SQUARE FOOT $631 $643 -1.9% $631 $589 7.1% AVERAGE DAYS ON MARKET 211 73 189.0% 180 108 66.7% % SALE PRICE TO LIST PRICE 93.8% 96.6% -2.9% 94.2% 96.3% -2.2%
Average Sale Price $4,136,921 $2,834,463 $2,939,222 $3,590,745 $3,264,086 $3,156,247 $2,851,219 $3,919,488 $3,494,702 $4,774,832 Average Sale Price Average Price/SqFt $559 $524 $470 $501 $495 $503 $455 $553 $596 $631 Average Price/SqFt Days On Market 321 250 237 310 210 251 231 167 102 180 Days On Market %Sale Price to List Price 90.5 92.7 91.8 85.7 91.9 90.1 94.2 96.5 97.3 94.2 %Sale Price to List Price
SUPPLY DEMAND ANALYSIS
NORTH OF THE PARKWAY
GREENWICH
AS OF JUNE 30, 2023 AS OF JUNE 30, 2022 2023 vs. 2022 PRICE RANGE SUPPLY: ACTIVE LISTINGS DEMAND: PENDING SALES SUPPLY/ DEMAND RATIO* SUPPLY: ACTIVE LISTINGS DEMAND: PENDING SALES SUPPLY/ DEMAND RATIO* % CHANGE IN LISTINGS % CHANGE IN PENDINGS $0 - $999,999 0 1 0 0 1 0 0.0% 0.0% $1,000,000 - $1,999,999 2 1 2 8 4 2 -75.0% -75.0% $2,000,000 - $2,999,999 3 1 3 11 4 3 -72.7% -75.0% $3,000,000 - $3,999,999 2 1 2 7 2 4 -71.4% -50.0% $4,000,000 - $4,999,999 4 0 Not Valid 10 1 10 -60.0% -100.0% $5,000,000 - $5,999,999 5 1 5 2 2 1 150.0% -50.0% $6,000,000 - $7,999,999 5 0 Not Valid 8 4 2 -37.5% -100.0% $8,000,000 - $9,999,999 3 1 3 4 1 4 -25.0% 0.0% $10,000,000 and up 5 1 5 9 0 Not Valid -44.4% 0.0% MarketTotals 29 7 4 59 19 3 -50.8% -63.2% *Supply Demand Ratio Key 1-4: High Demand 5-6: Balanced 7-9: Low Demand 10+: Very Low Demand
YEAR-TO-DATE YEAR-OVER-YEAR 01/01/202306/30/2023 01/01/202206/30/2022 % CHANGE 2023/2022 07/01/202206/30/2023 07/01/202106/30/2022 % CHANGE 2023/2022 $0 - $999,999 0 1 -100.0% 0 5 -100.0% $1,000,000 - $1,999,999 6 10 -40.0% 14 13 7.7% $2,000,000 - $2,999,999 5 10 -50.0% 17 22 -22.7% $3,000,000 - $3,999,999 6 5 20.0% 15 15 0.0% $4,000,000 - $4,999,999 7 6 16.7% 8 10 -20.0% $5,000,000 - $5,999,999 2 1 100.0% 5 6 -16.7% $6,000,000 - $7,999,999 4 4 0.0% 8 6 33.3% $8,000,000 - $9,999,999 3 0 Not Valid 4 3 33.3% $10,000,000 and up 2 1 100.0% 2 2 0.0% MarketTotals 35 38 -7.9% 73 82 -11.0%
SOLD PROPERTIES
Source: Greenwich Multiple Listing Service, Single-family homes
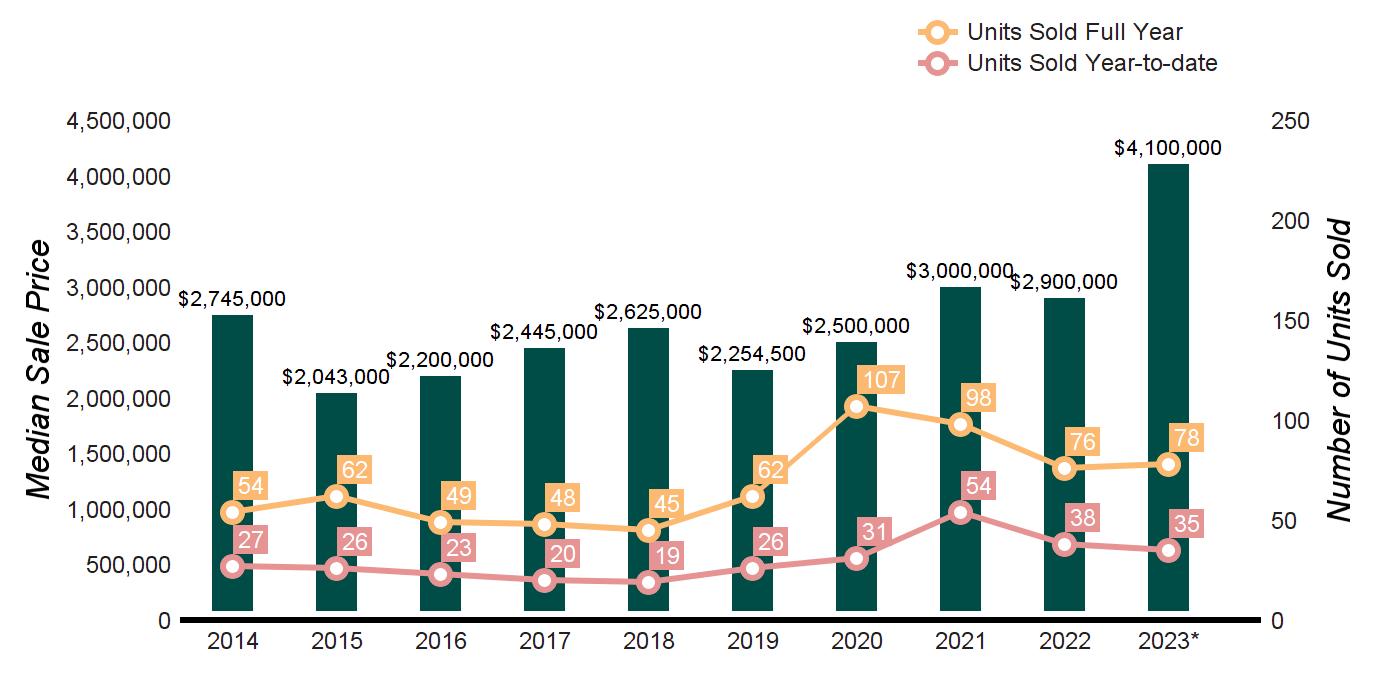
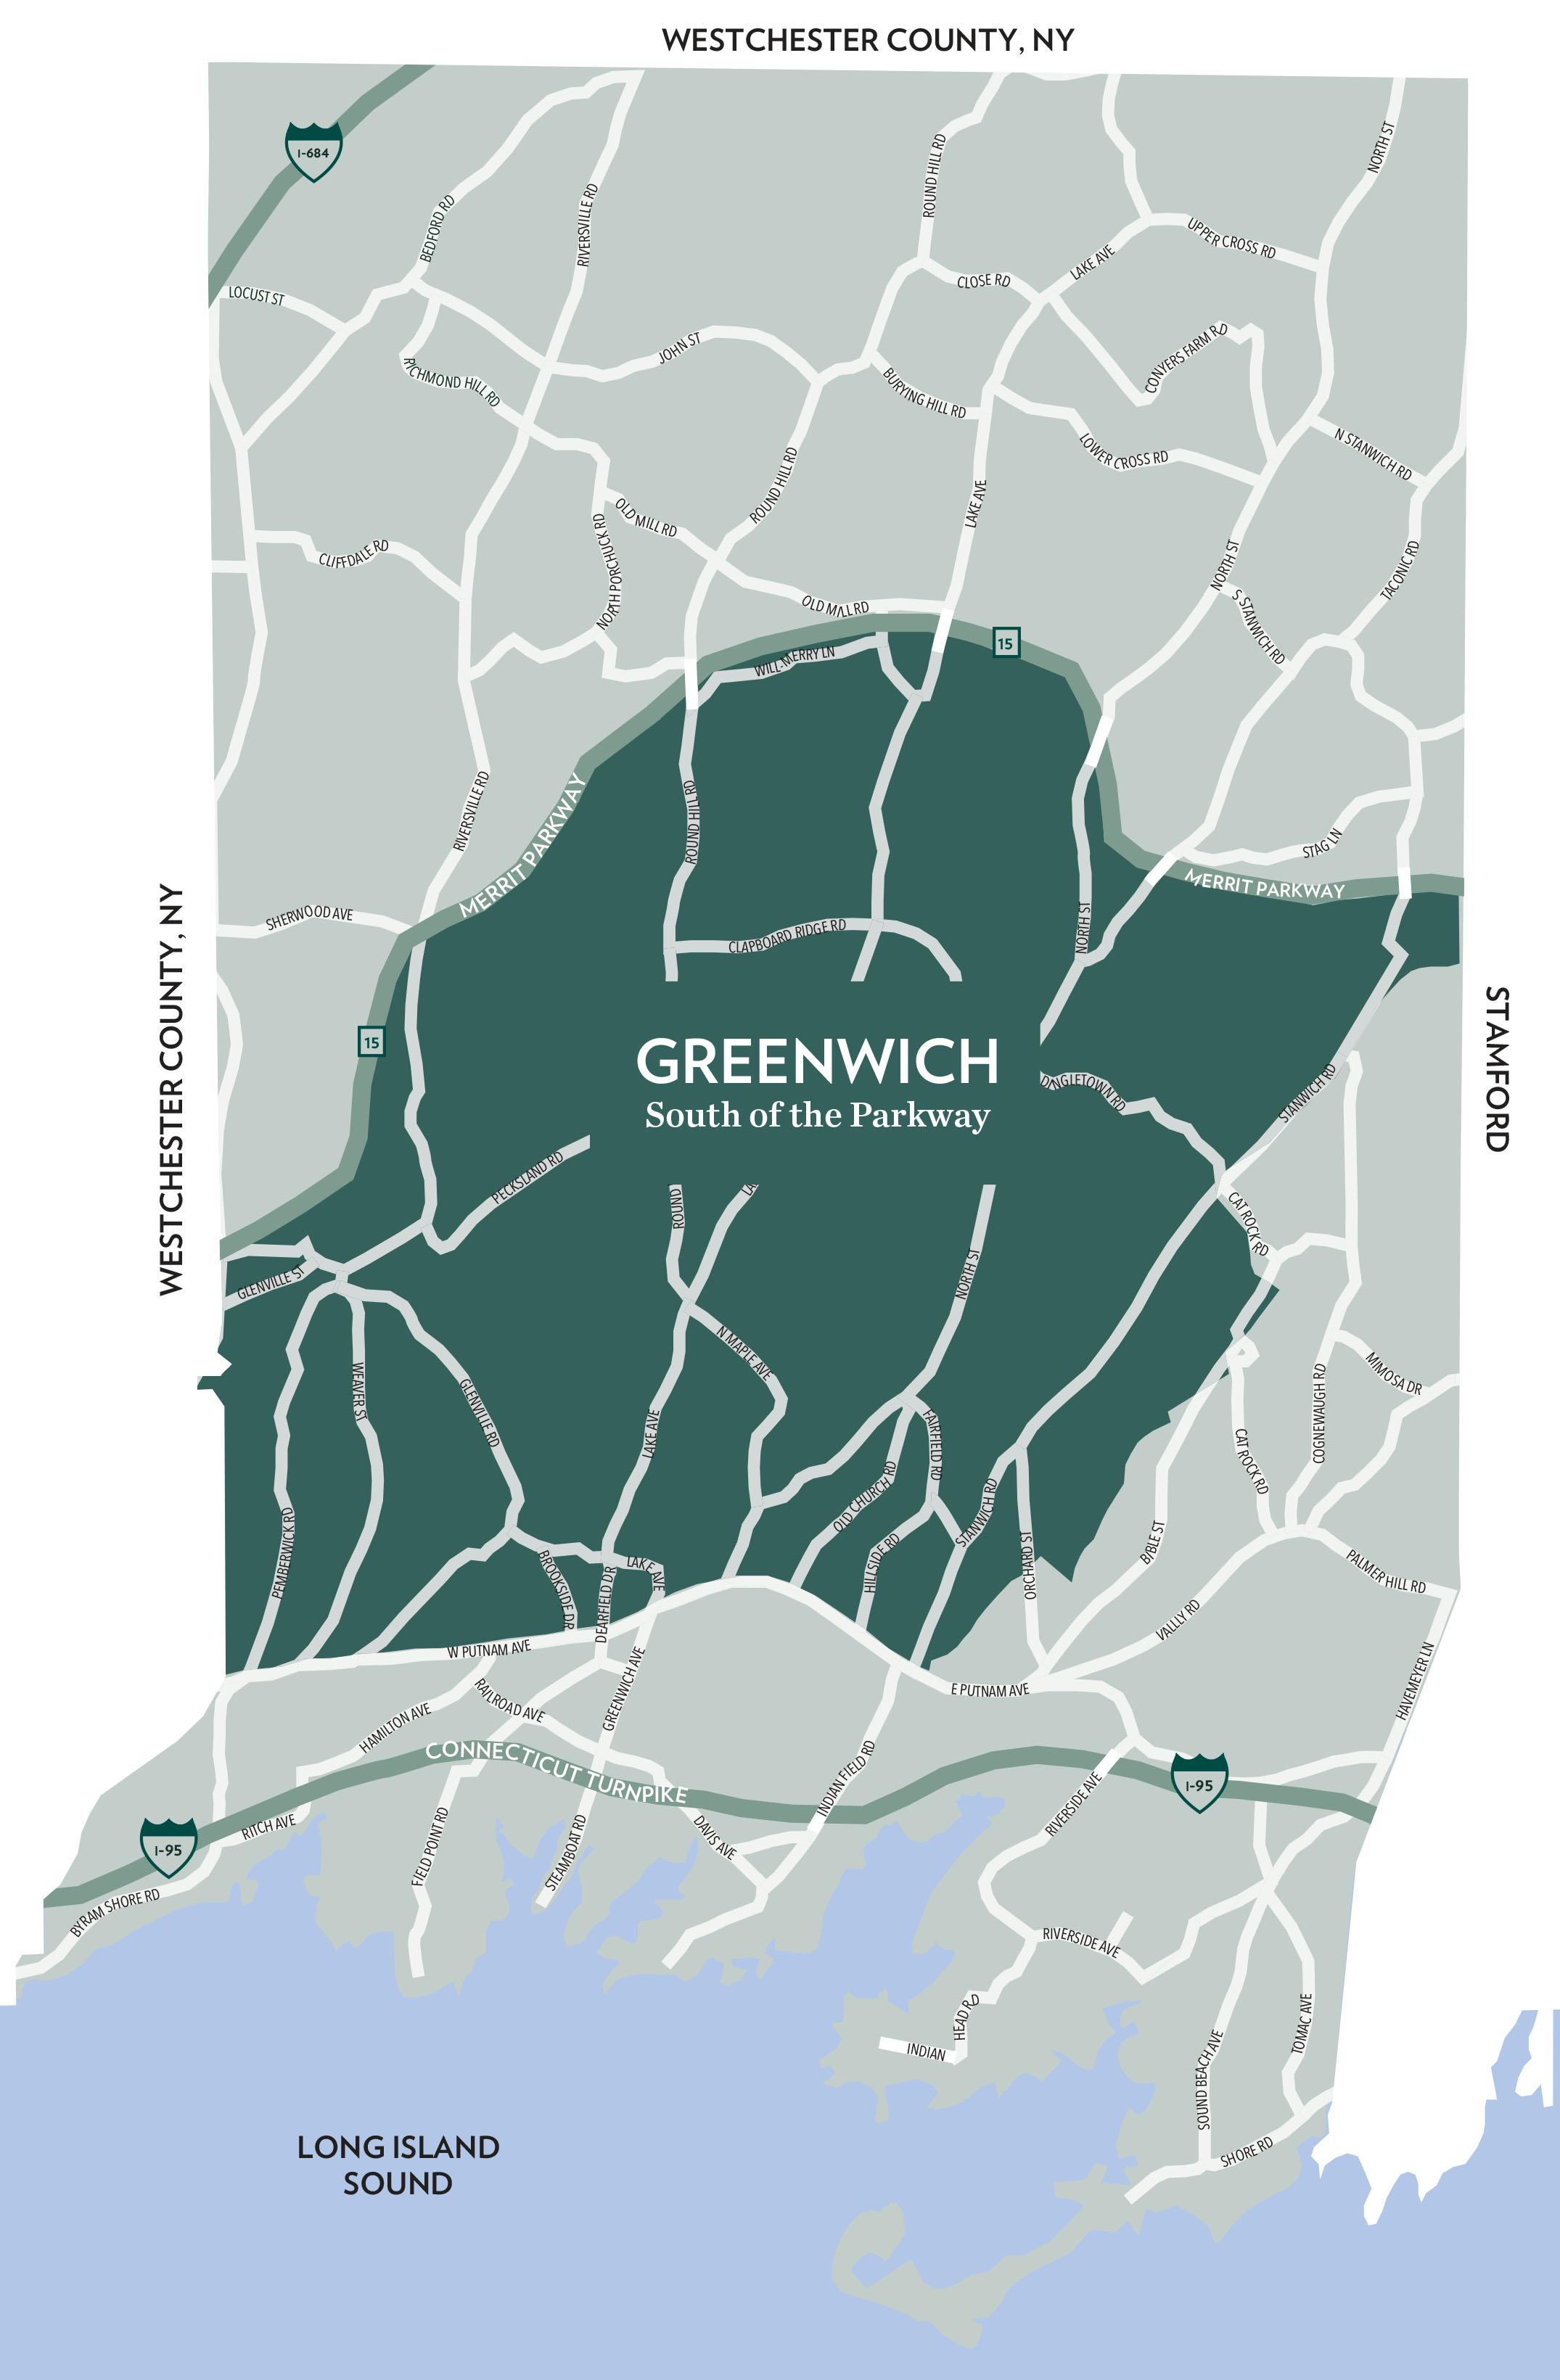
QUARTERLY MARKET OVERVIEW
SOUTH OF THE PARKWAY
TEN-YEAR MARKET HISTORY
* Homes sold for 2023 are annualized based on actual sales year-to-date.
GREENWICH
Q2 2023 Q2 2022 % CHANGE YTD 2023 YTD 2022 % CHANGE HOMES SOLD 61 67 -9.0% 91 123 -26.0% AVERAGE SALE PRICE $4,045,288 $3,888,496 4.0% $3,842,426 $3,747,287 2.5% MEDIAN SALE PRICE $3,675,000 $3,575,000 2.8% $3,377,500 $3,250,000 3.9% AVERAGE PRICE PER SQUARE FOOT $687 $687 0.0% $664 $661 0.5% AVERAGE DAYS ON MARKET 77 91 -15.4% 76 114 -33.3% % SALE PRICE TO LIST PRICE 98.6% 99.9% -1.3% 98.0% 98.5% -0.5%
Average Sale Price $2,698,854 $3,075,190 $2,403,016 $2,769,791 $2,670,378 $2,537,605 $2,941,272 $3,212,533 $3,634,903 $3,842,426 Average Sale Price Average Price/SqFt $567 $587 $535 $550 $537 $499 $530 $596 $674 $664 Average Price/SqFt Days On Market 171 167 176 203 188 234 197 126 94 76 Days On Market %Sale Price to List Price 93.8 93.7 94.0 93.0 92.8 91.9 94.9 97.0 98.9 98.0 %Sale Price to List Price
SUPPLY DEMAND ANALYSIS
SOUTH OF THE PARKWAY
GREENWICH
AS OF JUNE 30, 2023 AS OF JUNE 30, 2022 2023 vs. 2022 PRICE RANGE SUPPLY: ACTIVE LISTINGS DEMAND: PENDING SALES SUPPLY/ DEMAND RATIO* SUPPLY: ACTIVE LISTINGS DEMAND: PENDING SALES SUPPLY/ DEMAND RATIO* % CHANGE IN LISTINGS % CHANGE IN PENDINGS $0 - $999,999 3 3 1 6 5 1 -50.0% -40.0% $1,000,000 - $1,999,999 6 12 1 13 5 3 -53.8% 140.0% $2,000,000 - $2,999,999 6 8 1 10 11 1 -40.0% -27.3% $3,000,000 - $3,999,999 8 2 4 8 5 2 0.0% -60.0% $4,000,000 - $4,999,999 9 10 1 7 8 1 28.6% 25.0% $5,000,000 - $5,999,999 8 4 2 9 6 2 -11.1% -33.3% $6,000,000 - $7,999,999 10 5 2 7 12 1 42.9% -58.3% $8,000,000 - $9,999,999 3 5 1 4 3 1 -25.0% 66.7% $10,000,000 and up 8 1 8 9 1 9 -11.1% 0.0% MarketTotals 61 50 1 73 56 1 -16.4% -10.7% *Supply Demand Ratio Key 1-4: High Demand 5-6: Balanced 7-9: Low Demand 10+: Very Low Demand SOLD PROPERTIES YEAR-TO-DATE YEAR-OVER-YEAR 01/01/202306/30/2023 01/01/202206/30/2022 % CHANGE 2023/2022 07/01/202206/30/2023 07/01/202106/30/2022 % CHANGE 2023/2022 $0 - $999,999 8 12 -33.3% 21 37 -43.2% $1,000,000 - $1,999,999 13 18 -27.8% 34 59 -42.4% $2,000,000 - $2,999,999 18 25 -28.0% 40 69 -42.0% $3,000,000 - $3,999,999 15 21 -28.6% 28 45 -37.8% $4,000,000 - $4,999,999 16 19 -15.8% 24 34 -29.4% $5,000,000 - $5,999,999 7 12 -41.7% 16 19 -15.8% $6,000,000 - $7,999,999 9 7 28.6% 19 20 -5.0% $8,000,000 - $9,999,999 2 6 -66.7% 6 12 -50.0% $10,000,000 and up 3 3 0.0% 6 5 20.0% MarketTotals 91 123 -26.0% 194 300 -35.3%
Source: Greenwich Multiple Listing Service, Single-family homes
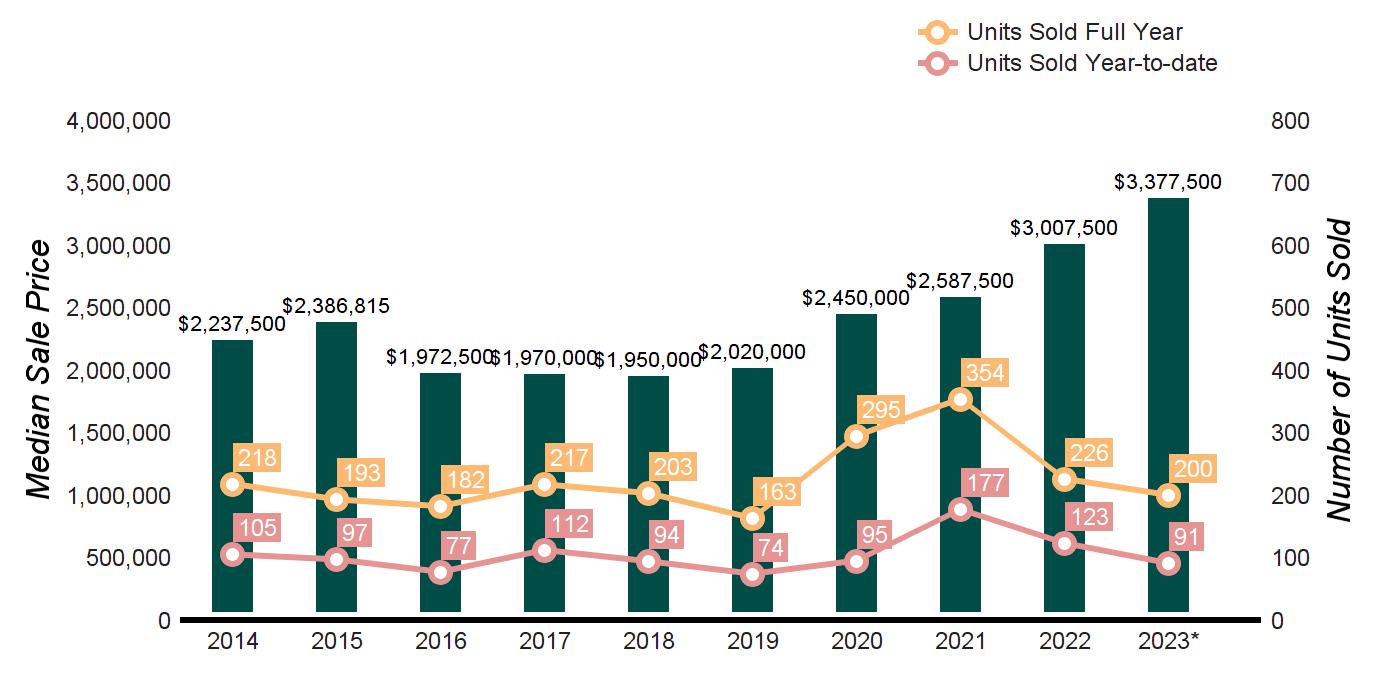
QUARTERLY MARKET OVERVIEW
GREENWICH
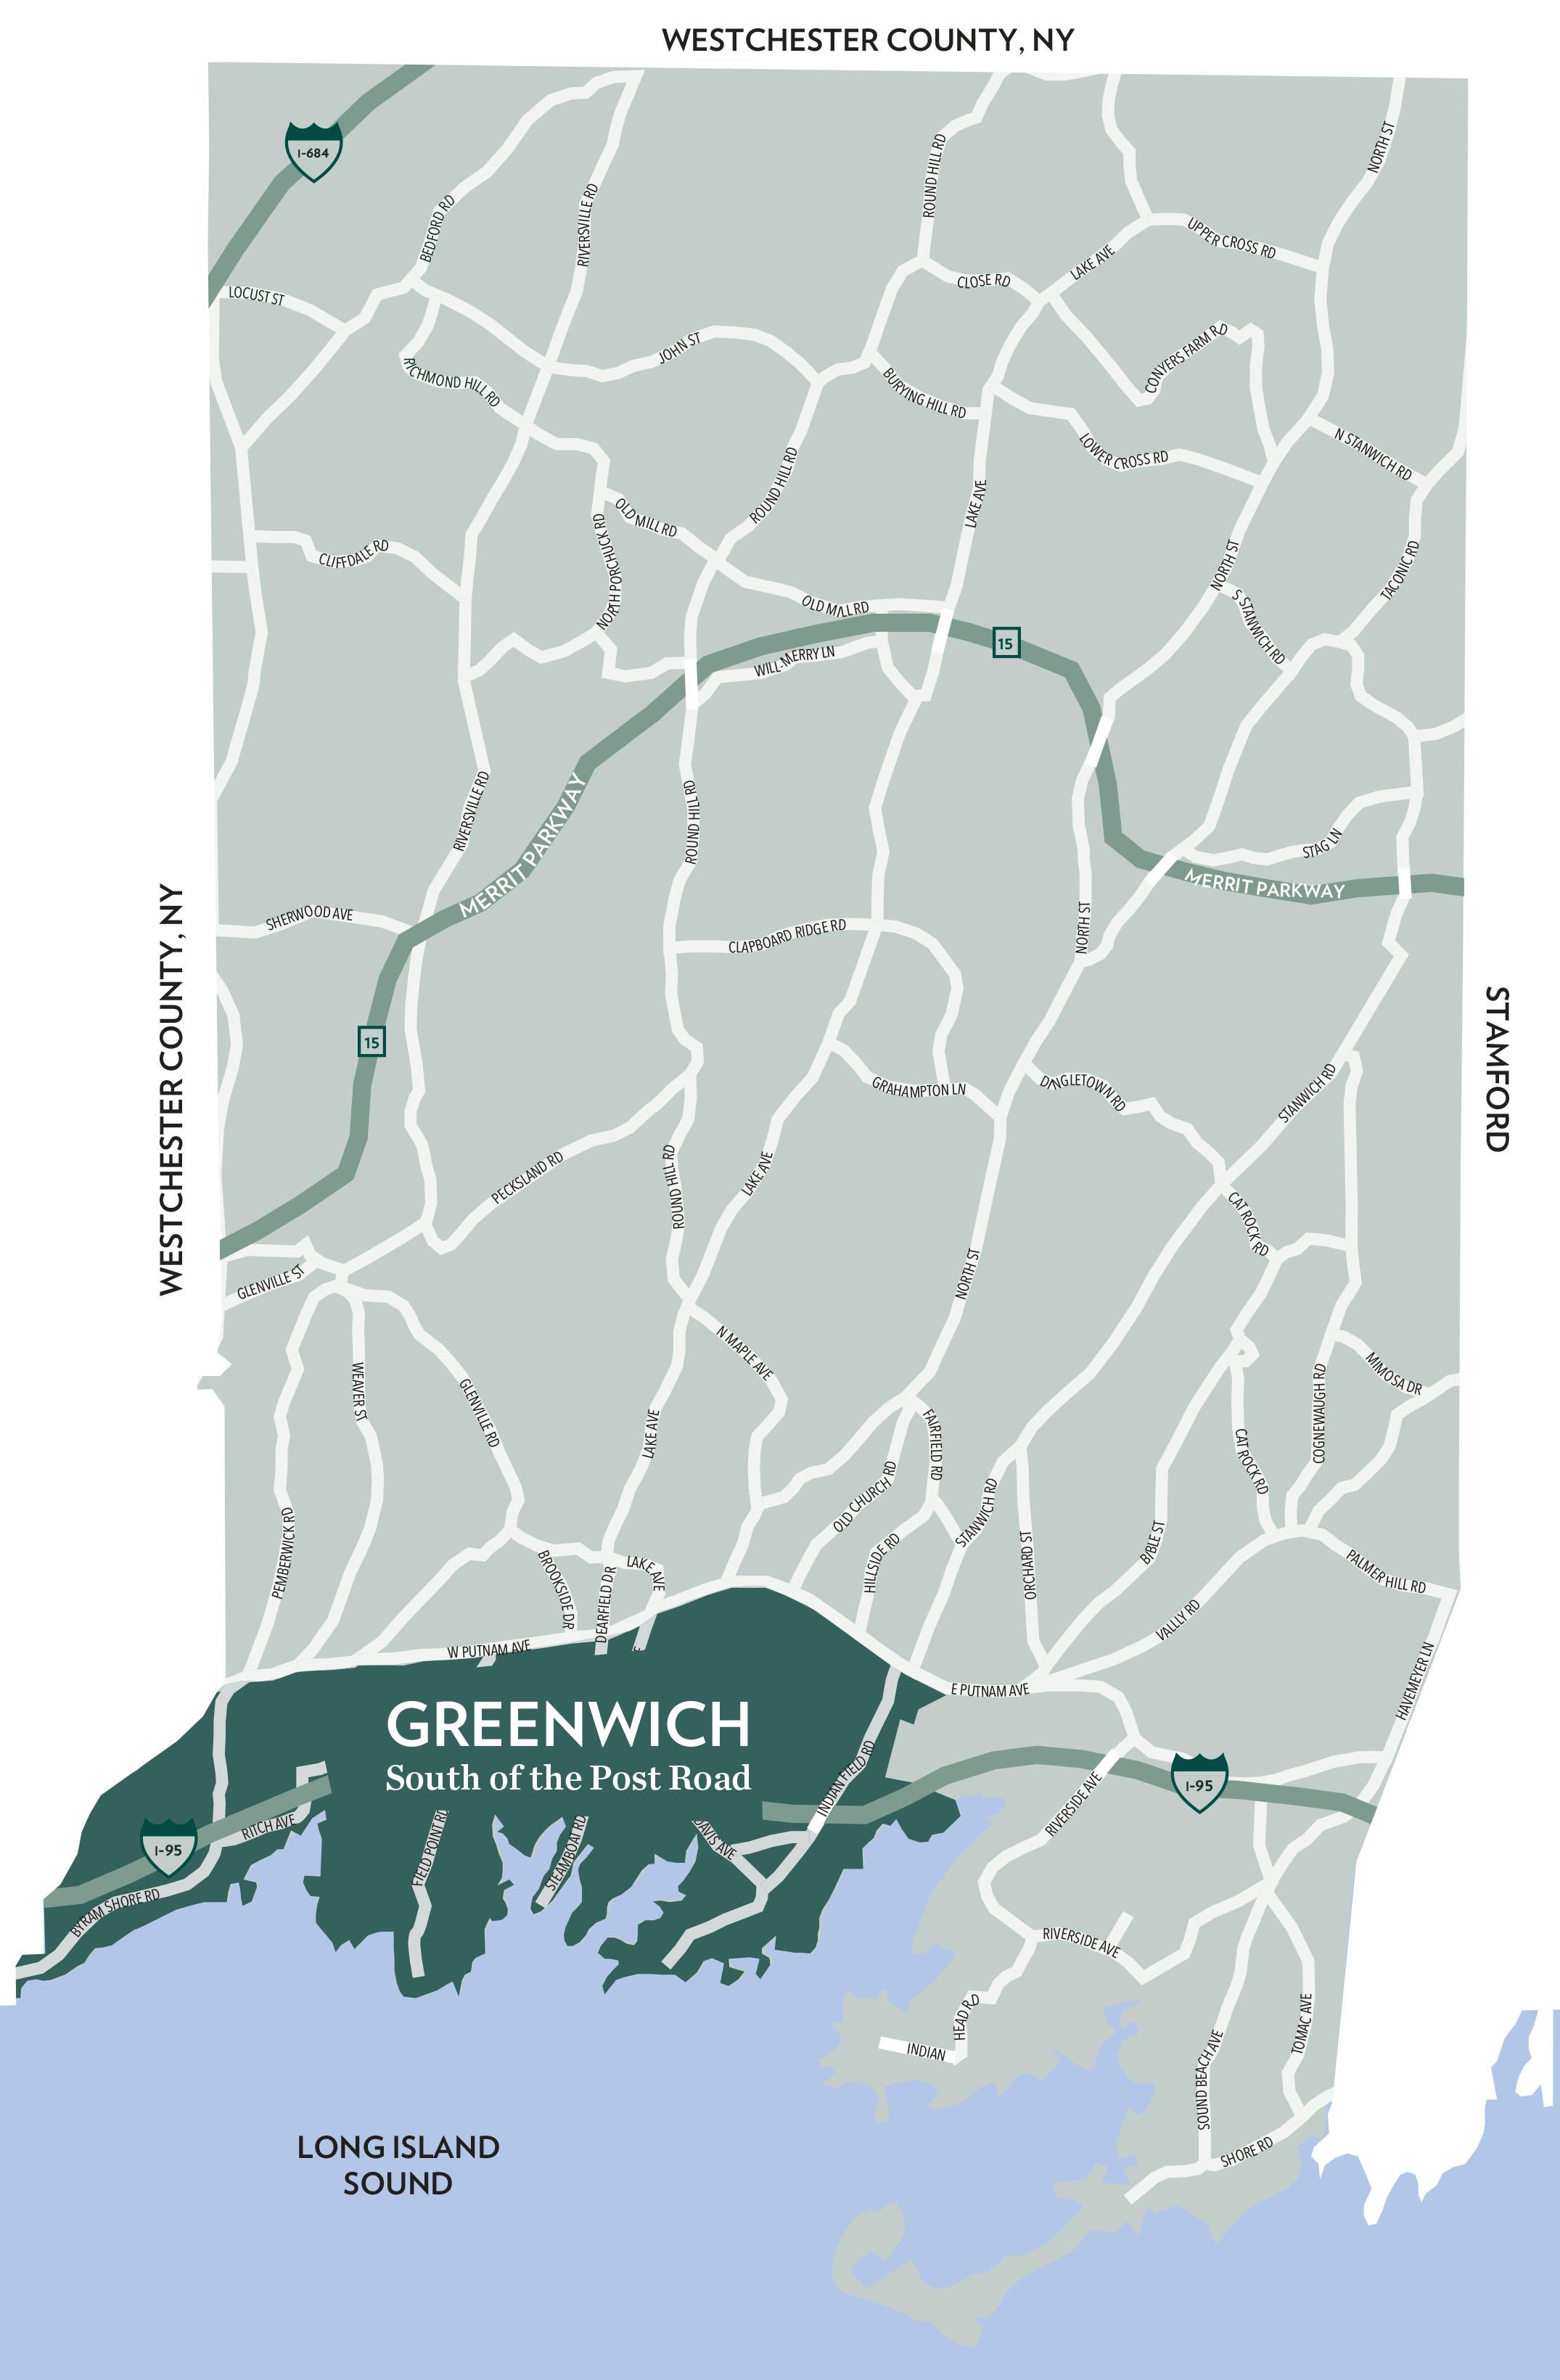
SOUTH OF THE POST ROAD
TEN-YEAR MARKET HISTORY
* Homes sold for 2023 are annualized based on actual sales year-to-date.
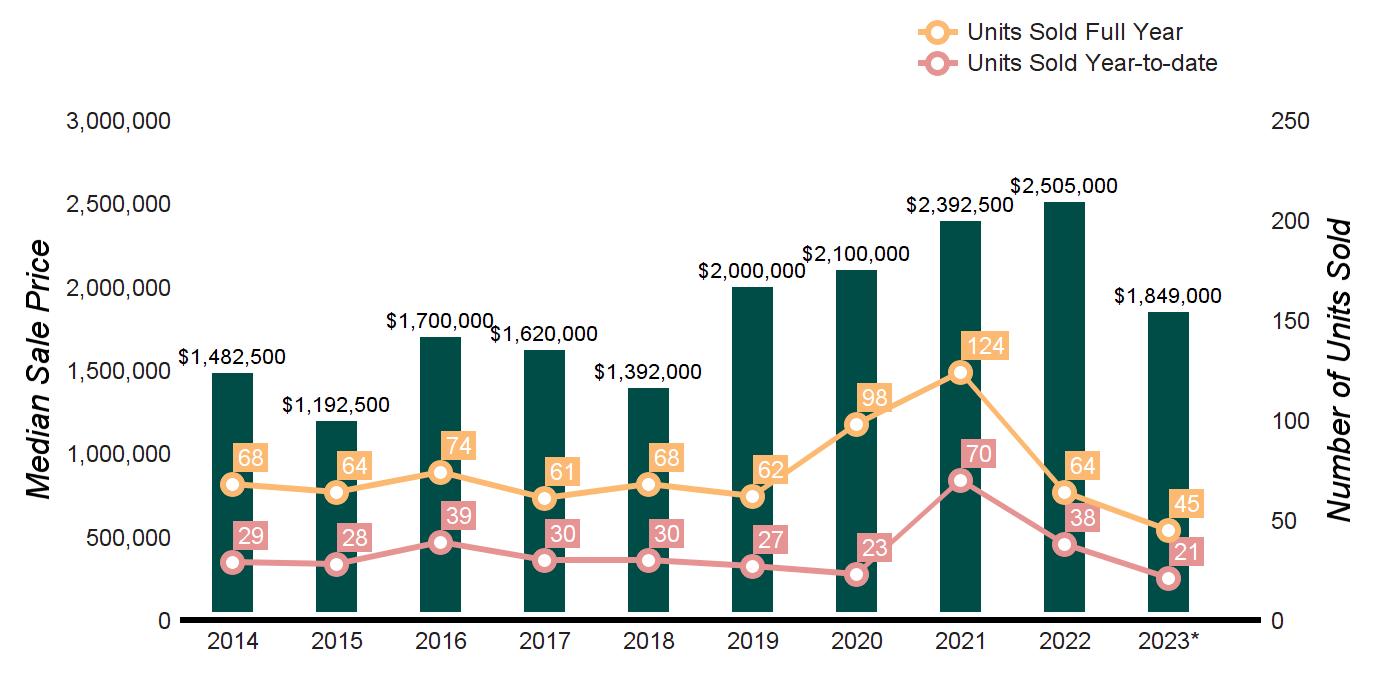
Q2 2023 Q2 2022 % CHANGE YTD 2023 YTD 2022 % CHANGE HOMES SOLD 15 21 -28.6% 21 38 -44.7% AVERAGE SALE PRICE $2,139,766 $2,663,761 -19.7% $2,467,642 $2,992,394 -17.5% MEDIAN SALE PRICE $1,690,000 $2,050,000 -17.6% $1,849,000 $2,210,000 -16.3% AVERAGE PRICE PER SQUARE FOOT $911 $684 33.2% $916 $689 32.9% AVERAGE DAYS ON MARKET 34 74 -54.1% 66 115 -42.6% % SALE PRICE TO LIST PRICE 104.6% 103.2% 1.4% 101.7% 100.1% 1.6%
Average Sale Price $4,083,817 $2,043,325 $2,545,622 $2,977,955 $2,371,594 $2,896,440 $3,458,830 $3,926,817 $3,288,974 $2,467,642 Average Sale Price Average Price/SqFt $726 $598 $623 $639 $666 $667 $676 $712 $752 $916 Average Price/SqFt Days On Market 165 172 133 141 208 211 181 137 85 66 Days On Market %Sale Price to List Price 93.4 96.2 92.3 91.5 94.5 92.6 91.1 95.6 99.6 101.7 %Sale Price to List Price
SUPPLY DEMAND ANALYSIS
SOUTH OF THE POST ROAD
GREENWICH
AS OF JUNE 30, 2023 AS OF JUNE 30, 2022 2023 vs. 2022 PRICE RANGE SUPPLY: ACTIVE LISTINGS DEMAND: PENDING SALES SUPPLY/ DEMAND RATIO* SUPPLY: ACTIVE LISTINGS DEMAND: PENDING SALES SUPPLY/ DEMAND RATIO* % CHANGE IN LISTINGS % CHANGE IN PENDINGS $0 - $999,999 4 4 1 3 2 2 33.3% 100.0% $1,000,000 - $1,999,999 0 5 0 2 2 1 -100.0% 150.0% $2,000,000 - $2,999,999 2 2 1 2 1 2 0.0% 100.0% $3,000,000 - $3,999,999 2 1 2 3 1 3 -33.3% 0.0% $4,000,000 - $4,999,999 0 1 0 2 3 1 -100.0% -66.7% $5,000,000 - $5,999,999 0 0 Not Valid 1 1 1 -100.0% -100.0% $6,000,000 - $7,999,999 2 1 2 6 1 6 -66.7% 0.0% $8,000,000 - $9,999,999 0 0 Not Valid 0 0 Not Valid 0.0% 0.0% $10,000,000 and up 8 0 Not Valid 6 0 Not Valid 33.3% 0.0% MarketTotals 18 14 1 25 11 2 -28.0% 27.3% *Supply Demand Ratio Key 1-4: High Demand 5-6: Balanced 7-9: Low Demand 10+: Very Low Demand SOLD PROPERTIES YEAR-TO-DATE YEAR-OVER-YEAR 01/01/202306/30/2023 01/01/202206/30/2022 % CHANGE 2023/2022 07/01/202206/30/2023 07/01/202106/30/2022 % CHANGE 2023/2022 $0 - $999,999 8 8 0.0% 11 13 -15.4% $1,000,000 - $1,999,999 3 7 -57.1% 10 23 -56.5% $2,000,000 - $2,999,999 3 6 -50.0% 6 17 -64.7% $3,000,000 - $3,999,999 2 4 -50.0% 2 10 -80.0% $4,000,000 - $4,999,999 3 7 -57.1% 5 12 -58.3% $5,000,000 - $5,999,999 1 4 -75.0% 8 7 14.3% $6,000,000 - $7,999,999 0 1 -100.0% 3 3 0.0% $8,000,000 - $9,999,999 1 0 Not Valid 2 1 100.0% $10,000,000 and up 0 1 -100.0% 0 6 -100.0% MarketTotals 21 38 -44.7% 47 92 -48.9%
Source: Greenwich Multiple Listing Service, Single-family homes
QUARTERLY MARKET OVERVIEW
COS COB
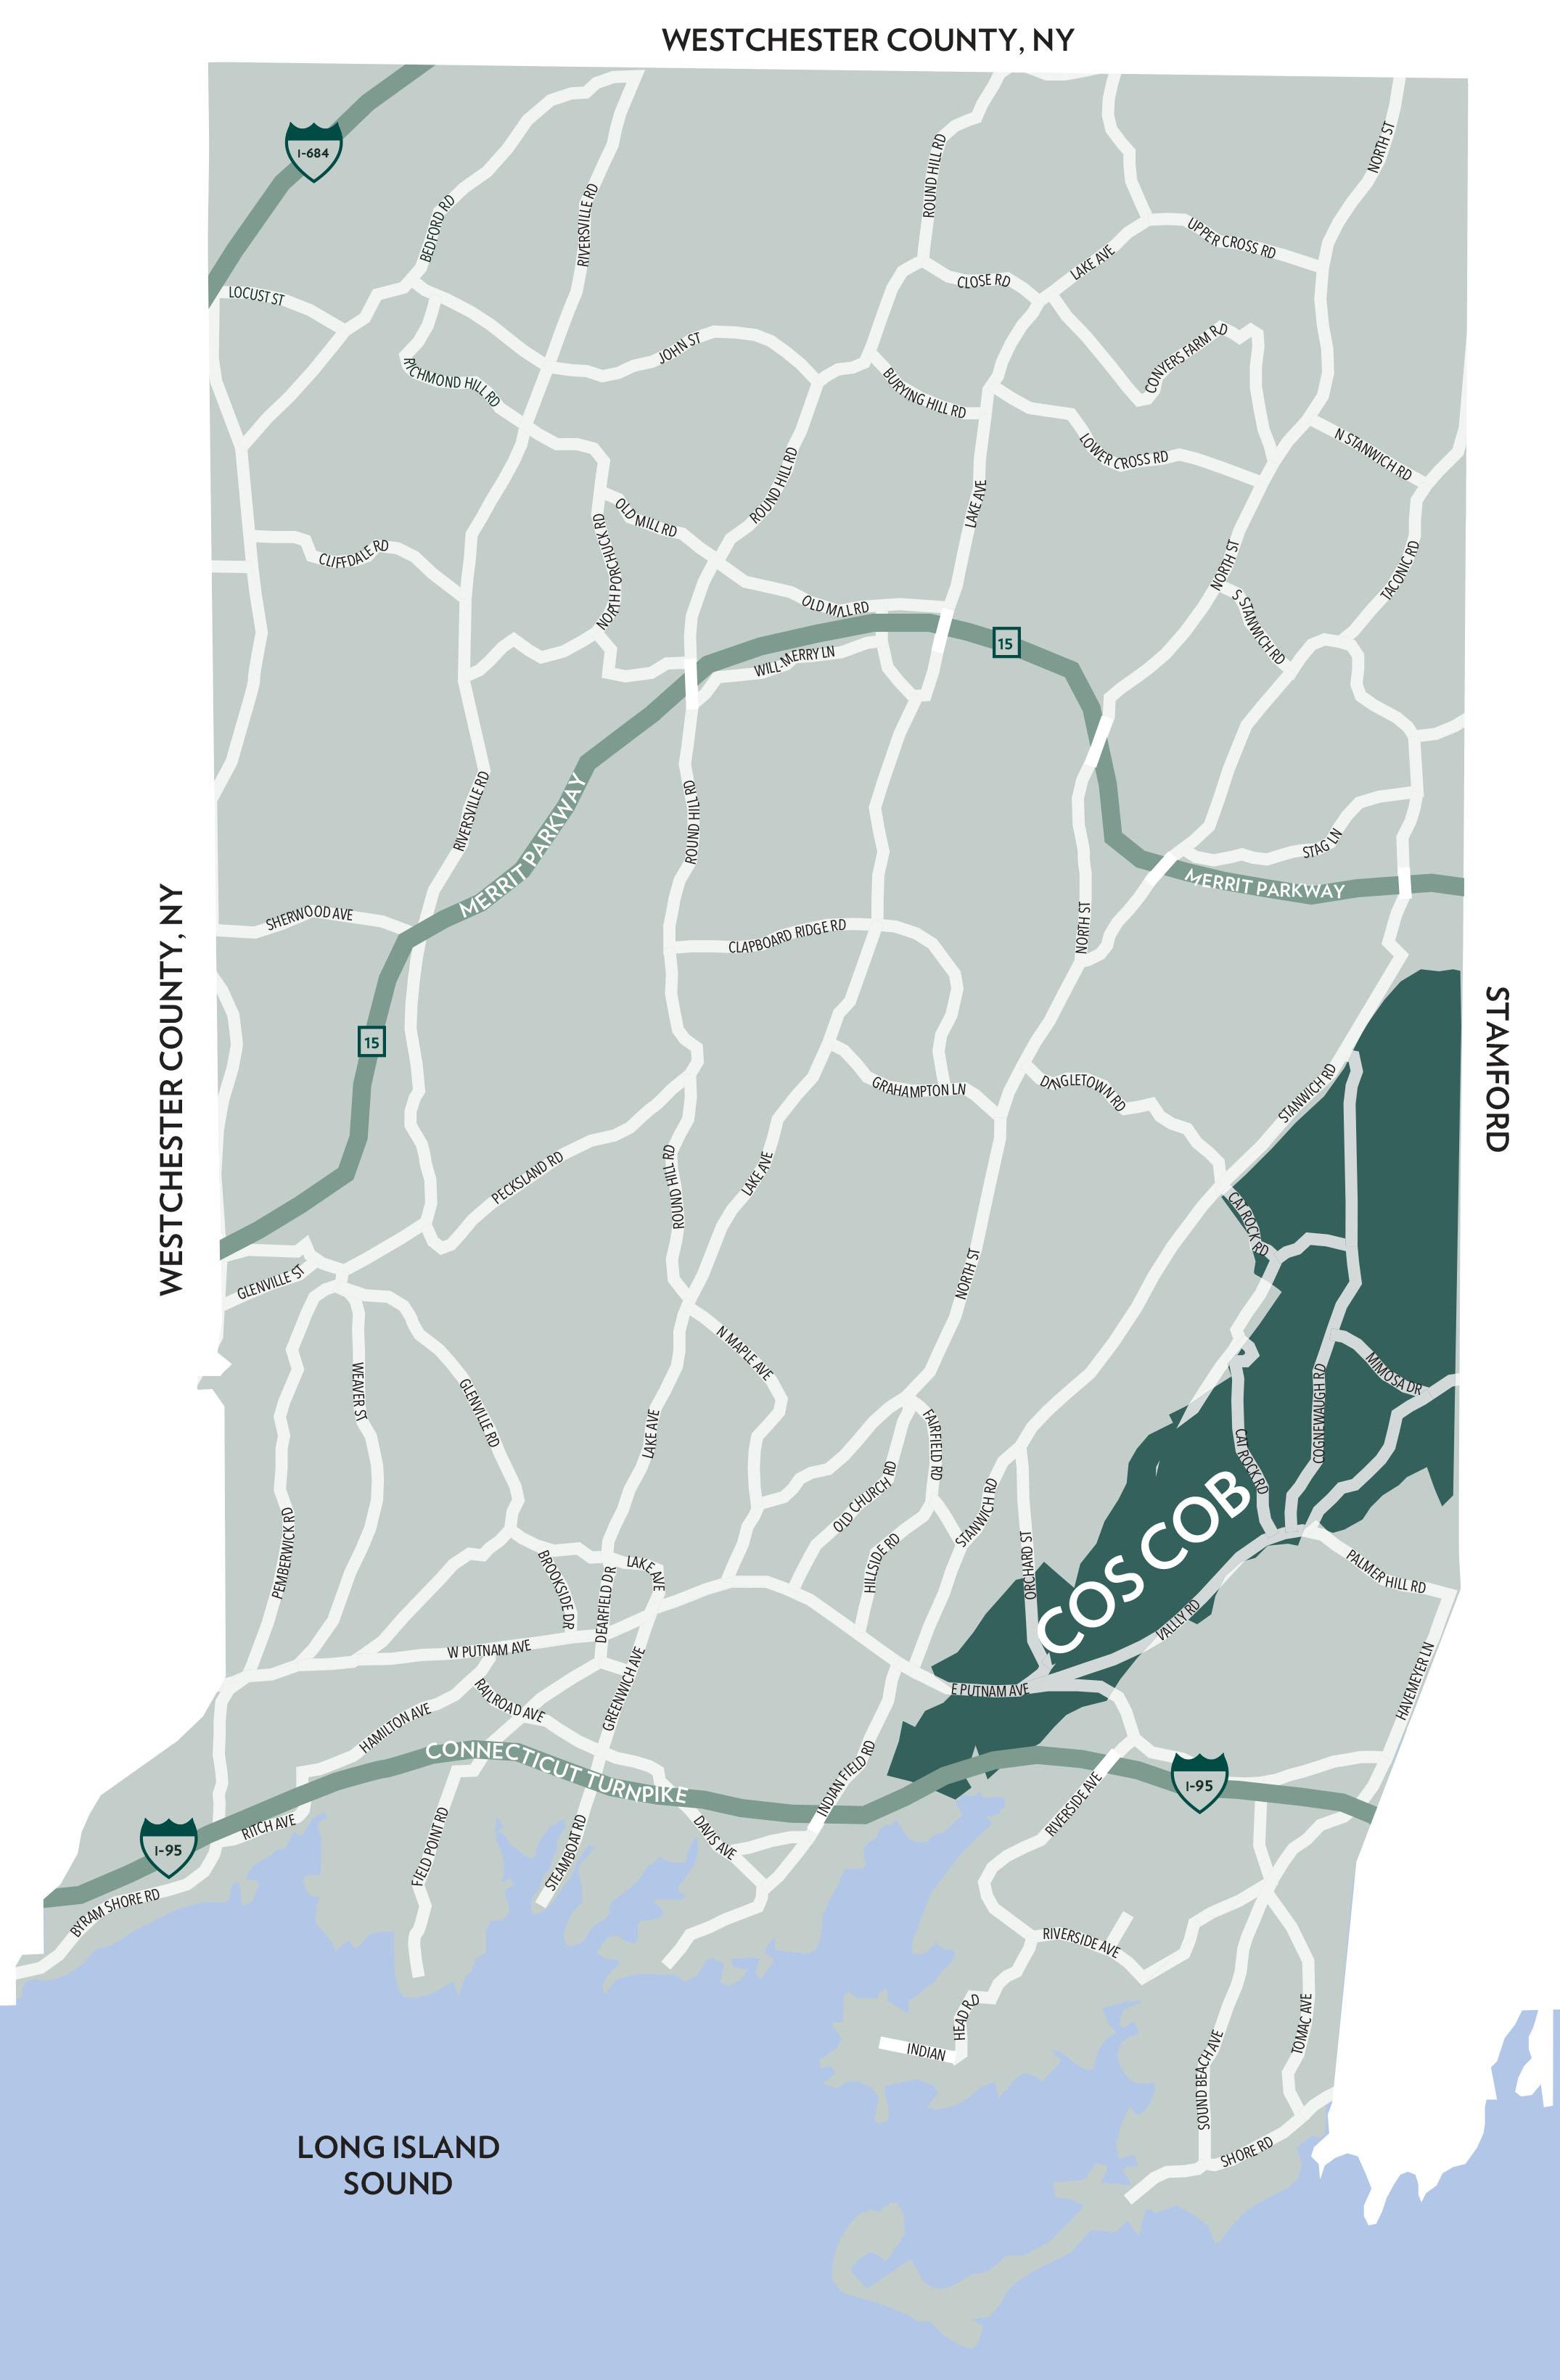
TEN-YEAR MARKET HISTORY
* Homes sold for 2023 are annualized based on actual sales year-to-date.
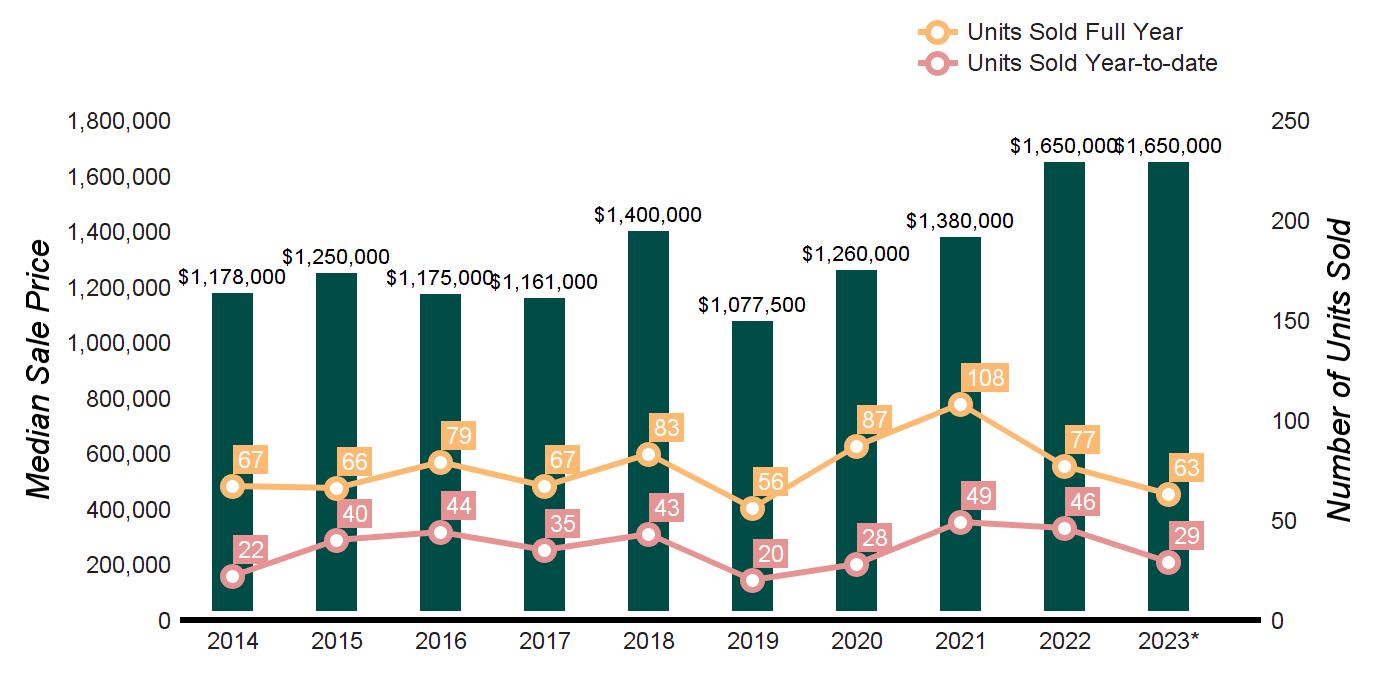
Q2 2023 Q2 2022 % CHANGE YTD 2023 YTD 2022 % CHANGE HOMES SOLD 19 29 -34.5% 29 46 -37.0% AVERAGE SALE PRICE $1,773,177 $1,916,310 -7.5% $1,642,316 $1,823,897 -10.0% MEDIAN SALE PRICE $1,665,000 $1,700,000 -2.1% $1,650,000 $1,585,000 4.1% AVERAGE PRICE PER SQUARE FOOT $611 $607 0.7% $579 $581 -0.3% AVERAGE DAYS ON MARKET 56 40 40.0% 70 51 37.3% % SALE PRICE TO LIST PRICE 104.3% 103.9% 0.4% 102.1% 102.3% -0.2%
Average Sale Price $1,254,598 $1,365,294 $1,321,116 $1,331,751 $1,564,416 $1,248,246 $1,408,910 $1,645,808 $1,815,667 $1,642,316 Average Sale Price Average Price/SqFt $466 $506 $490 $456 $486 $436 $444 $532 $583 $579 Average Price/SqFt Days On Market 103 137 139 142 153 141 157 100 51 70 Days On Market %Sale Price to List Price 96.1 96.2 96.0 95.0 95.4 94.4 96.1 98.1 101.0 102.1 %Sale Price to List Price
SUPPLY DEMAND ANALYSIS
SOLD PROPERTIES
COS COB
AS OF JUNE 30, 2023 AS OF JUNE 30, 2022 2023 vs. 2022 PRICE RANGE SUPPLY: ACTIVE LISTINGS DEMAND: PENDING SALES SUPPLY/ DEMAND RATIO* SUPPLY: ACTIVE LISTINGS DEMAND: PENDING SALES SUPPLY/ DEMAND RATIO* % CHANGE IN LISTINGS % CHANGE IN PENDINGS $0 - $999,999 3 0 Not Valid 1 2 1 200.0% -100.0% $1,000,000 - $1,999,999 8 9 1 5 7 1 60.0% 28.6% $2,000,000 - $2,999,999 6 4 2 5 4 1 20.0% 0.0% $3,000,000 - $3,999,999 3 1 3 0 0 Not Valid 0.0% 0.0% $4,000,000 - $4,999,999 0 0 Not Valid 0 0 Not Valid 0.0% 0.0% $5,000,000 - $5,999,999 0 0 Not Valid 0 0 Not Valid 0.0% 0.0% $6,000,000 - $7,999,999 0 0 Not Valid 0 0 Not Valid 0.0% 0.0% $8,000,000 - $9,999,999 0 0 Not Valid 0 0 Not Valid 0.0% 0.0% $10,000,000 and up 0 0 Not Valid 0 0 Not Valid 0.0% 0.0% MarketTotals 20 14 1 11 13 1 81.8% 7.7% *Supply Demand Ratio Key 1-4: High Demand 5-6: Balanced 7-9: Low Demand 10+: Very Low Demand
YEAR-TO-DATE YEAR-OVER-YEAR 01/01/202306/30/2023 01/01/202206/30/2022 % CHANGE 2023/2022 07/01/202206/30/2023 07/01/202106/30/2022 % CHANGE 2023/2022 $0 - $999,999 6 7 -14.3% 10 19 -47.4% $1,000,000 - $1,999,999 18 24 -25.0% 35 50 -30.0% $2,000,000 - $2,999,999 4 10 -60.0% 12 26 -53.8% $3,000,000 - $3,999,999 0 4 -100.0% 1 8 -87.5% $4,000,000 - $4,999,999 1 1 0.0% 2 2 0.0% $5,000,000 - $5,999,999 0 0 Not Valid 0 0 Not Valid $6,000,000 - $7,999,999 0 0 Not Valid 0 0 Not Valid $8,000,000 - $9,999,999 0 0 Not Valid 0 0 Not Valid $10,000,000 and up 0 0 Not Valid 0 0 Not Valid MarketTotals 29 46 -37.0% 60 105 -42.9%
Greenwich Multiple Listing Service, Single-family homes
Source:
QUARTERLY MARKET OVERVIEW
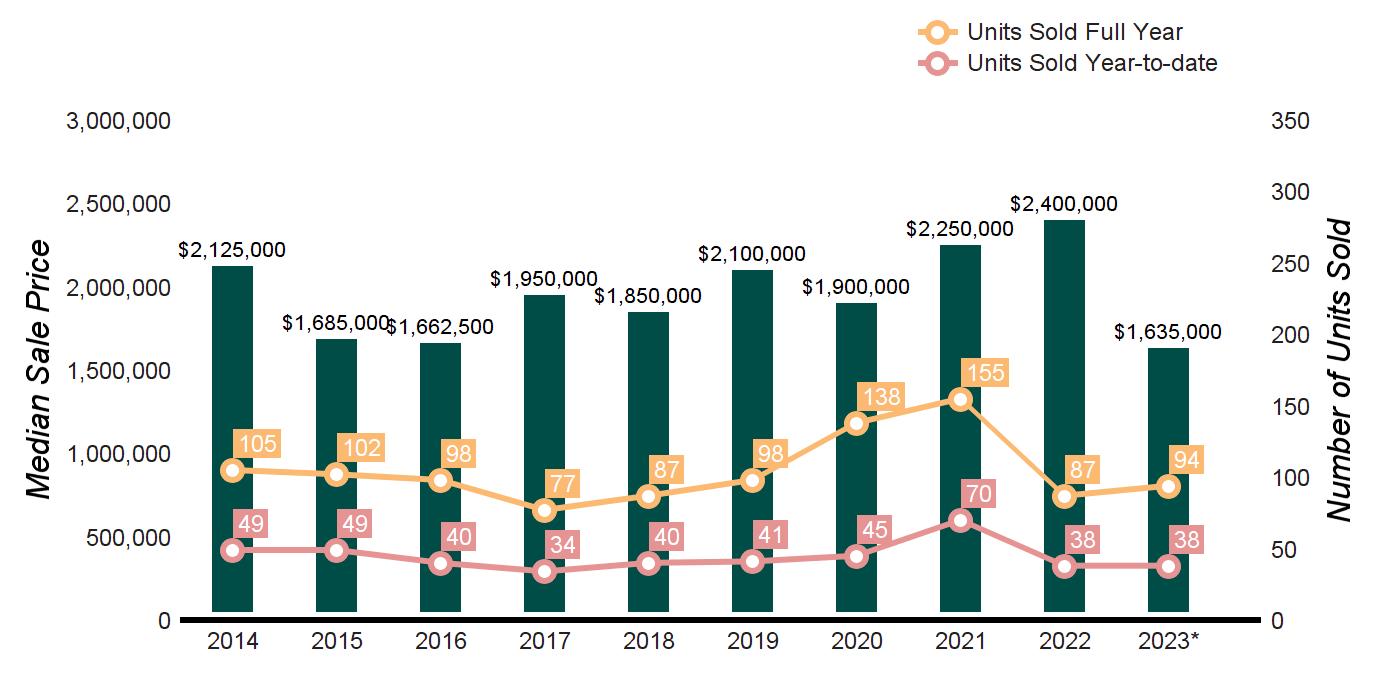
TEN-YEAR MARKET HISTORY
* Homes sold for 2023 are annualized based on actual sales year-to-date.
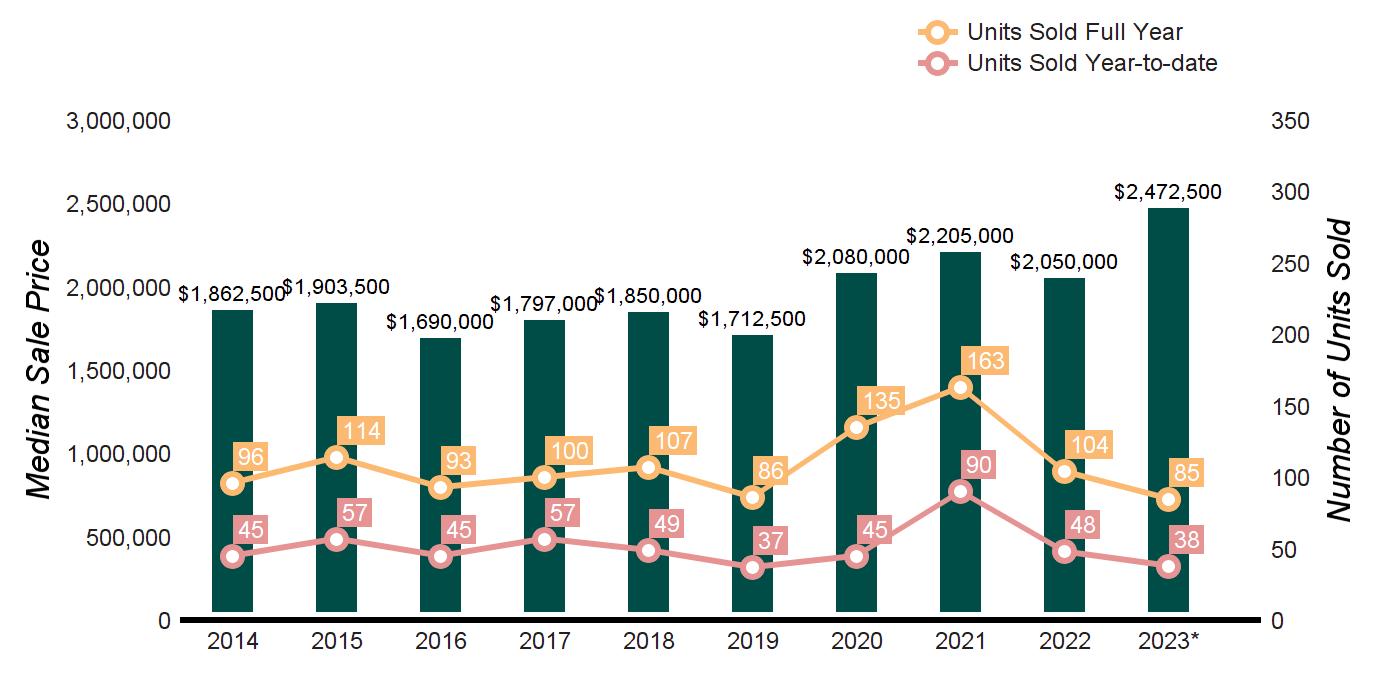
RIVERSIDE
Q2 2023 Q2 2022 % CHANGE YTD 2023 YTD 2022 % CHANGE HOMES SOLD 30 33 -9.1% 38 48 -20.8% AVERAGE SALE PRICE $2,490,682 $2,619,596 -4.9% $2,692,729 $2,485,232 8.3% MEDIAN SALE PRICE $2,345,482 $2,182,000 7.5% $2,472,500 $2,050,000 20.6% AVERAGE PRICE PER SQUARE FOOT $727 $799 -9.0% $752 $766 -1.8% AVERAGE DAYS ON MARKET 53 65 -18.5% 51 64 -20.3% % SALE PRICE TO LIST PRICE 102.4% 102.8% -0.4% 102.7% 102.2% 0.5%
Average Sale Price $2,000,919 $2,275,811 $2,121,616 $2,371,435 $2,353,592 $1,945,173 $2,587,852 $2,614,485 $2,507,628 $2,692,729 Average Sale Price Average Price/SqFt $599 $634 $601 $619 $595 $542 $618 $678 $757 $752 Average Price/SqFt Days On Market 107 122 138 147 168 180 125 75 54 51 Days On Market %Sale Price to List Price 96.6 94.6 93.9 94.7 94.9 94.1 94.3 99.7 102.0 102.7 %Sale Price to List Price
SUPPLY DEMAND ANALYSIS
SOLD PROPERTIES
RIVERSIDE
AS OF JUNE 30, 2023 AS OF JUNE 30, 2022 2023 vs. 2022 PRICE RANGE SUPPLY: ACTIVE LISTINGS DEMAND: PENDING SALES SUPPLY/ DEMAND RATIO* SUPPLY: ACTIVE LISTINGS DEMAND: PENDING SALES SUPPLY/ DEMAND RATIO* % CHANGE IN LISTINGS % CHANGE IN PENDINGS $0 - $999,999 0 0 Not Valid 2 0 Not Valid -100.0% 0.0% $1,000,000 - $1,999,999 0 4 0 7 9 1 -100.0% -55.6% $2,000,000 - $2,999,999 3 5 1 6 5 1 -50.0% 0.0% $3,000,000 - $3,999,999 0 3 0 3 4 1 -100.0% -25.0% $4,000,000 - $4,999,999 1 1 1 1 3 1 0.0% -66.7% $5,000,000 - $5,999,999 1 2 1 1 1 1 0.0% 100.0% $6,000,000 - $7,999,999 0 0 Not Valid 1 0 Not Valid -100.0% 0.0% $8,000,000 - $9,999,999 0 0 Not Valid 0 0 Not Valid 0.0% 0.0% $10,000,000 and up 2 1 2 2 0 Not Valid 0.0% 0.0% MarketTotals 7 16 1 23 22 1 -69.6% -27.3% *Supply Demand Ratio Key 1-4: High Demand 5-6: Balanced 7-9: Low Demand 10+: Very Low Demand
YEAR-TO-DATE YEAR-OVER-YEAR 01/01/202306/30/2023 01/01/202206/30/2022 % CHANGE 2023/2022 07/01/202206/30/2023 07/01/202106/30/2022 % CHANGE 2023/2022 $0 - $999,999 1 7 -85.7% 4 11 -63.6% $1,000,000 - $1,999,999 11 15 -26.7% 34 42 -19.0% $2,000,000 - $2,999,999 12 12 0.0% 26 29 -10.3% $3,000,000 - $3,999,999 7 7 0.0% 14 19 -26.3% $4,000,000 - $4,999,999 4 5 -20.0% 9 11 -18.2% $5,000,000 - $5,999,999 2 1 100.0% 4 6 -33.3% $6,000,000 - $7,999,999 1 0 Not Valid 3 2 50.0% $8,000,000 - $9,999,999 0 1 -100.0% 0 1 -100.0% $10,000,000 and up 0 0 Not Valid 0 0 Not Valid MarketTotals 38 48 -20.8% 94 121 -22.3%
Source: Greenwich Multiple Listing Service, Single-family homes
QUARTERLY MARKET OVERVIEW
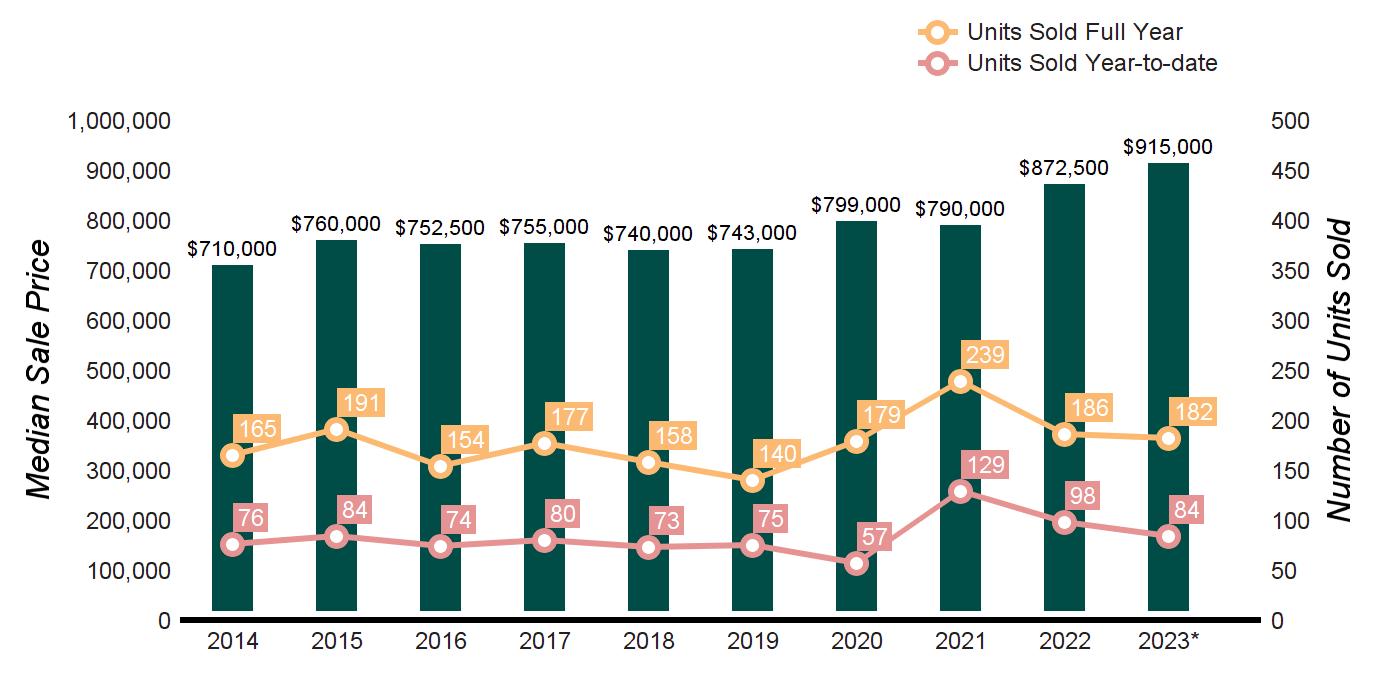
TEN-YEAR MARKET HISTORY
* Homes sold for 2023 are annualized based on actual sales year-to-date.
OLD GREENWICH
Q2 2023 Q2 2022 % CHANGE YTD 2023 YTD 2022 % CHANGE HOMES SOLD 21 23 -8.7% 38 38 0.0% AVERAGE SALE PRICE $2,003,728 $3,032,635 -33.9% $1,937,764 $2,902,253 -33.2% MEDIAN SALE PRICE $1,575,000 $2,150,000 -26.7% $1,635,000 $2,022,500 -19.2% AVERAGE PRICE PER SQUARE FOOT $787 $839 -6.2% $754 $828 -8.9% AVERAGE DAYS ON MARKET 43 68 -36.8% 58 67 -13.4% % SALE PRICE TO LIST PRICE 103.5% 101.7% 1.8% 101.1% 101.1% 0.0%
Average Sale Price $2,564,436 $2,017,057 $1,997,289 $2,455,255 $2,166,274 $2,323,307 $2,284,319 $2,624,038 $2,731,362 $1,937,764 Average Sale Price Average Price/SqFt $749 $644 $647 $709 $614 $637 $625 $751 $819 $754 Average Price/SqFt Days On Market 109 147 132 172 159 153 113 58 46 58 Days On Market %Sale Price to List Price 94.1 96.2 96.9 94.7 94.2 93.6 96.3 99.3 102.3 101.1 %Sale Price to List Price
SUPPLY DEMAND ANALYSIS
SOLD PROPERTIES
OLD GREENWICH
AS OF JUNE 30, 2023 AS OF JUNE 30, 2022 2023 vs. 2022 PRICE RANGE SUPPLY: ACTIVE LISTINGS DEMAND: PENDING SALES SUPPLY/ DEMAND RATIO* SUPPLY: ACTIVE LISTINGS DEMAND: PENDING SALES SUPPLY/ DEMAND RATIO* % CHANGE IN LISTINGS % CHANGE IN PENDINGS $0 - $999,999 2 1 2 0 1 0 0.0% 0.0% $1,000,000 - $1,999,999 1 3 1 8 5 2 -87.5% -40.0% $2,000,000 - $2,999,999 1 4 1 6 8 1 -83.3% -50.0% $3,000,000 - $3,999,999 3 3 1 1 4 1 200.0% -25.0% $4,000,000 - $4,999,999 4 3 1 2 2 1 100.0% 50.0% $5,000,000 - $5,999,999 0 0 Not Valid 2 1 2 -100.0% -100.0% $6,000,000 - $7,999,999 1 1 1 0 0 Not Valid 0.0% 0.0% $8,000,000 - $9,999,999 0 0 Not Valid 0 0 Not Valid 0.0% 0.0% $10,000,000 and up 1 0 Not Valid 1 0 Not Valid 0.0% 0.0% MarketTotals 13 15 1 20 21 1 -35.0% -28.6% *Supply Demand Ratio Key 1-4: High Demand 5-6: Balanced 7-9: Low Demand 10+: Very Low Demand
YEAR-TO-DATE YEAR-OVER-YEAR 01/01/202306/30/2023 01/01/202206/30/2022 % CHANGE 2023/2022 07/01/202206/30/2023 07/01/202106/30/2022 % CHANGE 2023/2022 $0 - $999,999 3 4 -25.0% 3 5 -40.0% $1,000,000 - $1,999,999 18 15 20.0% 34 44 -22.7% $2,000,000 - $2,999,999 12 7 71.4% 32 36 -11.1% $3,000,000 - $3,999,999 4 2 100.0% 12 15 -20.0% $4,000,000 - $4,999,999 0 5 -100.0% 2 11 -81.8% $5,000,000 - $5,999,999 1 0 Not Valid 4 0 Not Valid $6,000,000 - $7,999,999 0 4 -100.0% 0 11 -100.0% $8,000,000 - $9,999,999 0 0 Not Valid 0 0 Not Valid $10,000,000 and up 0 1 -100.0% 0 1 -100.0% MarketTotals 38 38 0.0% 87 123 -29.3%
Source:
Greenwich Multiple Listing Service, Single-family homes
QUARTERLY MARKET OVERVIEW
GREATER GREENWICH CONDOMINIUMS
TEN-YEAR MARKET HISTORY
* Homes sold for 2023 are annualized based on actual sales year-to-date.
Q2 2023 Q2 2022 % CHANGE YTD 2023 YTD 2022 % CHANGE HOMES SOLD 39 58 -32.8% 84 98 -14.3% AVERAGE SALE PRICE $1,207,179 $1,179,715 2.3% $1,188,470 $1,175,616 1.1% MEDIAN SALE PRICE $1,150,000 $955,000 20.4% $915,000 $900,000 1.7% AVERAGE PRICE PER SQUARE FOOT $734 $592 24.0% $708 $594 19.2% AVERAGE DAYS ON MARKET 36 62 -41.9% 54 68 -20.6% % SALE PRICE TO LIST PRICE 99.8% 102.8% -2.9% 100.3% 101.8% -1.5%
Average Sale Price $901,903 $1,028,489 $981,069 $1,030,294 $1,003,349 $959,215 $1,084,790 $1,088,265 $1,185,880 $1,188,470 Average Sale Price Average Price/SqFt $457 $495 $488 $492 $509 $480 $525 $548 $625 $708 Average Price/SqFt Days On Market 154 137 124 130 166 141 147 114 60 54 Days On Market %Sale Price to List Price 95.6 96.2 96.5 95.0 96.0 95.4 95.4 97.6 101.1 100.3 %Sale Price to List Price
GREATER GREENWICH CONDOMINIUMS
SUPPLY DEMAND ANALYSIS
AS OF JUNE 30, 2023 AS OF JUNE 30, 2022 2023 vs. 2022 PRICE RANGE SUPPLY: ACTIVE LISTINGS DEMAND: PENDING SALES SUPPLY/ DEMAND RATIO* SUPPLY: ACTIVE LISTINGS DEMAND: PENDING SALES SUPPLY/ DEMAND RATIO* % CHANGE IN LISTINGS % CHANGE IN PENDINGS $0 - $999,999 15 9 2 20 12 2 -25.0% -25.0% $1,000,000 - $1,999,999 8 12 1 11 6 2 -27.3% 100.0% $2,000,000 - $2,999,999 6 1 6 11 3 4 -45.5% -66.7% $3,000,000 - $3,999,999 5 4 1 3 3 1 66.7% 33.3% $4,000,000 - $4,999,999 0 0 Not Valid 0 3 0 0.0% -100.0% $5,000,000 - $5,999,999 1 0 Not Valid 1 0 Not Valid 0.0% 0.0% $6,000,000 - $7,999,999 0 0 Not Valid 0 0 Not Valid 0.0% 0.0% $8,000,000 - $9,999,999 0 0 Not Valid 0 0 Not Valid 0.0% 0.0% $10,000,000 and up 0 0 Not Valid 0 0 Not Valid 0.0% 0.0% MarketTotals 35 26 1 46 27 2 -23.9% -3.7% *Supply Demand Ratio Key 1-4: High Demand 5-6: Balanced 7-9: Low Demand 10+: Very Low Demand
YEAR-TO-DATE YEAR-OVER-YEAR 01/01/202306/30/2023 01/01/202206/30/2022 % CHANGE 2023/2022 07/01/202206/30/2023 07/01/202106/30/2022 % CHANGE 2023/2022 $0 - $999,999 46 56 -17.9% 100 125 -20.0% $1,000,000 - $1,999,999 29 28 3.6% 49 53 -7.5% $2,000,000 - $2,999,999 6 9 -33.3% 12 17 -29.4% $3,000,000 - $3,999,999 2 3 -33.3% 8 9 -11.1% $4,000,000 - $4,999,999 1 2 -50.0% 3 4 -25.0% $5,000,000 - $5,999,999 0 0 Not Valid 0 0 Not Valid $6,000,000 - $7,999,999 0 0 Not Valid 0 0 Not Valid $8,000,000 - $9,999,999 0 0 Not Valid 0 0 Not Valid $10,000,000 and up 0 0 Not Valid 0 0 Not Valid MarketTotals 84 98 -14.3% 172 208 -17.3%
SOLD PROPERTIES
Source: Greenwich Multiple Listing Service, Condominium
GREENWICH, CT · $6,750,000
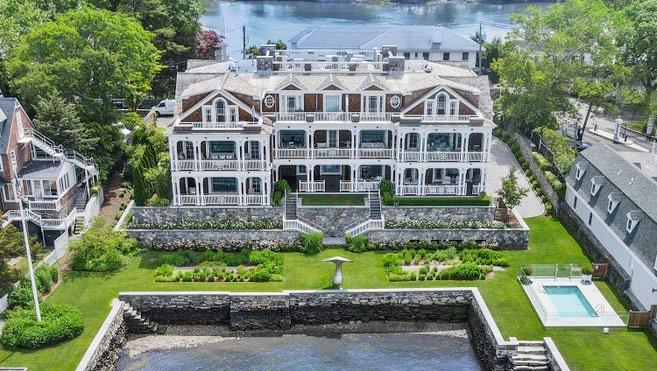
Architecturally significant Manor enchants with artistry and luxuries. Walk to Greenwich Avenue.
Joy Kim Metalios | M 917.620.9121
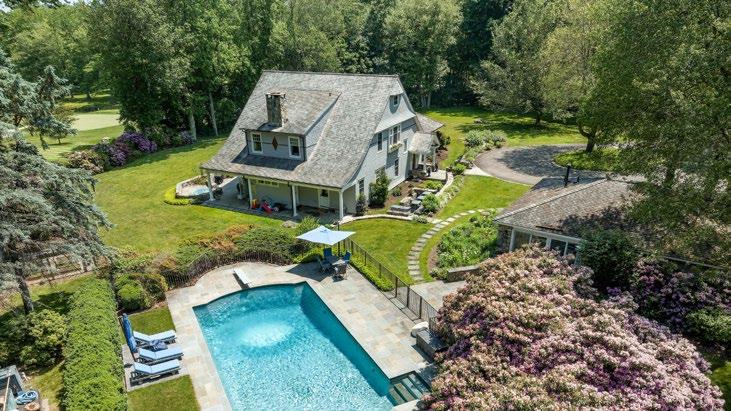
GREENWICH, CT · $6,350,000
Country estate on three flat gorgeous acres with pool, pool house and Har Tru tennis court.
Ellen Mosher | M 203.705.9680
GREENWICH, CT · $6,295,000
Turn-key custom home on four acres with pool and pool/guest house overlooks golf course.
Amanda Bates Goodro | M 203.536.1195
GREENWICH, CT · $5,495,000
Waterfront Condominium, ''The Corsair'', offers breathtaking views and waterside pool.
Kristy de la Sierra | M 203.526.6007
GREENWICH, CT · $5,495,000
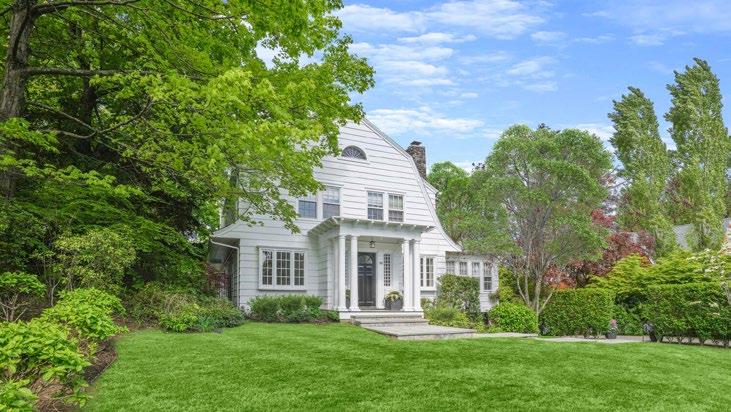
2023/2024 Center Hall Colonial set on 4.33 acres with pool and room for a pool house.
Amanda Bates Goodro | M 203.536.1195
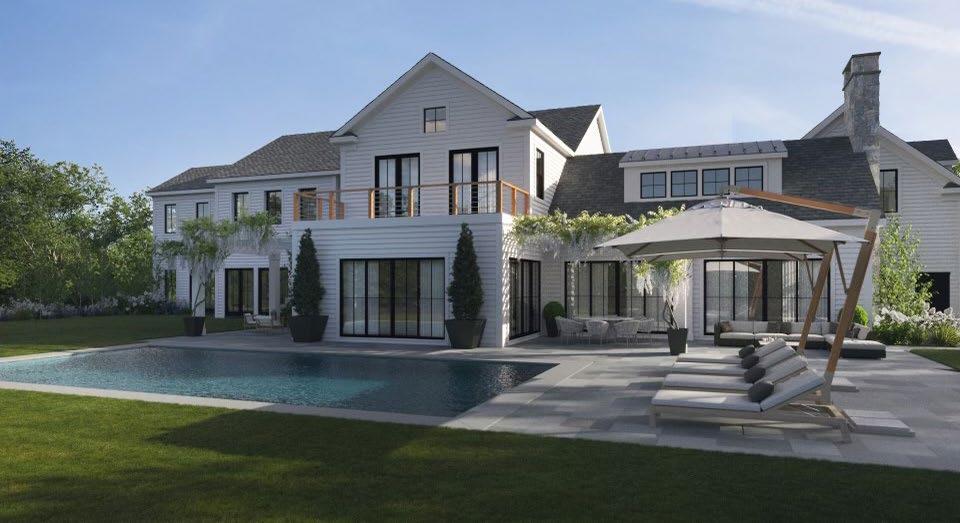
GREENWICH, CT · $3,595,000
Stunning five-bedroom home with pool. Walk to everything. Rental opportunity too.
Ellen Mosher | M 203.705.9680
203.869.0700 · 203.698.1234 · HOULIHANLAWRENCE.COM @AROUNDGREENWICH @AROUNDGREENWICH /GREENWICHCTREALESTATE Source: GMLS, 2015, 2016, 2017, 2018, 2019, 2020, 2021, 2022, total dollar volume of single family homes sold by company, Greater Greenwich #
8 YEARS IN A ROW
1 Brokerage in Greenwich
AREA’S MOST POWERFUL GLOBAL NETWORK Leading Real Estates Companies of the World | Luxury Portfolio International Mayfair International Realty | Board of Regents Luxury Real Estate
